Vanguard S&P 500 UCITS ETF: Difference between revisions
(main changes) |
No edit summary |
||
| Line 44: | Line 44: | ||
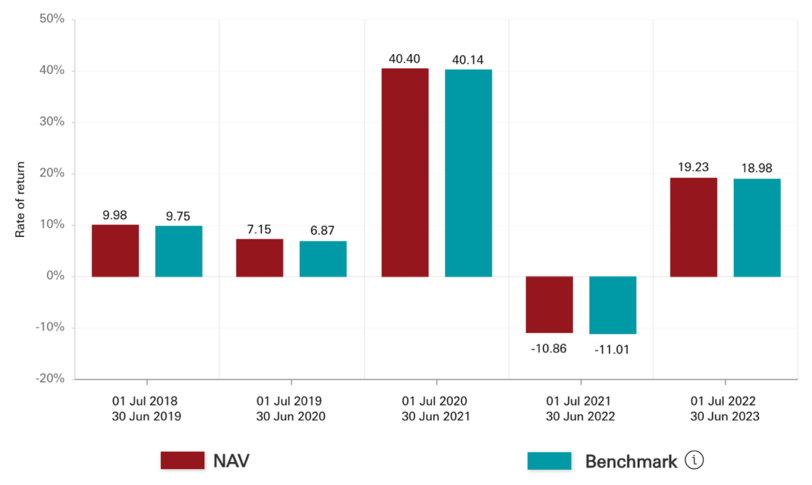
[[File:Fund and Index past performance.png|center|thumb|812x812px|''Figure 2. Fund and Index past performance as of 30 June 2023. Source: Vanguard'']] | [[File:Fund and Index past performance.png|center|thumb|812x812px|''Figure 2. Fund and Index past performance as of 30 June 2023. Source: Vanguard'']] | ||
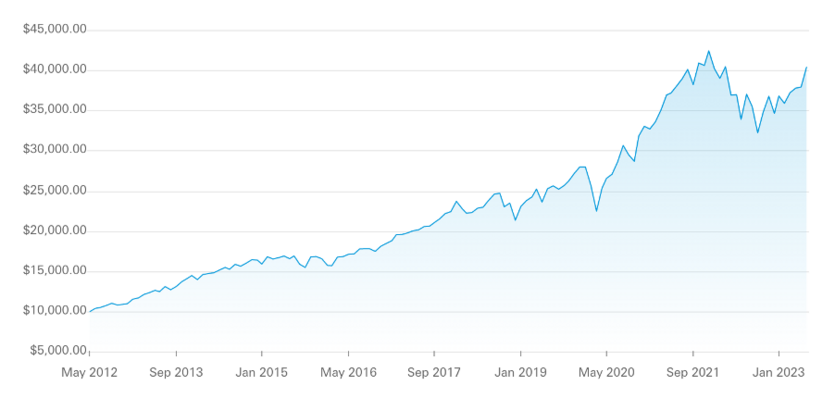
Figure 3 shows the past performance of the Fund based on a lump sum investment of $10,000. The figure shows a clear upward trend. | |||
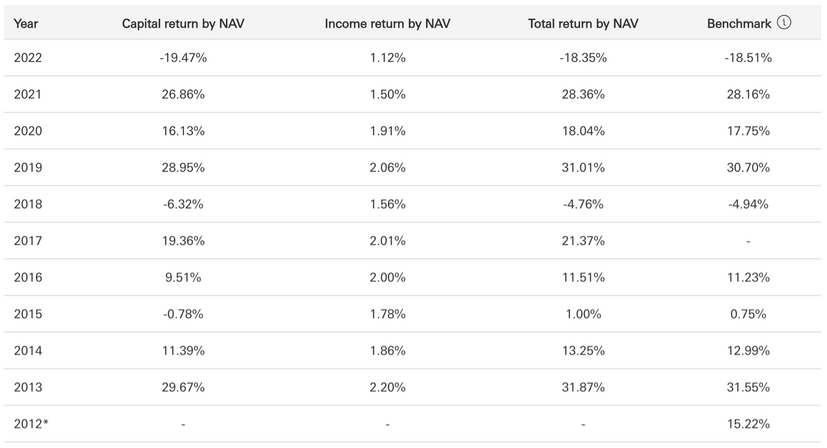
[[File:Past performance of Fund based on lump sum.png|center|thumb|835x835px|''Figure 3. Past performance of the Fund based on a lump sum investment of $10,000 as of 30 June 2023. Source: Vanguard'']]Table 1 shows the annual breakdown of the Fund’s performance since its inception compared to that of the Index. The total return of the Fund and the Index is negative in only two years since 2012. | |||
[[File:Table1.png|center|thumb|827x827px|Table 1. Annual breakdown of the Fund's performance since its inception compared to that of the Index. Source: Vanguard]] | |||
Table 2 shows the cumulative performance of the Fund compared to the Index since the Fund’s inception. There has been substantial cumulative returns from both the Fund and the Index. | |||
[[File:Table2.png|center|thumb|875x875px|Table 2. Cumulative performance of the Fund as of 30 Jun 2023 compared to the Index since the Fund's inception. Source: Vanguard]] | |||
=== Portfolio Data === | |||
[[File: | Table 3 shows the fundamental characteristics of the Fund compared to the Index side by side, as of 30 Jun 2023. | ||
[[File:Table3.png|center|thumb|905x905px|Table 3. Fundamental characteristics of the Fund compared to the Index. Source: Vanguard]] | |||
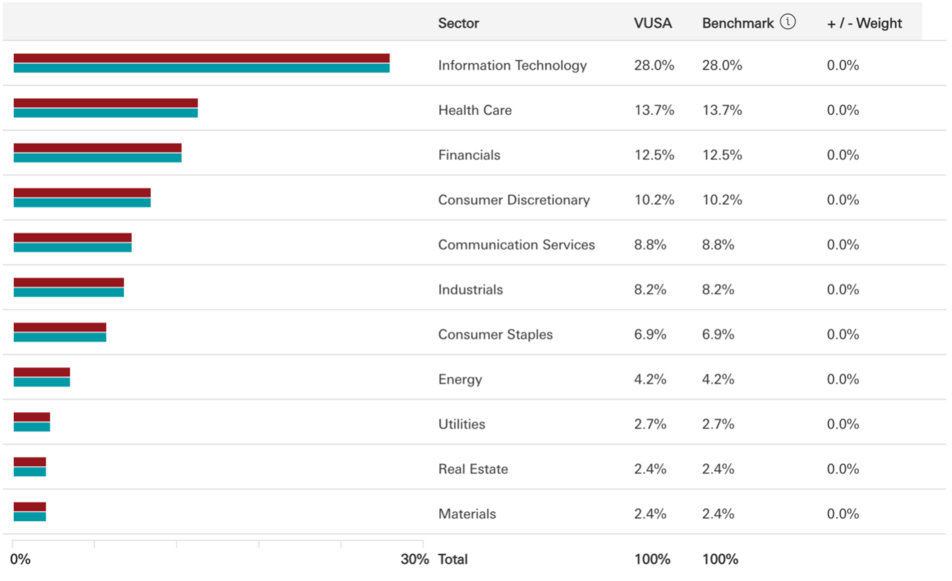
Table 4 shows the sector breakdown of the Fund, compared to the Index. It shows excellent diversification. | |||
[[File:Table4.png|center|thumb|952x952px|Table 4. Sector breakdown of the Fund and the Index. Source: Vanguard ]] | |||
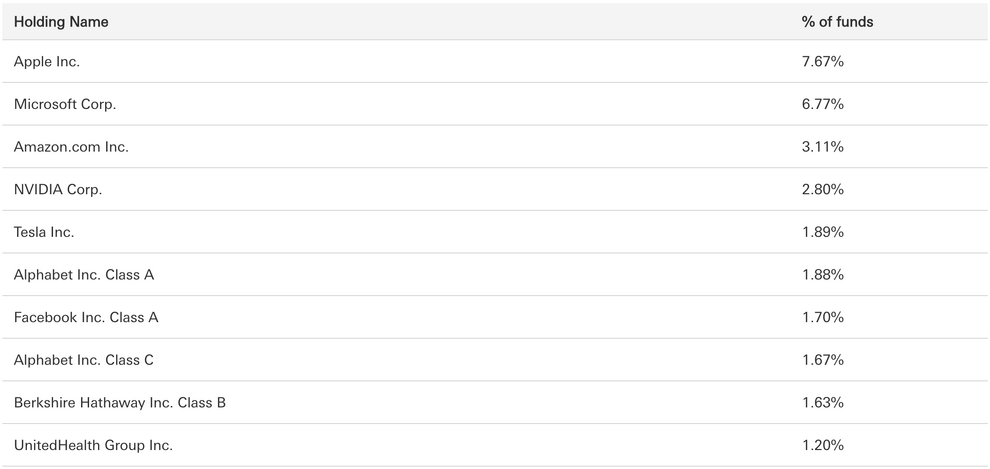
Table 5 shows the 10 stocks that makes up the majority of the Fund. | |||
[[File:Screenshot 2023-07-28 at 09.58.03.png|center|thumb|990x990px|Table 5. The 10 stocks that makes up the majority of the Fund. Source: Vanguard]] | |||
=== Cost Analysis === | |||
Revision as of 10:02, 28 July 2023
About Exchange-Traded Funds (ETFs)
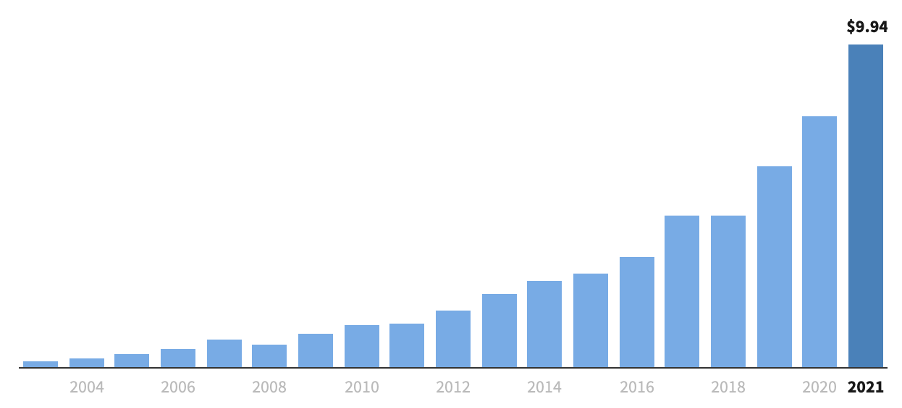
An exchange-traded fund (ETF) is a type of pooled investment security that will typically track a particular index, sector, commodity, or other assets, depending on the structure of the ETF. ETFs can be purchased or sold on a stock exchange in the same way a regular stock can, their share prices fluctuate as the ETF is bought and sold. Key advantages of ETFs include low expense ratios and fewer broker commissions than buying individual stocks. ETFs also hold multiple underlying assets, rather than only one like a stock does, making ETFs an excellent way of diversifying an investment portfolio. Due to these benefits, ETFs are becoming an increasingly popular investment security, as seen in figure 1.
Various types of ETFs are available to investors. ETFs are generally characterised as either passive or actively managed. Passive ETFs aim to replicate the performance of a broader index, such as the S&P 500 or a more targeted sector. Active managed ETFs do not target an index of securities but rather have portfolio managers making decisions about which securities to include in the portfolio. These funds tend to be more expensive to investors, and include bond ETFs which provide regular income to investors, stock ETFs and industry/sector ETFs.
Due to their growing popularity, investing in ETFs has become simple and easy. ETFs are now commonly available on most online investing platforms, retirement account provider sites and investing app. Many of these platforms offer commission-free trading, meaning that you do not have to pay fees to the platform providers to buy or sell ETFs.
About Vanguard
The Vanguard Group was founded by legendary investor John C. Bogle, author of “The Little Book of Common Sense Investing” (an absolute must-read). Unlike typical investment companies, Vanguard is structured in the U.S. to be owned by its own funds, which means it is owned by its investors. Vanguard’s profits are ultimately redirected to their own investors in the form of lower fees. Vanguard fully represents its founder’s investing philosophy of steady investing and keeping things simple with the index fund that track the performance of the entire market. This philosophy is one that is endorsed by many high-profile investors and economists across the world.
The Vanguard S&P 500 UCITS ETF
Overview
- Market price (as of 27 Jul 2023): £67.67
- Number of stocks (as of 30 Jun 2023): 504 stocks
- Ongoing charge (OCF): 0.07%
- Risk (SRRI): 6 out of 7
Key Facts
- ISA compatible: Yes
- Inception date: 22 May 2012
- Investment structure: Irish UCITS
- Total assets: $32.0 billion (as of 30 June 2023)
- Strategy: Index
- Benchmark: Standard and Poor’s 500 Index (S&P 500 Index)
- Asset class: Equity
- Dividend schedule: Quarterly
- Tax status: UK reporting
- Index ticker: SPTR500N
Objective
The Vanguard S&P 500 UCITS ETS (the “Fund”) employs a passive management investment approach, through physical acquisition of securities, and seeks to track the performance of the Standard & Poor’s 500 Index (the “Index”). The Index is a capitalisation-weighted index of the top 500 U.S. stocks and is designed to measure performance of the broad domestic economy through changes in the aggregate market value of the 500 stocks representing all major industries.
The Fund attempts to:
- Track the performance of the Index by investing in all constituent securities of the Index in the same proportion as the Index, and where not possible to fully replicate, the Fund will use a sampling process.
- Remain fully invested except in extraordinary market, political or similar conditions.
Past Performance
Figure 2 shows the past performance of the Fund alongside the benchmark Index. It can be seen that the Fund closely tracks the Index and suggests that the objective of the Fund is being met.
Figure 3 shows the past performance of the Fund based on a lump sum investment of $10,000. The figure shows a clear upward trend.
Table 1 shows the annual breakdown of the Fund’s performance since its inception compared to that of the Index. The total return of the Fund and the Index is negative in only two years since 2012.
Table 2 shows the cumulative performance of the Fund compared to the Index since the Fund’s inception. There has been substantial cumulative returns from both the Fund and the Index.
Portfolio Data
Table 3 shows the fundamental characteristics of the Fund compared to the Index side by side, as of 30 Jun 2023.
Table 4 shows the sector breakdown of the Fund, compared to the Index. It shows excellent diversification.
Table 5 shows the 10 stocks that makes up the majority of the Fund.
