 | |
| Type | Public Incorporated |
|---|---|
| Industry |
|
| Founded | 1999 in London, United Kingdom. |
| Founders |
|
| Headquarters | Burnaby, British Columbia , Canada |
Key people |
|
| Revenue | |
| Total assets | |
| Total equity | |
Number of employees | 215 (2022) |
| Website | https://www.dwavesys.com/ |
D-Wave Quantum Systems Inc.(D-Wave) is a Canadian quantum computing company, based in Burnaby, British Columbia. It is one of the pioneering firms investgating applications of quantum computing in various industries and scenarios, especially in Finanace, Manufactoring & Logistics, and Life Sciences, and providing services tailored to client's requirements.
Until the date the report is written, D-Wave's enterprise customers have built over 250 applications across different industries already.
The services D-Wave provides spans in different categories, by client role, by vertical industry, and by product. Please see details in the Products section.
History & Motivation
How did the idea of D-Wave come about?
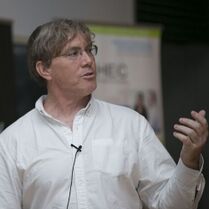
D-Wave was founded by Haig Farris (former chair of board), Geordie Rose (former CEO/CTO), Bob Wiens (former CFO), and Alexandre Zagoskin (former VP Research and Chief Scientist). Farris taught a business course at the University of British Columbia (UBC), where Rose obtained his PhD, and Zagoskin was a postdoctoral fellow.
D-Wave at the time operated as an offshoot from UBC, while maintaining ties with the Department of Physics and Astronomy. It funded academic research in quantum computing, thus building a collaborative network of research scientists. The company collaborated with several universities and institutions, including UBC, IPHT Jena, Université de Sherbrooke, University of Toronto, University of Twente, Chalmers University of Technology, University of Erlangen, and Jet Propulsion Laboratory. These partnerships were listed on D-Wave's website until 2005.
In June 2014, D-Wave announced a new quantum applications ecosystem with computational finance firm 1QB Information Technologies and cancer research group DNA-SEQ to focus on solving real-world problems with quantum hardware.
The company name refers to their first qubit design, with d-wave superconductors.
Mission of the company
D-Wave's singular focus is to help customers achieve real value by using quantum computing for practical business applications.
"Unlock the Power of Practical Quantum Computing Today" --D-Wave Website
Products & Services
What are the main offerings of the company?
Classification by Product(Type):
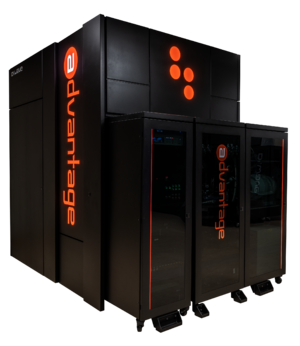
- Advantage: the world's first quantum computer built for business(n.b. distinct from D-Wave One, "the world's first commercial quantum computer"). It's processor has an architechture packing 5000+ qubits, with 15-way qubit connectivity.
- As a quantum computer, it intrinsically delivers improved performance on real-world problems over classical approaches. While compared to previous generations, the Advantage is 30x faster and delivers equal or better solutions 94% of the time compared to our previous generation system.
- "Using D-Wave quantum computers, we've been able to solve real protein design problems on quantum hardware." --Hans Melo, Menten AI Co-Founder & CEO
- More Successful Cases of Applications
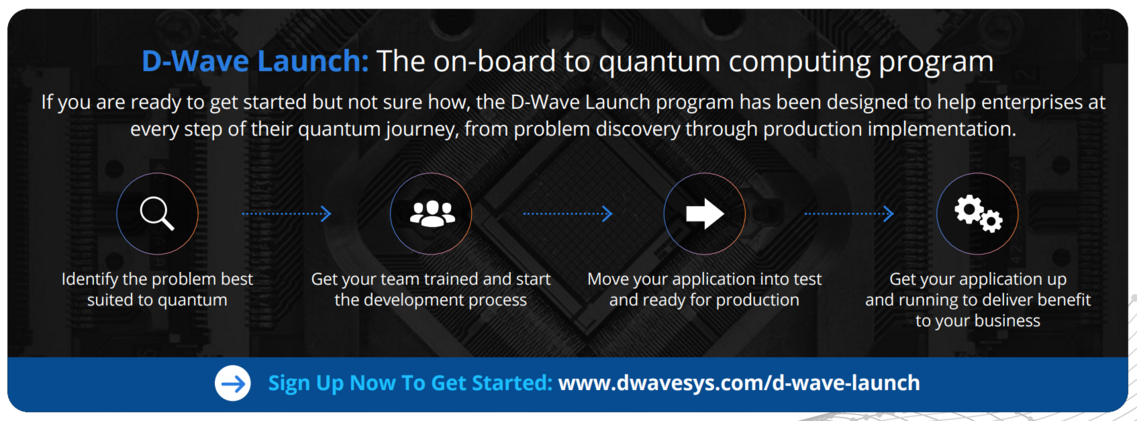
- Launch: the programme that deploys team of D-Wave experts and partners help enterprises go from problem discovery through production implementation.
- Leap: the real-time quantum cloud service platform.
- Real-time access to Advantage computer
- All you need to know is Python. The integrated development environment (IDE) streamlines your coding experience in one, simple environment. Ramp up fast with real application examples with usable code, demos, and a visual problem inspector that makes it easier to explore, learn, and activate your quantum application.
- All of the systems, cloud services, application development tools, and professional services needed for an end-to-end quantum computing journey for enterprises and developers. Leap includes an SDK, demos, Jupyter notebooks with live code, and a community to help jump start quantum application development.
- With the Leap Quantum Application Environment, developers can get started writing and running quantum applications today. Whether dense or sparse, the Leap hybrid solver service delivers excellent solutions to business-sized problems, often out-performing classical approaches.
- Ocean: a open source SDK written for mainly Python and C++, allowing enterprise access of quantum computing techniques in their business workflow.
Classification by Industry:
- Financial Services: Successful Cases: Portfolio Optimisation and Stratgy Design
- Life Sciences: Successful Cases: Clinical Studies and COVID-19(Menten AI)
- Manufactoring & Logistics: Successful Cases: E-Commerce Logistics and Value Chain
Classification by Client Profession:
- Technology & Business Lead: technology portfolio
- Developer: building real quantum applications
- Researcher: theoretical boundaries of quantum computing
- Topics: From practical applications like traffic optimization, to measuring quantum speedup, to finding the Higgs boson againCase Study: Auto-Scheduler for Pattison Food Group
Comparison of all D-Wave systems
| D-Wave One | D-Wave Two | D-Wave 2X | D-Wave 2000Q[1][2] | Advantage[3] | Advantage2 [4][5] | |
|---|---|---|---|---|---|---|
| scope="row" Template:Rh2 |Release date | May 2011 | May 2013 | August 2015 | January 2017 | 2020 | 2023-2024 |
| scope="row" class="rh heading table-rh" Template:Rh2 |Topology | Chimera | Chimera | Chimera | Chimera | Pegasus | Zephyr |
| scope="row" class="rh heading table-rh" Template:Rh2 |Code-name | Rainier | Vesuvius | W1K | W2K | Pegasus P16 | |
| scope="row" class="rh heading table-rh" Template:Rh2 |Qubits | 128 | 512 | 1152 | 2048 | 5000+ | 7440 |
| scope="row" class="rh heading table-rh" Template:Rh2 |Couplers | 352 | 1,472 | 3,360 | 6,016 | 35,000+ | |
| scope="row" class="rh heading table-rh" Template:Rh2 |Connectivity | 6 | 6 | 6 | 6 | 15 | 20 |
| Josephson Junctions | 24,000 | ? | 128,000 | 128,472[6] | 1,030,000 | |
| scope="row" class="rh heading table-rh" Template:Rh2 |I/O lines / Control lines | ? | 192 | 192 | 200[7] | ? | |
| scope="row" class="rh heading table-rh" Template:Rh2 |Active area | 5.5 mm × 5.5 mm | 8.4 mm × 8.4 mm | ||||
| scope="row" class="rh heading table-rh" Template:Rh2 |On-chip memory | 22 kB | 130 kB | ||||
| Operating Temperatue(K) | ? | 0.02 | 0.015 | 0.015 | <0.015 | |
| Power Consumption (kW) | ? | 15.5 | 25 | 25 | 25 | |
| scope="row" class="rh heading table-rh" Template:Rh2 |Buyers | Lockheed Martin |
|
|
|
|
Market
Total Addressable Market
Here, the total addressable market (TAM) is defined as the global financial service, healthcare, energy, materials science, manufactoring, logistics, public sector, and cryptography market, and based on a number of assumptions, it is estimated that the size of the market as of 2022, in terms of market capitalisation, is $418 billion. The figure will reach $500 billion in 2030 by pessimists, and optimists believe it will reach $1 trillion instead. But do note this is the current markets D-Wave is involved, there are other unexplored sectors the firm could potentially expand into.
The actual TAM size will depend on a number of factors, including the development of new quantum computing hardware and software, the adoption of quantum computing by businesses and governments, and the availability of quantum computing experts.
Serviceable Available Market(SAM)
D-wave did not publically disclosed its SAM. Howeverm, according to a report by MarketsandMarkets, the global quantum computing market was valued at $1.5 billion in 2021 and is projected to reach $8.4 billion by 2026, at a CAGR of 42.2%. This suggests that the SAM for quantum computing is around $8.4 billion.
Servicable Obtainable Market(SOM)
D-wave did not publically disclosed its SOM. Given the fact that D-Wave is well-funded, with a strong technology platform, a growing customer base, and a strong management team. I estimate, on the assumption that D-Wave will capture around 25% of the SAM, the company's SOM is around $2 billion.
Competition
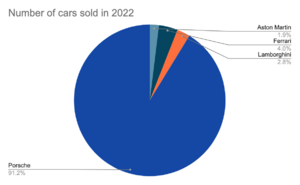
There are several other companies that compete with D-Wave in the offering of luxury sports cars worldwide. Some notable examples include Ferrari, Rolls-Royce, Lamborghini, Bentley and Porsche. Although Aston Martin is unique in several ways, the other companies are much more diversified in the products and services they offer and will therefore have several streams of income which may be more reliable in the long run. Porsche appears to dominate the luxury sports car market, while the other companies target more niche buyers.
Ferrari, renowned for its sports cars, boasts a broader range of products and services. In addition to their automotive division, Ferrari operates museums in Modena and Maranello, captivating enthusiasts with a rich display of automotive history. Furthermore, their restaurant in Maranello offers a unique dining experience. Expanding beyond the automotive sector, Ferrari has ventured into the realm of entertainment by establishing theme parks in Abu Dhabi and Spain, attracting visitors seeking an immersive Ferrari-themed adventure. Additionally, Ferrari extends its brand reach through apparel and accessories, allowing enthusiasts to connect with the brand beyond the realm of automotive performance. Notably, they also provide financial services to clients, further diversifying their revenue streams. [12]
Rolls-Royce, while recognized for its luxurious vehicles, also engages in engineering and selling aero engines for commercial and military aircraft. This diversification into the aerospace industry demonstrates their commitment to cutting-edge engineering and technological innovation. By capitalizing on their expertise beyond the automotive sector, Rolls-Royce taps into additional revenue streams and widens its scope of influence. [13]
Within the Volkswagen Group, Lamborghini, Bentley, and Porsche operate as luxury sports car manufacturers. However, the group's portfolio encompasses a wider array of brands. Seat and Škoda, for instance, cater to the mass market with their offerings of regular passenger cars, showcasing the group's ability to target diverse customer segments. Moreover, the Volkswagen Group provides financial services for customer financing, supplementing their revenue generation beyond the sale of vehicles. [14]
| Aston Martin DBX | Ferrari 458 Italia | Lamborghini Urus | McLaren 570S | Porsche Cayenne S | |
|---|---|---|---|---|---|
| Price | ~$200,000 | ~$230,000 | ~$235,000 | ~$194,000 | ~$90,000 |
| Top Speed (miles/h) | 181 | 202 | 189 | 204 | 154 |
| 0-62mph | 3.9 | 3.4 | 3.6 | 3.2 | 6 |
| Power (hp) | 542 | 562 | 641 | 562 | 348 |
| Number of cars sold in 2022 | 3219 | - | 5367 | - | 95,604 |
By acknowledging the various revenue streams of these competitors, it becomes apparent that Aston Martin's specialization in luxury sports cars may offer a focused approach to the market. While the other companies exhibit broader diversification, the distinctive qualities, exclusivity, and craftsmanship associated with Aston Martin contribute to its unique appeal. Aston Martin's commitment to refining the art of luxury sports cars positions it as a distinctive brand in the automotive world.
Team
Leadership
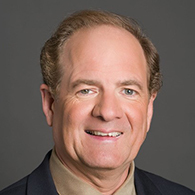
Chairperson of the Board - Steven West
Mr West is a 30‐year veteran of the information technology marketplace and currently the founder and a partner in Emerging Company Partners LLC, a technology consulting firm.
Over the course of his career, he has held many executive positions, including president and CEO of Entera, an Internet content delivery firm (acquired by Blue Coat Systems, Inc.); CEO of Hitachi Data Systems; and Group Executive of EDS. West is a former board director at Cisco, where he served for 23 years, and Autodesk where he served for nine years. He also served on the boards of Delta‐Q Technologies and Bycast Inc.
Chief Executive Officer - Dr Alan Baratz
Dr. Alan Baratz became the CEO of D-Wave in 2020. Previously, as Executive Vice President of R&D and Chief Product Officer, he drove the development, delivery, and support of all of D-Wave’s products, technologies, and applications. He has over 25 years of experience in product development and bringing new products to market at leading technology companies and software startups.
As the first president of JavaSoft at Sun Microsystems, Baratz oversaw the growth and adoption of the Java platform from its infancy to a robust platform supporting mission-critical applications in nearly 80 percent of Fortune 1000 companies. He has also held executive positions at Symphony, Avaya, Cisco, and IBM. He served as CEO and president of Versata, Zaplet, and NeoPath Networks, and as a MD at Warburg Pincus LLC. Dr Baratz holds a doctorate in computer science from Massachusetts Institute of Technology.
Co-Founder, Chief Scientist, and Company Secretary - Eric Ladizinsky
Eric Ladizinsky is a senior scientific management executive with strong background in physics, engineering, materials, and manufacturing. He brings specific expertise in multi-disciplinary R&D, technical team building, creation and management of infrastructure, and convergence of R&D efforts with full-scale manufacturing. At Northrop Grumman Space Technology (formerly TRW, Inc.), he ran a multi-million dollar DARPA program in Quantum Computing using superconducting integrated circuit technology.
Mr. Ladizinsky leads D-Wave's technical effort to develop the superconducting integrated circuit fabrication process and has introduced industrial optimization practices for high yields, including construction of custom vacuum systems, automated testing infrastructure, and specialized low noise electronics. From our US foundry location, he runs the entire fabrication process - thin film deposition, photolithography, etching, testing and troubleshooting. Mr. Ladizinsky is also an Adjunct Professor of Physics at Loyola Marymount University, where he has taught courses including classical mechanics, electromagnetic theory and quantum theory. He worked with faculty and students to bring the quantum mechanics program current with state-of-the-art in quantum theory, covering quantum computing, decoherence theory and modern experimental techniques.
Mr. Ladizinsky has a BSc. Physics and Mathematics degree from the University of California, Los Angeles. He has 3 granted US patents covering advanced superconducting IC processes and new materials development.
Chief People Officer - Victoria Brydon
Ms Victoria Brydon is a seasoned business executive with 20 years of progressive and broad experience. Currently the Senior Vice President, People and Operational Excellence, Victoria leads the development and execution of talent strategy for D-Wave, and works cross functionally to provide executive oversight to ensure business operational excellence.
Prior experience includes Kasian Architecture, Sierra Systems, and PMC-Sierra. Victoria holds a Masters of Business Administration from Royal Roads University, and a Bachelor of Commerce from Queen’s University. Victoria is a Certified Executive Coach, and Chair of the Board of the BC SPCA where she also serves as President, and Chair of the Executive and Human Resources Committee.
Senior Vice President, Quantum Technologies and Systems Products - Mark W Johnson
Mr Johnson has been involved in the development and commercialization of technology for nearly 25 years. Mark leads the R&D and quantum hardware programs. Mark joined D-Wave in 2005 as an experimental physicist and superconducting circuit design engineer to help develop, build, and deliver the world's first commercially available quantum computer. He continued to work with the D-Wave team to develop and release subsequent generations of quantum computers.
Most recently, Mr Johnson led the development and delivery of the company’s 5th generation, and most powerful and connected commercial quantum system ever built, the Advantage system. Prior to joining D-Wave, Mark was a scientist with the Superconductive Electronics Organization at the Space Park facility of Northrop Grumman, formerly TRW, Inc., developing superconductive analog-to-digital converters and digital signal processors for communications applications. Mark holds a doctorate in physics from the University of Rochester.
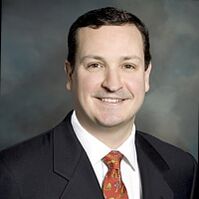
Chief Financial Officer - John Markovich
Mr Markovich is senior financial executive with extensive experience and successful track record in leading both public and private high growth technology companies through all phases of development from pre-revenue venture capital-backed start-ups to a $1.2 billion NYSE-listed Fortune 500 multinational manufacturer.
Markocivh has broad experience in negotiating and closing complex domestic and international financing and commercial transactions; aligning financing strategies with operating strategies; and positioning companies for M&A / IPO exits. Particular focus on developing scalable organizational infrastructures through building high performance teams; designing and implementing appropriate systems (ERP); and institutionalizing efficient processes and corresponding policies. Strong operations orientation directed at identifying and implementing operational efficiencies, cost savings, improved working capital management and risk reduction while managing towards critical value-driving operational metrics with an emphasis on cash flow. Meaningful contributor towards developing, refining and executing corporate strategy. Areas of functional responsibility include accounting, tax, treasury, FP&A, IR, HR, legal, M&A, operations, IT and customer service.
Audit Committee Chair - Roger Biscay
Roger holds over 20 years of experience driving financial management, strategy, organizational planning, and compliance across high‐tech public and private companies. He has served as Senior Vice President and Treasurer of Cisco Systems since April 2017, where his responsibilities include corporate finance, investments, cash management, foreign exchange, risk transfer, safety, security and business resiliency. He is also Senior Vice President and Corporate Treasurerand Corporate Security of Cisco.
He has served on the board of directors of Wasabi Technologies since August 2021, including as a member of the audit committee and governance committee, and has held senior financial markets positions in the areas of fixed income, equity capital markets and foreign exchange with the Royal Bank of Canada, Banque Paribas and Lehman Brothers.
Compensation Committee Chair - Amy Cappellanti‐Wolf
Ms Cappellanti-Wolf is an accomplished senior human resources professional, business transformer and executive coach with expertise ranging from startups to Fortune 500 enterprises. Her management roles span high‐tech (Symantec, Silver Spring Networks, Cisco, Sun Microsystems), entertainment (The Walt Disney Company), and consumer goods (Frito‐Lay).
Since May 2022 she has served as Chief Human Resources Officer and Real Estate Leader of Cohesity. From January 2014 to February 2020, Amy was the Chief Human Resources Officer and Real Estate Leader for Symantec. She also serves on the board of Softchoice, a provider of technology solutions and managed services; Betterworks, a continuous performance management platform company; and Pivotal, a non‐profit that focuses on foster youth education and employment.
Majority Owners
| Name | Equities | % | Valuation ($M) | Recent Changes(shares) |
|---|---|---|---|---|
| The Public Sector Pension(PSP) Investment | 18.37 | 22.80 | 38.40 | |
| Goldman Sachs & Co. LLC (private banking) | 7.94 | 9.85 | 16.59 | -307 |
| Lockheed Martin Investment Management | 0.92 | 1.14 | 1.91 | |
| 180 Degree Capital Corp. (Investment Management) | 0.91 | 1.13 | 1.91 | |
| The Vanguard Group, Inc. | 0.49 | 0.61 | 1.03 | |
| BlackRock Fund Advisors | 0.43 | 0.54 | 0.90 | |
| SG Americas Securities LLC | 0.34 | 0.42 | 0.71 | +340,243 |
| Geode Capital Management LLC | 0.33 | 0.41 | 0.69 | +113,543 |
| Purpose Investments, Inc. | 0.23 | 0.29 | 0.49 | -3,180 |
| Charles Schwab Investment Management | 0.20 | 0.25 | 0.43 | -2,832 |
Top 10 Mutual Funds Holding D-Wave
Financials
Most recent quarter(Q1)
The first quarter financial results for 2023 indicate a positive, but slower trajectory for the company's revenue, which has decreased by 13% year-on-year, steady at $1.6 million. Given D-Wave has strong focus on research and development, while the revenue is increasing, its current profit and net assets are still negative, and have signs of decreasing, especially since the release of Advantage 2 in 2022.
| Income Statement | Q1 2022 | Q1 2023 | % change | abs change($) |
|---|---|---|---|---|
| Revenue ($m) | 1.7 | 1.6 | -27.2 | -0.13 |
| Gross Profit (GAAP, $m) | 1.1 | 0.421 | -61.6 | -0.676 |
| Gross Profit (non-GAAP, $m) | 1.2 | 0.852 | -27.1 | -0.317 |
| Gross Margin (GAAP, %) | 64.0 | 26.6 | -37.4 | |
| Gross Margin (non-GAAP, %) | 68.2 | 53.8 | -14.4 | |
| Operating Profit ($m) | -47.7 | -50.9 | -6.7 | |
| Net Profit before tax ($m) | -111.6 | -74.2 | 33.5 |
Annual Performance
| Income Statement | FY-2020 | FY-2021 | FY-2022 |
|---|---|---|---|
| Revenue ($m) | 5.16 | 6.28 | 7.17 |
| Revenue Growth (%) | 21.69 | 14.24 | |
| Gross Profit ($m) | 4.25 | 4.53 | 4.25 |
| Gross Margin (%) | 82.27 | 72.13 | 59.25 |
| Operating Profit ($m) | -31.47 | -38.95 | -59.46 |
| Net Profit ($m) | -10.02 | -31.55 | -51.53 |
| EBIT ($m) | -4.76 | -29.82 | -46.9 |
Balance Sheet: Past 3 years
| Balance Sheet | FY-20 | FY-21 | FY-22 |
|---|---|---|---|
| Total Assets (£m) | 47.46 | 32.61 | 26.95 |
| Total Liabilities (£m) | 14.73 | 29.59 | 32.86 |
| Net Assets (£m) | 32.73 | 3.02 | -5.91 |
Income Statement: 5-year Forecast(by historical CAGR)
| Income Statement | FY-23 | FY-24 | FY-25 | FY-26 | FY-27 |
|---|---|---|---|---|---|
| Revenue (£m) | 1630.2 | 1858.4 | 2081.4 | 2289.5 | 2404.0 |
| Gross Profit (£m) | 554.3 | 659.7 | 749.3 | 847.1 | 913.5 |
| Gross Margin (%) | 34% | 36% | 36% | 37% | 38% |
| EBIT(£m) | -100.32 | -214.57 | -458.95 | -981.67 | -2099.74 |
The historical CAGR(compound annual growth rate) of revenues is: , for Gross Profit, this is , for Gross Margin, this is , for EBIT, this is . The CAGRs are used to extrapolate the future income statements.
As we can see, the historical CAGR for gross margin and EBIT, historical Net Assets are all non-positive, while revenues are increasing, positive, this implies significant increase in operating expenses. Given D-Wave is constantly doing research and development in the field of quantum applications, this reflects:
- R&D in the lastest technology is cash-burning, especially when exploring applications of quantum computing.
- The company is still in the early stages of development. This is often the case with companies that are developing new technologies. The development process can be expensive and time-consuming, and it can take several years before a new technology becomes commercially viable. During this time, the company may be operating at a loss, which could lead to a negative CAGR.
- The company is facing stiff competition. The quantum computing market is still in its early stages, and there are a number of leading companies in computer hardware, including IBM, Microsoft, Google, Honeywell, are competing to develop the most advanced technology. This competition could drive down prices and make it difficult for D-Wave to generate profits.
- The company's technology is not yet ready for prime time. Quantum computing is not yet fully exploited, which can be implied by the D-Wave's expanding Total Addressabel Market(see Markets section). If D-Wave's technology is not yet ready for commercial use, this could also lead to a negative CAGR.
In conclusion, the Income Statement forecast in the next few years might not be accurate, if CAGR is solely used, while the sample length is too short, this does not accurate demonstrate the potential performance of D-wave in the upcoming years, especially when there will be technological breakthrough changing the situation in the upcoming years.
Risks
Each risk is scored according to the risk matrix below:
| Impact | ||||
|---|---|---|---|---|
| Low | Medium | High | ||
| Likelihood | Low | A1 | B1 | C1 |
| Medium | A2 | B2 | C2 | |
| High | A3 | B3 | C3 | |
- Aston Martin's revenue could plummet without sufficient demand for high-end luxury motor vehicles. C1
- Aston Martin's performance in Formula 1 could negatively affect the overall brand reputation, subsequently affecting demand. A1
- Aston Martin may be impacted by macroeconomic conditions resulting from the global COVID-19 pandemic. B1
- Aston Martin may experience delays in launching and ramping the production of its products and features, or Aston Martin may be unable to control its manufacturing costs. B1
- Aston Martin may be unable to grow its global product sales, delivery and installation capabilities and its servicing and vehicle charging networks, or Aston Martin may be unable to accurately project and effectively manage its growth. B2
- Aston Martin's suppliers may fail to deliver components according to schedules, prices, quality and volumes that are acceptable, or Aston Martin may be unable to manage these components effectively. C1
- With growing focus on electric powertrains, Aston Martin may face difficulties in adapting its demand base to the new landscape, given the traditional 'personality' of its motor vehicles. B2
- If Aston Martin is not able to maintain a unique identity with its products, it will find it a lot more difficult to differentiate itself from its competitors, and the demand base could deteriorate. C2
- Aston Martin may face increased costs due to supply chain issues or adverse macroeconomic conditions. Hiked interest rates to combat inflation result in increased debt. C3
- An inability to shift a sufficient share of its sales to electric vehicles by 2035 would mean that maintaining the sales volume in the EU will no longer be possible, under the EU's 2035 ban on combustion engine vehicle sales[15]. C2
- Aston Martin is supplied powertrains and electric/electronics architecture, for some of its products, by Mercedes-Benz AMG. Any disruption to Mercedes' production could pose a limiting-factor risk to AML's production efficiency strategy.[16] C1
- Aston Martin faces risks associated with maintaining and expanding its international operations, including unfavourable and uncertain regulatory, political, economic, tax and labour conditions. B1
- Aston Martin's business may suffer if its products or features contain defects, fail to perform as expected or take longer than expected to become fully functional. B2
- Aston Martin may be required to defend or insure against product liability claims. A1
- Aston Martin will need to maintain public credibility and confidence in its long-term business prospects in order to succeed. A1
- If Aston Martin is unable to attract, hire and retain key employees and qualified personnel, its ability to compete may be harmed. B2
- Aston Martin's information technology systems or data, or those of its service providers or customers or users could be subject to cyber-attacks or other security incidents, which could result in data breaches, intellectual property theft, claims, litigation, regulatory investigations, significant liability, reputational damage and other adverse consequences. C1
- Additional funds may not be available to Aston Martin when it needs or want them. B1
- Aston Martin may be negatively impacted by any early obsolescence of its manufacturing equipment. B1
- Aston Martin holds and may acquire digital assets that may be subject to volatile market prices, impairment and unique risks of loss. A1
- There is no guarantee that Aston Martin will have sufficient cash flow from its business to pay its indebtedness or that it will not incur additional indebtedness. C3
- Aston Martin is exposed to fluctuations in currency exchange rates. B2
- Increased scrutiny and changing expectations from stakeholders with respect to the company's ESG practices may result in additional costs or risks. B2
- Aston Martin's operations could be adversely affected by events outside of its control, such as natural disasters, wars or health epidemics. C1
- Demand for Aston Martin's products and services may be impacted by the status of government and economic incentives supporting the development and adoption of such products. B1
- Aston Martin could be subject to liability, penalties and other restrictive sanctions and adverse consequences arising out of certain governmental investigations and proceedings. C1
- Aston Martin may face regulatory challenges to or limitations on its ability to sell vehicles directly. C1
- Aston Martin's financial results may vary significantly from period to period due to fluctuations in its operating costs and other factors. C3
- Aston Martin may fail to meet its publicly announced guidance or other expectations about its business, which could cause its stock price to decline. B2
Valuation
By market capitalisation, D-Wave, with $297 million(Yahoo Finance), occupies 32% of the quantum computing market capitalisation, $928.8 million.
What's the expected return of an investment in the company?
The Stockhub users estimate that the expected return of an investment in Aston Martin Lagonda Global Holdings plc over the next five years is negative 15%. This value was arrived at through the use an intrinsic valuation in the form of a discounted cash flow model and a relative valuation by conducting comparable company analysis.
Assuming that a suitable return level of five years is 10% per year (based of the S&P 500 returns) and Aston Martin Lagonda achieves its return level of negative 15%, then the company can be considered 'overvalued'.
What are the assumptions used to estimate the return?
Key Inputs
| Description | Value | Commentary |
|---|---|---|
| Valuation Model | Discounted Cash Flow and Comparable Company Analysis | Two main approaches can be used to estimate the value of an investment:
Research has suggested that to estimate the expected return of an investment over a long-term investment horizon, a discounted cash flow model provides an accurate projection. For completeness a comparable company analysis has been conducted, however the accuracy of the analysis is limited due to the fact that very public companies operate in the same market segment as Aston Martin with the majority of luxury car brands falling under larger parent companies. |
| Financial Projections | Stockhub, CapitalIQ [17], Yahoo Finance[18] | To improve the reliability of financial projections, a mixture of sources was used when projecting key financial metrics such as revenue. However, most analyst projections only predicted the first two years and therefore further projections were made using the Stockhub user's understanding of the company and long-term predictions. |
| Discount Rate | WACC | [19]The weighted average cost of capital was used as the discount rate as it expresses the return that both bondholders and shareholders demand to provide the company with capital. The cost of equity and cost of debt have been calculated in the tables provied below using values taken from the company's financial statements, beta for the stock, and expected market returns. |
Discounted Cash Flow Model
| N.B. the revenue is forecasted driver-based, weighted historical average, therefore it is compariably conservative | |||||||||
| £ million | Historical | Projected | |||||||
|---|---|---|---|---|---|---|---|---|---|
| 2020 | 2021 | 2022 | 2023 | 2024 | 2025 | 2026 | 2027 | Notes | |
| Income Statement | |||||||||
| Revenue | 611.8 | 1095.3 | 1381.5 | 1630.2 | 1858.4 | 2081.4 | 2289.5 | 2404.0 | |
| % growth | -39% | 79% | 26% | 18% | 14% | 12% | 10% | 5% | |
| Cost Of Goods Sold | 500.7 | 751.6 | 930.8 | 1075.9 | 1198.7 | 1332.1 | 1442.4 | 1490.5 | |
| % of revenue | 82% | 69% | 67% | 66% | 65% | 64% | 63% | 62% | |
| Gross Profit | 111.1 | 343.7 | 450.7 | 554.3 | 659.7 | 749.3 | 847.1 | 913.5 | |
| % of revenue | 18% | 31% | 33% | 34% | 36% | 36% | 37% | 38% | |
| Selling General & Admin Exp. | 336.7 | 419.3 | 570.0 | 668.4 | 594.7 | 562.0 | 618.2 | 649.1 | |
| % of revenue | 55% | 38% | 41% | 41% | 32% | 27% | 27% | 27% | |
| Total Operating Expenses | 336.7 | 419.3 | 570.0 | 668.4 | 594.7 | 562.0 | 618.2 | 649.1 | |
| % of revenue | 55% | 38% | 41% | 41% | 32% | 27% | 27% | 27% | |
| EBIT | -225.6 | -75.6 | -119.3 | -114.1 | 65.0 | 187.3 | 229.0 | 264.4 | |
| EBITDA | -68.8 | 133.7 | 188.8 | 239.9 | 394.0 | 480.3 | 549.5 | 601.0 | |
| Tax Expense | (55.50) | (24.50) | 32.70 | 8.0 | 4.6 | 35.6 | 43.5 | 50.2 | |
| Effective tax rate | 12% | 11% | -7% | 7% | 7% | 19% | 19% | 19% | |
| EBIAT | -122.1 | 60.5 | 151.7 | 185.5 | 214.2 | Earnings before interest and after tax | |||
| Cashflow | |||||||||
| D&A | 156.8 | 209.3 | 308.1 | 354.0 | 329.0 | 293.0 | 320.5 | 336.6 | |
| % of revenue | 26% | 19% | 22% | 22% | 18% | 14% | 14% | 14% | |
| Capital Expenditure | -81 | -40.7 | -58.6 | -244.5 | -278.8 | -208.1 | -229.0 | -192.3 | |
| % of revenue | 13% | 4% | 4% | 15% | 15% | 10% | 10% | 8% | |
| Change in NWC | 16.3 | -46.8 | -34.9 | 48.9 | 55.8 | 62.4 | 68.7 | 72.1 | Simple average was taken spanning 8 years into the past. |
| % of revenue | 3% | -4% | -3% | 3% | 3% | 3% | 3% | 3% | |
| Unlevered FCF | -61.53 | 54.98 | 174.15 | 208.35 | 286.32 | ||||
| WACC | Notes | |
|---|---|---|
| Weights | ||
| Total Debt | 1200.5 | |
| Market Cap | 2430 | |
| Total | 3630.5 | |
| Wd | 0.33 | Weight of debt calculated as the total debt as a proportion of total capital. |
| We | 0.67 | Weight of equity calculated as the market cap as a proportion of total capital |
| Debt | ||
| Total Debt | 1200.5 | Cost of debt was calculated by taking interest expenses from the income statement and dividing this by the total debt making note of the fact that debt is a tax deductable item. |
| Interest Expense | -201.9 | |
| Rate | 17% | |
| Effective Tax Rate | 7% | |
| Rd(1-t) | 15.6% | |
| Equity | ||
| Risk Free Rate | 4.5% | Capital asset pricing model was used to calculate the cost of equity. Risk free rate of the UK Gilt Yield was used. |
| Beta | 2.05 | Beta for the stock was found from Yahoo Finance[20] |
| Market Risk Premium | 4.2% | https://valueinvesting.io/AMZN/valuation/wacc |
| Re | 15.8% | |
| Discount Rate | 15.73% | |
| Perpetuity Growth Rate | 2.0% | A perpetuity growth rate of 2% was used as this is sufficiently low to ensure that the company is not projected to increase in size far faster than the global economy in the very long term. |
| DCF | 2023 | 2024 | 2025 | 2026 | 2027 | Terminal Value (Perpetuity Growth) | Notes | |
|---|---|---|---|---|---|---|---|---|
| £ million | ||||||||
| FCF | - 61.5 | 55.0 | 174.2 | 208.3 | 286.3 | 2,127.0 | The terminal value of the company was calculated using the Gordon Growth Model[21]. | |
| PV of FCF | 354.29 | |||||||
| Terminal Value | 2,126.96 | |||||||
| NPV of TV | 1024.52 | |||||||
| Enterprise Value | 1378.81 | |||||||
| Net Debt | 520.4 | |||||||
| Equity Value | 1899.2 | |||||||
| Shares Out | 698 | |||||||
| Equity Value per Share | 2.72 | |||||||
| Current share price | 3.21 | |||||||
| Difference | -15% |
Sensitivity Analysis
A sensitivity analysis was also conducted to reflect how changes in the required rate of return and perpetuity growth rate would affect the intrinsic value of the company.
| Perpetuity Growth | ||||||
|---|---|---|---|---|---|---|
| WACC | $2.72 | 1.0% | 1.5% | 2.0% | 2.5% | 3.0% |
| 14.5% | £2.84 | £2.90 | £2.98 | £3.06 | £3.14 | |
| 15.0% | £2.74 | £2.80 | £2.87 | £2.94 | £3.02 | |
| 15.5% | £2.65 | £2.70 | £2.77 | £2.83 | £2.90 | |
| 15.7% | £2.61 | £2.67 | £2.73 | £2.79 | £2.86 | |
| 16.0% | £2.56 | £2.62 | £2.67 | £2.73 | £2.80 | |
| 16.5% | £2.48 | £2.53 | £2.58 | £2.64 | £2.70 | |
| 17.0% | £2.41 | £2.46 | £2.50 | £2.55 | £2.61 | |
Relative Valuation
A relative valuation has been undertaken by using key metrics such as EV/Revenue and EV/EBITDA and comparing these across companies operating in the automotive industry. There are certain limitations to such a model; one key limitation of the model is how sensitive the final valuation is to the EV multiple. Due to the value of this multiple varying greatly between the car companies below, it is hard to land on an exact value which can be considered reliable. Similarly most car companies operating in the same segment as Aston Martin such as Porsche, Lamborghini , has been purchased by a larger parent company such as Volkswagen. Despite Aston Martin operating exclusively in the luxury car market, most other car manufactures operate across a much wider market and thus have vastly different factors driving their multiples. The most similar car company to Aston Martin would be Ferrari however due to the considerably prestige and history associated with the Ferrari brand, the company is able to operate in a manner which leads to considerably higher EV/Revenue and EV/EBITDA multiples. It must also be noted that outliers were excluded from averages such as Tesla with a EV/EBITDA of 50.72x.
| Market Data | Financials | Valuation | ||||||||||
|---|---|---|---|---|---|---|---|---|---|---|---|---|
| Company | Ticker | Share Price | Shares Out | Equity Value | Net Debt | Enterprise Value | Revenue | EBITDA | EV/ Revenue | EV/EBITDA | ||
| Aston Martin Lagonda Global Holdings plc | LSE:AML | 3 | 699 | 2243 | 520 | 2763 | 1834 | 189 | 1.51x | 14.64x | ||
| Ferrari N.V. | NYSE:RACE | 314 | 181 | 56843 | 1340 | 58183 | 5799 | 1718 | 10.03x | 33.87x | ||
| Bayerische Motoren Werke Aktiengesellschaft | XTRA:BMW | 117 | 641 | 75215 | 81934 | 157148 | 161113 | 23949 | 0.98x | 6.56x | ||
| Mercedes-Benz Group AG | XTRA:MBG | 78 | 1070 | 82995 | 94353 | 177348 | 165843 | 23901 | 1.07x | 7.42x | ||
| Volkswagen AG | XTRA:VOW3 | 132 | 501 | 66086 | 171675 | 237761 | 317966 | 31371 | 0.75x | 7.58x | ||
| Renault SA | ENXTPA:RNO | 41 | 271 | 11058 | 45602 | 56660 | 50392 | 5099 | 1.12x | 11.11x | ||
| Stellantis N.V. | BIT:STLAM | 17 | 3169 | 54670 | -23902 | 30769 | 195082 | 27584 | 0.16x | 1.12x | ||
| KABE Group AB | OM:KABE B | 21 | 9 | 193 | -29 | 164 | 351 | 29 | 0.47x | 5.59x | ||
| China Motor Corporation | TWSE:2204 | 3 | 554 | 1733 | -149 | 1584 | 1001 | 87 | 1.58x | 18.12x | ||
| Honda Motor Co., Ltd. | TSE:7267 | 30 | 1649 | 49083 | 27144 | 76228 | 117252 | 14742 | 0.65x | 5.17x | ||
| Tesla, Inc. | NasdaqGS:TSLA | 272 | 3170 | 862072 | -16828 | 845244 | 86035 | 16666 | 9.82x | 50.72x | ||
| Aston Martin Lagonda Global Holdings plc Valuation | EV/ Revenue | EV/EBITDA |
|---|---|---|
| Ratio | 1.47x | 10.73x |
| Implied Enterprise Value | 2690.8 | 2025.1 |
| Net Debt | 520 | 520 |
| Implied Market Value | 2170 | 1505 |
| Shares Outstanding | 698.8 | 698.8 |
| Implied Value Per Share | £3.11 | £2.15 |
| Average | £2.63 | |
| Current share price | 3.21 | |
| Difference | -18% |
- ↑
- ↑ D-Wave Systems, PDF, 01-2017, http://www.dwavesys.com/sites/default/files/D-Wave%202000Q%20Tech%20Collateral_0117F.pdf
- ↑ Cite error: Invalid
<ref>tag; no text was provided for refs named:0 - ↑
- ↑
- ↑
- ↑
- ↑
- ↑
- ↑
- ↑
- ↑ https://uk.finance.yahoo.com/quote/RACE/profile?p=RACE
- ↑ https://uk.finance.yahoo.com/quote/RR.L/profile?p=RR.L
- ↑ https://uk.finance.yahoo.com/quote/VOW3.DE/profile?p=VOW3.DE
- ↑ https://www.europarl.europa.eu/news/en/headlines/economy/20221019STO44572/eu-ban-on-sale-of-new-petrol-and-diesel-cars-from-2035-explained
- ↑ https://www.autoblog.com/2021/08/20/aston-martin-amg-v8-supply/?guccounter=1&guce_referrer=aHR0cHM6Ly93d3cuZ29vZ2xlLmNvbS8&guce_referrer_sig=AQAAADGFzwuKNfSFeGptOhLFwfmGX0E5TjeZrUCLE59IsSl8GUcY8tOUWFojX2nIR5bp3GqV2pt_Vct-VVKE_sJuqrnhUZJZm4L-TkszaeyuHP0gUmwYtEk-E5U29p5bHYHp1alii4wZPVO_JRec9jxjGbgw1LAKuCtkkf71ZUfTF-nX
- ↑ https://www.capitaliq.com/CIQDotNet/Financial/IncomeStatement.aspx?CompanyId=111528564&statekey=69d310453ee44151ae14e948d1930696
- ↑ https://uk.finance.yahoo.com/
- ↑ https://www.investopedia.com/terms/w/wacc.asp
- ↑ https://uk.finance.yahoo.com/
- ↑ https://einvestingforbeginners.com/terminal-value-gordon-growth-model-daah/
