Royal Bank of Canada: Difference between revisions
No edit summary |
No edit summary |
||
| Line 116: | Line 116: | ||
* Canadian Insurance revenue decreased 78% from FY21, primarily due to the change in the fair value of investments backing policyholder liabilities and lower group annuity sales. Premiums and deposits decreased by 5% | * Canadian Insurance revenue decreased 78% from FY21, primarily due to the change in the fair value of investments backing policyholder liabilities and lower group annuity sales. Premiums and deposits decreased by 5% | ||
* International Insurance, which is primarily focused on the reinsurance business had its revenue increase by CAD 174 MM from FY21 | * International Insurance, which is primarily focused on the reinsurance business had its revenue increase by CAD 174 MM from FY21 | ||
== Ownership Structure == | |||
{| class="wikitable" | |||
|Name | |||
|Equities | |||
|Percentage | |||
|Valuation | |||
|- | |||
|The Vanguard Group, Inc. | |||
|44,849,838 | |||
|3.24% | |||
|4,284 M $ | |||
|- | |||
|RBC Global Asset Management, Inc. | |||
|36,433,061 | |||
|2.63% | |||
|3,480 M $ | |||
|- | |||
|RBC Dominion Securities, Inc. | |||
|32,743,241 | |||
|2.36% | |||
|3,127 M $ | |||
|- | |||
|CIBC World Markets, Inc. | |||
|22,562,411 | |||
|1.63% | |||
|2,155 M $ | |||
|- | |||
|Norges Bank Investment Management | |||
|16,830,957 | |||
|1.22% | |||
|1,608 M $ | |||
|- | |||
|Mackenzie Financial Corp. | |||
|16,648,177 | |||
|1.20% | |||
|1,590 M $ | |||
|- | |||
|1832 Asset Management LP | |||
|15,766,416 | |||
|1.14% | |||
|1,506 M $ | |||
|- | |||
|Fidelity Management & Research Co. LLC | |||
|14,076,997 | |||
|1.02% | |||
|1,344 M $ | |||
|- | |||
|BMO Asset Management, Inc. | |||
|11,357,393 | |||
|0.82% | |||
|1,085 M $ | |||
|- | |||
|Wellington Management Co. LLP | |||
|10,922,870 | |||
|0.79% | |||
|1,043 M $ | |||
|} | |||
Revision as of 21:39, 27 July 2023
About
Royal Bank of Canada is a Canada-based diversified financial services company. The Company provides personal and commercial banking, wealth management services, insurance, investor services and capital markets products and services globally. Its segments include Personal & Commercial Banking, Wealth Management, Insurance, Investor and Treasury Services, Capital Markets, and Corporate Support. Personal & Commercial Banking segment provides a range of financial products and services to individuals and businesses for their day-to-day banking, investing, and financing needs through two businesses: Canadian Banking, and Caribbean and United States Banking. Wealth Management offers comprehensive investment, trust, banking, credit, and other advice-based solutions. Its insurance segment offers a range of advice and solutions for individual and business clients including life, health, wealth, home, auto, travel, annuities, and reinsurance.
The bank reported interest income of CAD 40,771 million for the fiscal year ended October 2022 (FY2022), an increase of 44.9% over FY2021. In FY2022, the bank’s operating margin was 41.1%, compared to an operating margin of 41.5% in FY2021. In FY2022, the bank recorded a net margin of 23.6%, compared to a net margin of 27.7% in FY2021.
Key Achievements
- #1 market share in all key product categories in Canadian Banking
- 9th largest global investment bank
- Largest retail mutual fund in Canada
- #1 in market share for high net worth/ultra-high net worth in Canada
- Largest Canadian-bank owned insurance organization
- 6th largest wealth advisory firm in the US
Products and Services
RBC is a provider of banking products and related services. Its key products and services include:
- Accounts and Deposits:
- Savings and Checking Accounts
- Business Trust Accounts
- Tax-free savings account
- Cards:
- Commercial Cards
- Credit Cards
- Loans and Financing:
- Fixed and Variable Rate Mortgages
- Line of Credit and Operating loans
- Car loans
- Personal loans
- Investment Products:
- Mutual Funds and ETFs
- Equity and Fixed Income Products
- Alternative Investments
- Guaranteed Investment Certificates
- Retirement funds
- Insurance:
- Life and Non-life insurance
- Services:
- Portfolio and Investment Solutions
- Online banking and trade services
Segments
Personal and Commercial Banking
RBC’s Personal and Commercial Banking vertical provides a broad suite of financial products and services to individuals and businesses. Its operations are conducted through two businesses – Canadian banking and Caribbean and US banking.
KPIs:
- Over 14 million clients in Canadian Banking
- #1 or #2 ranking in market share for all key retail and business products
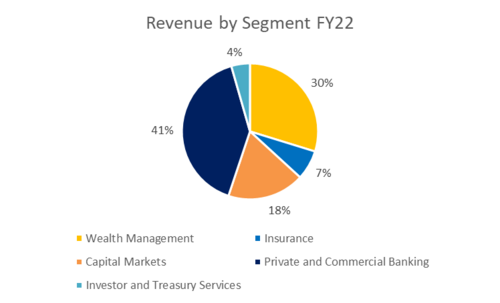
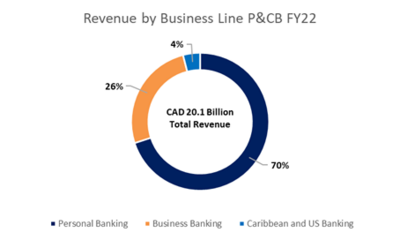
Revenue share FY22
The P&CB segment brought in CAD 20.1 billion in FY22 which is a 10% increase in revenue when compared to FY21 which was at CAD 18.3 billion.
- The Personal Banking segment’s revenue rose by 5%, which is primarily due to higher interest rates. Average residential mortgages increased by 11% from FY21 primarily due to rising interest rates, changes in product mix and lower prepayment revenue. Average deposits increased by 9% from FY21 mainly due to the acquisition of new clients and an increase in activity from existing clients.
- Business banking’s revenue increased by 26%, majorly due to higher interest rates, credit fees and service charges. Average loan acceptance increased by 11% and average deposits increased by 11%.
- Caribbean and US Banking revenue increased by 11%, resulting from average volume growth of 11%, higher card service revenue and higher spreads. Average loans and acceptances increased by 12% and average deposits increased by 11% primarily due to increased client activity and the impact of foreign exchange translation.
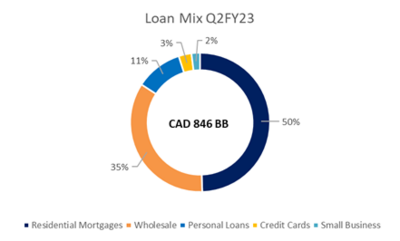
Loan Mix for Q2FY23
- The loans stand at CAD 846 BN with 50% of it accounting for residential mortgages
- Canadian Banking weighted average FICO Score stands at 789 with over 81% of customers with a score of more than 720
- 30–89-day delinquency rates were stable QoQ across all portfolios
- In the residential mortgage portfolio, fixed-rate mortgages accounted for 68% of the mortgages. The Average Duration for Remaining Mortgage Amortization stands at 26 years
Risk review as of Q2FY23
- Allowance for Credit Losses increased by CAD 328 MM
- Provisions for Credit Losses for the commercial business were at CAD 57 MM up CAD 33 MM QoQ, primarily driven by provisions in the consumer discretionary and consumer staples sectors. Retail PCL was at CAD 245 MM up CAD 10 MM QoQ, due to higher provisions in the Credit Card portfolio
- Gross Impaired Loans stand at CAD 1.3 BB, with increases in both retail and commercial portfolios. Write-offs increased by CAD 28 MM QoQ, driven by higher write-offs on Credit Cards and Personal Loans
Wealth Management
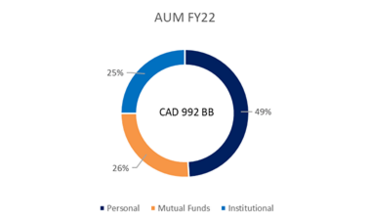
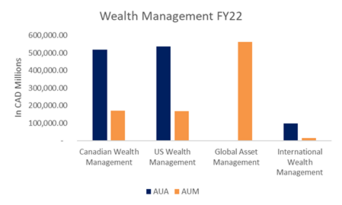
RBC’s Wealth Management business is a global business serving HNW and UHNW clients across key financial centres. Lines of businesses include Canadian Wealth Management, US Wealth Management, Global Asset Management, and International Wealth Management.
KPIs:
- 6,100 client-facing advisors
- >CAD 55 billion AUA net flows
- CAD 1.33 BB assets under administration
- CAD 992 BB assets under management
Revenue Share FY22
- Canadian Wealth Management increased by 10% YoY primarily driven by higher average fee-based client assets, largely driven by net sales and higher interest income from higher interest rates. FY22 total revenue stands at CAD 4.38 BB.
- US Wealth Management business increased by 18% from FY21 and revenue increased by 14%, primarily due to higher net interest income driven by average volume growth of 14% in loans and 9% in deposits as well as higher interest rates, which also drove higher revenue from sweep deposits.
- The revenue for Global Asset Management decreased by 2%, largely due to changes in the fair value of seed capital investments, the impact of foreign exchange translation as well as lower performance fees.
- International Wealth Management revenue is up significantly increasing by CAD 84 MM or 25% from FY21, primarily due to higher interest rates and higher spreads.
Capital Markets
RBC Capital Markets is a global investment bank providing expertise in advisory & origination, sales & trading, and lending & financing to corporations, institutional clients, asset managers, private equity firms and governments globally.
KPIs:
- 9th largest global investment bank
- Over 19,500 clients
Revenue Share FY22
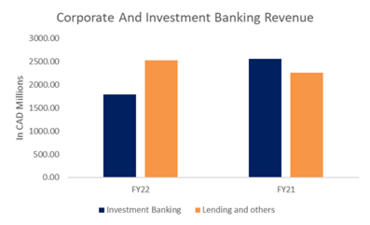
- Corporate and Investment Banking revenues were down 11% from FY21. Investment Banking revenues decreased CAD 773 MM, mainly due to the impact of decreased loan origination and M&A activity primarily in the US. Lending and other revenues increased by 11%, primarily due to average volume growth in the US and Europe.
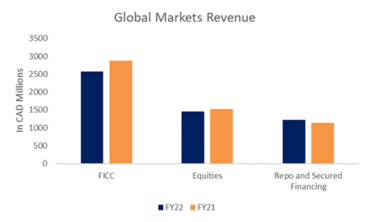
- Revenue in Fixed income, currencies and commodities business decreased CAD 308 MM or 11%, largely driven by lower fixed-income trading revenue and lower debt origination both primarily in the U.S. These factors were partially offset by higher foreign exchange trading revenue across all regions. Equities business revenue decreased by CAD 73 MM or 5%, primarily due to lower equity origination across most regions. Revenue in Repo and secured financing business increased by CAD 84 MM or 7%, mainly due to increased client activity.
Risk review as of Q2FY23
- Lower M&A and loan syndication activity across most regions
- Lower equity trading revenue and lower fixed-income trading across most regions
- Higher expenses resulting from foreign exchange translations
Insurance
RBC Insurance is the largest bank-owned insurance in Canada and offers advice and solutions for life, health, wealth, home, auto, travel, annuities, and reinsurance.
KPIs:
- Largest Canadian-bank owned insurance organization
- >4.9 million clients
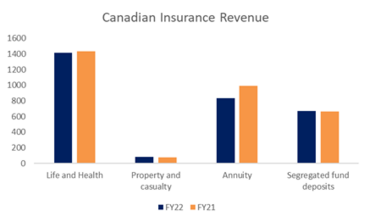
Revenue Share FY22
- Canadian Insurance revenue decreased 78% from FY21, primarily due to the change in the fair value of investments backing policyholder liabilities and lower group annuity sales. Premiums and deposits decreased by 5%
- International Insurance, which is primarily focused on the reinsurance business had its revenue increase by CAD 174 MM from FY21
Ownership Structure
| Name | Equities | Percentage | Valuation |
| The Vanguard Group, Inc. | 44,849,838 | 3.24% | 4,284 M $ |
| RBC Global Asset Management, Inc. | 36,433,061 | 2.63% | 3,480 M $ |
| RBC Dominion Securities, Inc. | 32,743,241 | 2.36% | 3,127 M $ |
| CIBC World Markets, Inc. | 22,562,411 | 1.63% | 2,155 M $ |
| Norges Bank Investment Management | 16,830,957 | 1.22% | 1,608 M $ |
| Mackenzie Financial Corp. | 16,648,177 | 1.20% | 1,590 M $ |
| 1832 Asset Management LP | 15,766,416 | 1.14% | 1,506 M $ |
| Fidelity Management & Research Co. LLC | 14,076,997 | 1.02% | 1,344 M $ |
| BMO Asset Management, Inc. | 11,357,393 | 0.82% | 1,085 M $ |
| Wellington Management Co. LLP | 10,922,870 | 0.79% | 1,043 M $ |
