Royal Bank of Canada: Difference between revisions
No edit summary |
No edit summary |
||
| Line 1,361: | Line 1,361: | ||
|17.28 | |17.28 | ||
|17.72 | |17.72 | ||
|} | |||
{| class="wikitable" | |||
! colspan="7" |Tax Rate | |||
|- | |||
| colspan="2" | | |||
|FY18 | |||
|FY19 | |||
|FY20 | |||
|FY21 | |||
|FY22 | |||
|- | |||
|Historical Tax Rate | |||
|Effective Tax Rate from B/S | |||
|21.10% | |||
|19.10% | |||
|20.50% | |||
|22.20% | |||
|21.40% | |||
|- | |||
|Selected Tax Rate | |||
| colspan="5" | | |||
|'''20.86%''' | |||
|} | |||
{| class="wikitable" | |||
! colspan="7" |Cost of Debt (Effective Interest Rate Method) | |||
|- | |||
| | |||
| | |||
|FY18 | |||
|FY19 | |||
|FY20 | |||
|FY21 | |||
|FY22 | |||
|- | |||
|Interest Expense | |||
|From I/S | |||
|15,069 | |||
|21,584 | |||
|14,048 | |||
|8,143 | |||
|18,054 | |||
|- | |||
|Total Debt | |||
|From B/S | |||
|248,466 | |||
|262,192 | |||
|333,977 | |||
|318,861 | |||
|342,703 | |||
|- | |||
|Effective Interest Rate | |||
| | |||
|6.06% | |||
|8.23% | |||
|4.21% | |||
|2.55% | |||
|5.27% | |||
|- | |||
|Average Effective Interest Rate | |||
| colspan="5" | | |||
|'''5.27%''' | |||
|} | |} | ||
[[File:RBC.png|thumb|463x463px]] | [[File:RBC.png|thumb|463x463px]] | ||
| Line 1,411: | Line 1,472: | ||
|'''7.97%''' | |'''7.97%''' | ||
|} | |} | ||
RBC has a credit rating of Aa- which is investment grade. It has maintained an interest coverage ratio of 0.97 - 2.39 from FY18-FY22 indicating that it has more interest expenses that EBIT. The debt/equity ratio ranged from 3.11 - 3.85 from FY18-FY22 indicating that RBC is a highly levered firm. | RBC has a credit rating of Aa- which is investment grade. It has maintained an interest coverage ratio of 0.97 - 2.39 from FY18-FY22 indicating that it has more interest expenses that EBIT. The debt/equity ratio ranged from 3.11 - 3.85 from FY18-FY22 indicating that RBC is a highly levered firm. The Weighted Average Cost of Capital is 7.97%. | ||
== Valuations == | |||
=== Dividend Discount Model === | |||
{| class="wikitable" | |||
|Current Price | |||
|130.16 | |||
|- | |||
|Dividend yield | |||
|3.94% | |||
|- | |||
|Dividend payout ratio | |||
|44.07% | |||
|- | |||
|Retention rate | |||
|55.93% | |||
|- | |||
|ROE | |||
|14.60% | |||
|- | |||
|Growth Rate | |||
|8.17% | |||
|- | |||
|Current Dividend | |||
|4.96 | |||
|- | |||
|Risk Free Rate | |||
|3.53% | |||
|- | |||
|Market Risk Premium | |||
|14.86% | |||
|- | |||
|Beta | |||
|0.78 | |||
|- | |||
|Cost of Equity | |||
|15.10% | |||
|- | |||
|1 year forward dividend | |||
|5.37 | |||
|- | |||
|'''DDM fair value''' | |||
|'''77.36''' | |||
|} | |||
{| class="wikitable" | |||
! colspan="15" |Sensitivity Analysis | |||
|- | |||
! | |||
! | |||
! colspan="13" |Growth Rate | |||
|- | |||
! | |||
|77.36 | |||
|5.0% | |||
|5.5% | |||
|6.0% | |||
|6.5% | |||
|7.0% | |||
|7.5% | |||
|8.0% | |||
|8.5% | |||
|9.0% | |||
|9.5% | |||
|10.0% | |||
|10.5% | |||
|11.0% | |||
|- | |||
! rowspan="11" |Required Rate of Return | |||
|11% | |||
|86.80 | |||
|95.14 | |||
|105.15 | |||
|117.39 | |||
|132.68 | |||
|152.34 | |||
|178.56 | |||
|215.26 | |||
|270.32 | |||
|362.08 | |||
|545.60 | |||
|1096.16 | |||
| -1.3224E+17 | |||
|- | |||
|12% | |||
|74.40 | |||
|80.50 | |||
|87.63 | |||
|96.04 | |||
|106.14 | |||
|118.49 | |||
|133.92 | |||
|153.76 | |||
|180.21 | |||
|217.25 | |||
|272.80 | |||
|365.39 | |||
|550.56 | |||
|- | |||
|13% | |||
|65.10 | |||
|69.77 | |||
|75.11 | |||
|81.27 | |||
|88.45 | |||
|96.95 | |||
|107.14 | |||
|119.59 | |||
|135.16 | |||
|155.18 | |||
|181.87 | |||
|219.23 | |||
|275.28 | |||
|- | |||
|14% | |||
|57.87 | |||
|61.56 | |||
|65.72 | |||
|70.43 | |||
|75.82 | |||
|82.03 | |||
|89.28 | |||
|97.85 | |||
|108.13 | |||
|120.69 | |||
|136.40 | |||
|156.59 | |||
|183.52 | |||
|- | |||
|15% | |||
|52.08 | |||
|55.08 | |||
|58.42 | |||
|62.15 | |||
|66.34 | |||
|71.09 | |||
|76.53 | |||
|82.79 | |||
|90.11 | |||
|98.75 | |||
|109.12 | |||
|121.80 | |||
|137.64 | |||
|- | |||
|16% | |||
|47.35 | |||
|49.84 | |||
|52.58 | |||
|55.60 | |||
|58.97 | |||
|62.73 | |||
|66.96 | |||
|71.75 | |||
|77.23 | |||
|83.56 | |||
|90.93 | |||
|99.65 | |||
|110.112 | |||
|- | |||
|17% | |||
|43.40 | |||
|45.50 | |||
|47.80 | |||
|50.31 | |||
|53.07 | |||
|56.13 | |||
|59.52 | |||
|63.31 | |||
|67.58 | |||
|72.42 | |||
|77.94 | |||
|84.32 | |||
|91.76 | |||
|- | |||
|18% | |||
|40.06 | |||
|41.86 | |||
|43.81 | |||
|45.93 | |||
|48.25 | |||
|50.78 | |||
|53.57 | |||
|56.65 | |||
|60.07 | |||
|63.90 | |||
|68.20 | |||
|73.08 | |||
|78.65142857 | |||
|- | |||
|19% | |||
|37.20 | |||
|38.76 | |||
|40.44 | |||
|42.26 | |||
|44.23 | |||
|46.37 | |||
|48.70 | |||
|51.25 | |||
|54.06 | |||
|57.17 | |||
|60.62 | |||
|64.48 | |||
|68.82 | |||
|- | |||
|20% | |||
|34.72 | |||
|36.09 | |||
|37.55 | |||
|39.13 | |||
|40.82 | |||
|42.66 | |||
|44.64 | |||
|46.80 | |||
|49.15 | |||
|51.73 | |||
|54.56 | |||
|57.69 | |||
|61.17333333 | |||
|- | |||
|21% | |||
|32.55 | |||
|33.76 | |||
|35.05 | |||
|36.43 | |||
|37.91 | |||
|39.50 | |||
|41.21 | |||
|43.05 | |||
|45.05 | |||
|47.23 | |||
|49.60 | |||
|52.20 | |||
|55.056 | |||
|} | |||
{| class="wikitable" | |||
! colspan="2" |Implied Growth Rate | |||
|- | |||
|Current Price | |||
|130.16 | |||
|- | |||
|Estimated Next Year Dividend | |||
|5.37 | |||
|- | |||
|Cost of Equity | |||
|15.10% | |||
|- | |||
|'''Implied Growth Rate''' | |||
|'''10.98%''' | |||
|} | |||
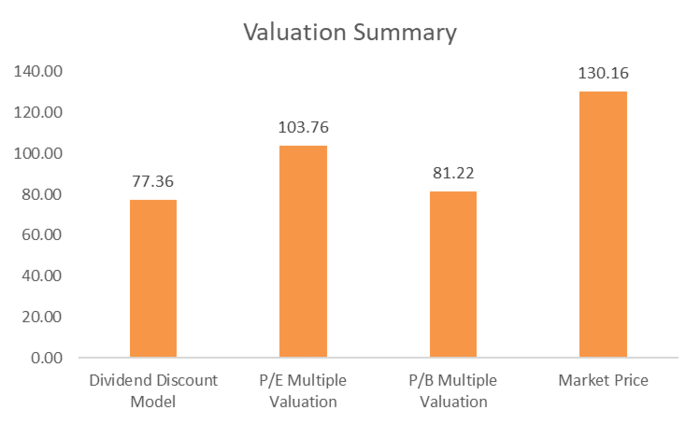
For the dividend discount model, the growth rate was calculated using the ROE and Retention rate. Cost of equity was calculated using the CAPM. The fair value for RBC's stock price comes up to CAD 77.36 which is at a 40% discount to the current market price of 130.16. | |||
=== Multiples Approach === | |||
{| class="wikitable" | |||
!Competitors | |||
!P/Ex | |||
!P/Bx | |||
|- | |||
|Bank of America Corp | |||
|9.10 | |||
|0.9 | |||
|- | |||
|BMO Bank of Montreal | |||
|9.34 | |||
|1.29 | |||
|- | |||
|Citi Group | |||
|7.14 | |||
|0.49 | |||
|- | |||
|HSBC Holdings | |||
|6.94 | |||
|0.9 | |||
|- | |||
|JPMorgan Chase & Co. | |||
|10.41 | |||
|1.5 | |||
|- | |||
|Toronto-Dominion Bank | |||
|10.73 | |||
|1.41 | |||
|- | |||
|Wells Fargo & Co. | |||
|11.00 | |||
|0.9 | |||
|- | |||
|'''Average''' | |||
|'''9.24''' | |||
|'''1.06''' | |||
|- | |||
|'''Median''' | |||
|'''9.34''' | |||
|'''0.90''' | |||
|} | |||
{| class="wikitable" | |||
! colspan="5" |Calculating the price based on P/E multiple | |||
|- | |||
|P/E | |||
|Earnings | |||
|Shares | |||
|'''Price''' | |||
|Market cap | |||
|- | |||
|9.24x | |||
|15,794.00 | |||
|1,406.00 | |||
|'''103.76''' | |||
|145,891.43 | |||
|} | |||
{| class="wikitable" | |||
! colspan="5" |Calculating the price based on P/B multiple | |||
|- | |||
|P/B | |||
|Book Value | |||
|Shares | |||
|'''Price''' | |||
|Market cap | |||
|- | |||
|1.06x | |||
|108,175.00 | |||
|1,406.00 | |||
|'''81.22''' | |||
|114,201.89 | |||
|} | |||
For the multiples approach, the average P/E and P/B ratio was calculated using a basket of P/E and P/B ratios of competitors. Based on the P/E multiple, the price is CAD 103.76 which is at a 23% discount to the current market price. Based on the P/B multiple, the price is CAD 81.22 which is at a 37.5% discount to the current market price. | |||
[[File:Valuation.png|center|frameless|700x700px]] | |||
== Risks == | |||
=== Interest Rate Risks === | |||
* Arguably, the biggest factor affecting the banking sector is the high interest rate environments. Central banks of developed countries have gone through a process of aggressive rate hikes over the past year to combat persistent inflation. However, it is expected that the central banks are approaching the end of their current cycle of rate increases, for example, even though the Fed raised the interest rates to 5.5%in the recent meeting, it is expected that this is the last rate hike. | |||
* The lagged effects of aggressive rate hikes are beginning to show, with easing inflation but mild recessions expected in some of the large global economies. | |||
* We have already seen a rise in the provisions for Gross Impaired Loans, Allowances for Credit Losses and Write-Offs in Credit Cards and Personal Loans | |||
=== Canadian Housing and Household Indebtness === | |||
* Canadian housing and household indebtedness risks remain heightened in the current rising interest rate environment. Concerns related to elevated levels of mortgage-related Canadian household debt, which accelerated during the COVID-19 pandemic, could escalate if the BoC continues to increase interest rates, if the current period of elevated inflation is prolonged or if unemployment increases, potentially resulting in, among other things, higher credit losses. | |||
=== Credit Risk === | |||
* Credit risk includes retail credit risk, wholesale credit risk and wrong-way risk. Total credit risk exposure increased CAD179 billion or 10% from FY21, primarily due to the impact of foreign exchange translation, volume growth in loans, higher derivative exposure and an increase in securities. | |||
Revision as of 08:29, 28 July 2023
About
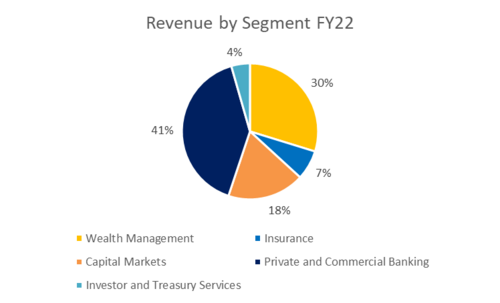
Royal Bank of Canada is a Canada-based diversified financial services company. The Company provides personal and commercial banking, wealth management services, insurance, investor services and capital markets products and services globally. Its segments include Personal & Commercial Banking, Wealth Management, Insurance, Investor and Treasury Services, Capital Markets, and Corporate Support. Personal & Commercial Banking segment provides a range of financial products and services to individuals and businesses for their day-to-day banking, investing, and financing needs through two businesses: Canadian Banking, and Caribbean and United States Banking. Wealth Management offers comprehensive investment, trust, banking, credit, and other advice-based solutions. Its insurance segment offers a range of advice and solutions for individual and business clients including life, health, wealth, home, auto, travel, annuities, and reinsurance.
The bank reported interest income of CAD 40,771 million for the fiscal year ended October 2022 (FY2022), an increase of 44.9% over FY2021. In FY2022, the bank’s operating margin was 41.1%, compared to an operating margin of 41.5% in FY2021. In FY2022, the bank recorded a net margin of 23.6%, compared to a net margin of 27.7% in FY2021.
Key Achievements
- #1 market share in all key product categories in Canadian Banking
- 9th largest global investment bank
- Largest retail mutual fund in Canada
- #1 in market share for high net worth/ultra-high net worth in Canada
- Largest Canadian-bank owned insurance organization
- 6th largest wealth advisory firm in the US
Products and Services
RBC is a provider of banking products and related services. Its key products and services include:
- Accounts and Deposits:
- Savings and Checking Accounts
- Business Trust Accounts
- Tax-free savings account
- Cards:
- Commercial Cards
- Credit Cards
- Loans and Financing:
- Fixed and Variable Rate Mortgages
- Line of Credit and Operating loans
- Car loans
- Personal loans
- Investment Products:
- Mutual Funds and ETFs
- Equity and Fixed Income Products
- Alternative Investments
- Guaranteed Investment Certificates
- Retirement funds
- Insurance:
- Life and Non-life insurance
- Services:
- Portfolio and Investment Solutions
- Online banking and trade services
Segments
Personal and Commercial Banking
RBC’s Personal and Commercial Banking vertical provides a broad suite of financial products and services to individuals and businesses. Its operations are conducted through two businesses – Canadian banking and Caribbean and US banking.
KPIs:
- Over 14 million clients in Canadian Banking
- #1 or #2 ranking in market share for all key retail and business products
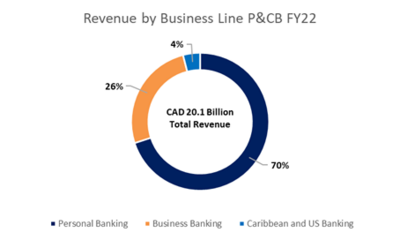
Revenue share FY22
The P&CB segment brought in CAD 20.1 billion in FY22 which is a 10% increase in revenue when compared to FY21 which was at CAD 18.3 billion.
- The Personal Banking segment’s revenue rose by 5%, which is primarily due to higher interest rates. Average residential mortgages increased by 11% from FY21 primarily due to rising interest rates, changes in product mix and lower prepayment revenue. Average deposits increased by 9% from FY21 mainly due to the acquisition of new clients and an increase in activity from existing clients.
- Business banking’s revenue increased by 26%, majorly due to higher interest rates, credit fees and service charges. Average loan acceptance increased by 11% and average deposits increased by 11%.
- Caribbean and US Banking revenue increased by 11%, resulting from average volume growth of 11%, higher card service revenue and higher spreads. Average loans and acceptances increased by 12% and average deposits increased by 11% primarily due to increased client activity and the impact of foreign exchange translation.
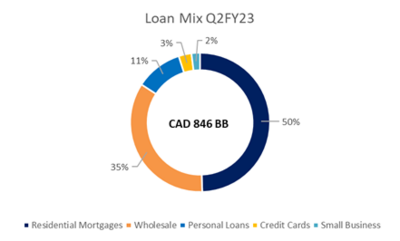
Loan Mix for Q2FY23
- The loans stand at CAD 846 BN with 50% of it accounting for residential mortgages
- Canadian Banking weighted average FICO Score stands at 789 with over 81% of customers with a score of more than 720
- 30–89-day delinquency rates were stable QoQ across all portfolios
- In the residential mortgage portfolio, fixed-rate mortgages accounted for 68% of the mortgages. The Average Duration for Remaining Mortgage Amortization stands at 26 years
Risk review as of Q2FY23
- Allowance for Credit Losses increased by CAD 328 MM
- Provisions for Credit Losses for the commercial business were at CAD 57 MM up CAD 33 MM QoQ, primarily driven by provisions in the consumer discretionary and consumer staples sectors. Retail PCL was at CAD 245 MM up CAD 10 MM QoQ, due to higher provisions in the Credit Card portfolio
- Gross Impaired Loans stand at CAD 1.3 BB, with increases in both retail and commercial portfolios. Write-offs increased by CAD 28 MM QoQ, driven by higher write-offs on Credit Cards and Personal Loans
Wealth Management
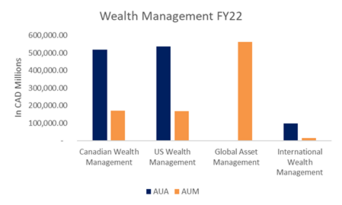
RBC’s Wealth Management business is a global business serving HNW and UHNW clients across key financial centres. Lines of businesses include Canadian Wealth Management, US Wealth Management, Global Asset Management, and International Wealth Management.
KPIs:
- 6,100 client-facing advisors
- >CAD 55 billion AUA net flows
- CAD 1.33 BB assets under administration
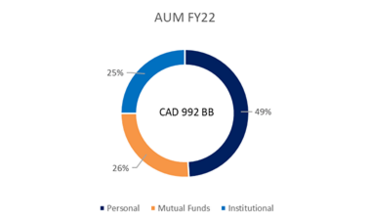
- CAD 992 BB assets under management
Revenue Share FY22
- Canadian Wealth Management increased by 10% YoY primarily driven by higher average fee-based client assets, largely driven by net sales and higher interest income from higher interest rates. FY22 total revenue stands at CAD 4.38 BB.
- US Wealth Management business increased by 18% from FY21 and revenue increased by 14%, primarily due to higher net interest income driven by average volume growth of 14% in loans and 9% in deposits as well as higher interest rates, which also drove higher revenue from sweep deposits.
- The revenue for Global Asset Management decreased by 2%, largely due to changes in the fair value of seed capital investments, the impact of foreign exchange translation as well as lower performance fees.
- International Wealth Management revenue is up significantly increasing by CAD 84 MM or 25% from FY21, primarily due to higher interest rates and higher spreads.
Capital Markets
RBC Capital Markets is a global investment bank providing expertise in advisory & origination, sales & trading, and lending & financing to corporations, institutional clients, asset managers, private equity firms and governments globally.
KPIs:
- 9th largest global investment bank
- Over 19,500 clients
Revenue Share FY22
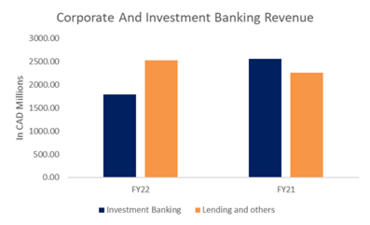
- Corporate and Investment Banking revenues were down 11% from FY21. Investment Banking revenues decreased CAD 773 MM, mainly due to the impact of decreased loan origination and M&A activity primarily in the US. Lending and other revenues increased by 11%, primarily due to average volume growth in the US and Europe.
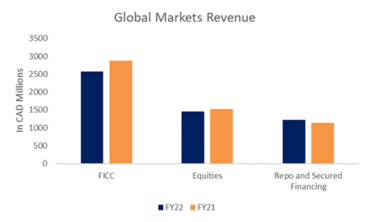
- Revenue in Fixed income, currencies and commodities business decreased CAD 308 MM or 11%, largely driven by lower fixed-income trading revenue and lower debt origination both primarily in the U.S. These factors were partially offset by higher foreign exchange trading revenue across all regions. Equities business revenue decreased by CAD 73 MM or 5%, primarily due to lower equity origination across most regions. Revenue in Repo and secured financing business increased by CAD 84 MM or 7%, mainly due to increased client activity.
Risk review as of Q2FY23
- Lower M&A and loan syndication activity across most regions
- Lower equity trading revenue and lower fixed-income trading across most regions
- Higher expenses resulting from foreign exchange translations
Insurance
RBC Insurance is the largest bank-owned insurance in Canada and offers advice and solutions for life, health, wealth, home, auto, travel, annuities, and reinsurance.
KPIs:
- Largest Canadian-bank owned insurance organization
- >4.9 million clients
Revenue Share FY22
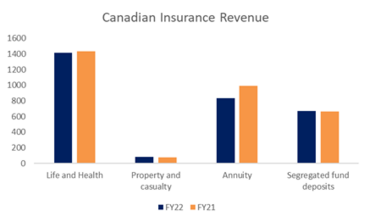
- Canadian Insurance revenue decreased 78% from FY21, primarily due to the change in the fair value of investments backing policyholder liabilities and lower group annuity sales. Premiums and deposits decreased by 5%
- International Insurance, which is primarily focused on the reinsurance business had its revenue increase by CAD 174 MM from FY21
Ownership Structure
| Name | Equities | Percentage | Valuation |
| The Vanguard Group, Inc. | 44,849,838 | 3.24% | 4,284 M $ |
| RBC Global Asset Management, Inc. | 36,433,061 | 2.63% | 3,480 M $ |
| RBC Dominion Securities, Inc. | 32,743,241 | 2.36% | 3,127 M $ |
| CIBC World Markets, Inc. | 22,562,411 | 1.63% | 2,155 M $ |
| Norges Bank Investment Management | 16,830,957 | 1.22% | 1,608 M $ |
| Mackenzie Financial Corp. | 16,648,177 | 1.20% | 1,590 M $ |
| 1832 Asset Management LP | 15,766,416 | 1.14% | 1,506 M $ |
| Fidelity Management & Research Co. LLC | 14,076,997 | 1.02% | 1,344 M $ |
| BMO Asset Management, Inc. | 11,357,393 | 0.82% | 1,085 M $ |
| Wellington Management Co. LLP | 10,922,870 | 0.79% | 1,043 M $ |
The Team
David I. McKay, Chief Executive Officer, Director, President
Dave McKay is President and CEO of RBC, Canada’s biggest bank, and one of the largest in the world based on market capitalization. He is reimagining the future of financial services to help RBC’s clients thrive and communities prosper. Dave holds a Bachelor of Mathematics and an honorary Doctor of Mathematics degree from the University of Waterloo. He also holds an MBA and an honorary Doctor of Laws degree from the Richard Ivey School of Business at the University of Western Ontario, and an honorary degree from Toronto Metropolitan University. He is both a member and a Board of Director at the Business Council of Canada, a member of the U.S. Business Council, a Board of Director with the Institute of International Finance (IIF) and the Bank Policy Institute (BPI). Dave also serves on the Catalyst Canada Advisory Board and is the chair of the Business/Higher Education Roundtable, which brings together Canada’s top businesses, universities and colleges to find ways to better link workplaces and classrooms.
Nadine Ahn, Chief Financial Offfice
Nadine Ahn joined RBC more than 20 years ago and has held progressively senior positions within Corporate Treasury and Finance. As Chief Financial Officer, Nadine is responsible for Finance, Taxation, Performance Management, Investor Relations, Corporate Treasury, and Corporate Development. Together with other members of Group Executive, she is responsible for setting the overall strategic direction of RBC. In addition, Nadine chairs RBC’s Asset-Liability Committee. Nadine is a CPA and holds a Bachelor of Commerce from the University of Toronto. She joined the Board of Michael Garron Hospital Foundation in 2023. A champion of RBC’s Purpose and Values, Nadine previously served on the enterprise Diversity Leadership Council and as the Executive Sponsor of the CFO Group’s Diversity Leadership Council. She is also recognized within the financial services industry for her leadership and vision. In 2019, she was honoured by Women in Capital Markets as a Champion of Change, an award which recognizes leaders who push the boundaries for the advancement of women.
Doug Guzman Group Head, Wealth Management, Insurance and RBC Investor & Treasury Services
As Group Head, RBC Wealth Management, RBC Insurance and RBC Investor & Treasury Services, Doug Guzman leads RBC’s businesses that serve the wealth management needs of affluent and high net worth clients globally, and teams that provide asset management and trust products. He also oversees RBC Insurance, which provides a wide range of insurance, wealth and reinsurance solutions to individual, business and group clients. In addition, along with other members of Group Executive, Mr. Guzman is responsible for setting the overall strategic direction of RBC. Prior to this appointment, Mr. Guzman was Managing Director and Head of Global Investment Banking, RBC Capital Markets, responsible for the firm's Investment Banking teams globally, as well as U.S. Municipal Finance. Before joining RBC in 2005, he was a Managing Director at Goldman Sachs in New York and Toronto, where he had co-head responsibility for each of the Global Metals and Mining and the Canadian Investment Banking businesses.
Graeme Hepworth, Chief Risk Officer
As Chief Risk Officer, Graeme oversees the strategic management of risk on an enterprise-wide basis. He is a member of Group Executive, which sets the overall strategic direction of RBC. He was appointed Chief Risk Officer in 2018. Graeme joined RBC in 1997 as an analyst in Group Risk Management, focusing on foreign exchange products. In 2001, he took on the role of Vice President for GRM's Portfolio Management team focused on loan portfolio risk analysis, economic capital and policy. Graeme moved to New York in 2004 to become Head of Market Risk for the Capital Markets trading businesses in the U.S. In 2011, Graeme moved to London to take on the role as Chief Risk Officer for Europe & Asia. Prior to being appointed CRO, Graeme was EVP, Retail & Commercial Credit Risk, where he led a number of teams that provide the primary risk management support to RBC’s Insurance, Wealth Management and Personal and Commercial Banking (P&CB) businesses. Graeme is a qualified Chartered Financial Analyst and has a Masters in Mathematics from the University of Waterloo.
Maria Douvas, Chief Legal Officer
Maria E. Douvas is Chief Legal Officer and a member of RBC’s Group Executive. In this role, she has oversight of the bank’s global Legal Affairs & Compliance Group, which comprises the bank’s legal, regulatory compliance and government affairs teams. Maria joined RBC in 2016 and has held progressively senior positions over this time, including Executive Vice President & General Counsel, U.S. General Counsel and Global Head of Litigation, and has served on the Operating Committees for both the CFO Group and RBC Capital Markets U.S. She has successfully led RBC’s efforts on a broad range of litigation and regulatory matters, and provides strategic counsel to senior leaders across RBC’s businesses and functions globally. Prior to joining RBC, Maria was a partner at a leading international law firm, and a federal prosecutor in the U.S. Attorney’s Office for the Southern District of New York. She earned her J.D. in 1998 cum laude, Order of the Coif, from the University of Pennsylvania Law School, and her B.A. in 1995 from Columbia University.
Neil McLaughlin, Group Head, Personal & Commercial Banking
As Group Head, Personal & Commercial Banking, Neil McLaughlin is responsible for RBC’s banking businesses in Canada, the Caribbean and the US, including personal and commercial financial services, credit cards and payments, and digital solutions, as well as RBC’s sales and branch distribution, operations and advice centres. He is also responsible for RBCx, the tech banking and innovation group focused on re-imagining the role RBC plays in clients’ lives now and for the future. Prior to his current position, Neil was Executive Vice President, Business Financial Services for RBC’s Canadian Banking division, responsible for setting the strategic direction and leading all lines of business that serve small business and commercial clients through RBC’s extensive business banking network. Neil joined RBC in 1998 and has held a wide range of senior management and executive positions in Canadian Banking, including roles in the Credit Card and Personal Lending businesses, distribution and operations. He also served as Senior Vice President, Risk Operations within Canadian Banking Operations, responsible for credit adjudication, fraud, collections, operational risk and the Commercial Advisory Group.
Derek Neldner, CEO and Group Head, RBC Capital Markets
Derek Neldner is CEO and Group Head of RBC Capital Markets and is a member of RBC’s Group Executive. Derek has global oversight of the firm and, along with the Capital Markets Operating Committee, sets the growth strategy for RBC’s Corporate & Investment Banking and Global Markets business activities worldwide. Together with other members of Group Executive, Derek is also responsible for setting the overall strategic direction of RBC. Derek joined RBC in 1995 and has held a broad array of responsibilities across the firm, and served as Global Head of Investment Banking prior to his current role. He has significant experience across all aspects of investment banking including mergers and acquisitions, debt and equity financing, and he continues to provide senior coverage and advice to a number of the firm’s most significant clients. Derek is also a strong advocate for diversity and inclusion, taking an active role in driving progress across the firm through his role as Executive Chair of the RBC Capital Markets Global Diversity Leadership Council. Derek holds a Bachelor of Commerce degree in Finance from the University of Alberta and is a Chartered Financial Analyst (CFA), as designated by the CFA Institute. Derek is married with four children and lives in Toronto, Canada.
Financials
Income Statement
| Fiscal Year is Nov-Oct. All values CAD millions | |||||
| FY18 | FY19 | FY20 | FY21 | FY22 | |
| Interest Income | 33,021.00 | 41,333.00 | 34,883.00 | 28,145.00 | 40,771.00 |
| Interest and Fees on Loans | 21,249.00 | 24,863.00 | 23,420.00 | 21,654.00 | 26,565.00 |
| Interest Income on Fed. Funds | 5,536.00 | 8,960.00 | 4,668.00 | 1,309.00 | 5,447.00 |
| Interest on Bank Deposits | 566.00 | 683.00 | 307.00 | 305.00 | 1,697.00 |
| Other Interest or Dividend Income | 5,670.00 | 6,827.00 | 6,488.00 | 4,877.00 | 7,062.00 |
| Interest Income Growth | - | 0.25 | -0.16 | -0.19 | 0.45 |
| Total Interest Expense | 15,069.00 | 21,584.00 | 14,048.00 | 8,143.00 | 18,054.00 |
| Interest Expense on Bank Deposits | 9,842.00 | 12,988.00 | 8,783.00 | 5,448.00 | 10,751.00 |
| Other Interest Expense | 5,227.00 | 8,596.00 | 5,265.00 | 2,695.00 | 7,303.00 |
| Interest Expense on Debt | 322.00 | 365.00 | 280.00 | 179.00 | 288.00 |
| Other Borrowed Funds | 4,905.00 | 8,231.00 | 4,985.00 | 2,516.00 | 7,015.00 |
| Total Interest Expense Growth | - | 0.43 | -0.35 | -0.42 | 1.22 |
| Net Interest Income | 17,952.00 | 19,749.00 | 20,835.00 | 20,002.00 | 22,717.00 |
| Net Interest Income Growth | - | 0.10 | 0.06 | -0.04 | 0.14 |
| Loan Loss Provision | 1,307.00 | 1,864.00 | 4,351.00 | -753.00 | 484.00 |
| Net Interest Income after Provision | 16,645.00 | 17,885.00 | 16,484.00 | 20,755.00 | 22,233.00 |
| Net Interest Inc After Loan Loss Prov Growth | - | 0.07 | -0.08 | 0.26 | 0.07 |
| Net Interest Margin | - | - | - | - | 0.01 |
| Non-Interest Income | 23,505.00 | 25,191.00 | 25,257.00 | 28,495.00 | 25,120.00 |
| Securities Gain | 147.00 | 125.00 | 90.00 | 145.00 | 43.00 |
| Trading Account Income | 1,150.00 | 995.00 | 1,239.00 | 1,183.00 | 926.00 |
| Trust Income, Commissions & Fees | 16,601.00 | 16,744.00 | 17,703.00 | 20,079.00 | 20,129.00 |
| Trust Income | 8,928.00 | 9,376.00 | 9,813.00 | 11,383.00 | 11,899.00 |
| Commission & Fee Income | 7,673.00 | 7,368.00 | 7,890.00 | 8,696.00 | 8,230.00 |
| Other Operating Income | 5,607.00 | 7,327.00 | 6,225.00 | 7,088.00 | 4,022.00 |
| Non-Interest Expense | 25,509.00 | 28,224.00 | 28,441.00 | 29,815.00 | 28,392.00 |
| Labor & Related Expense | 13,776.00 | 14,600.00 | 15,252.00 | 16,539.00 | 16,528.00 |
| Equipment Expense | 3,151.00 | 3,412.00 | 3,567.00 | 3,570.00 | 3,653.00 |
| Depreciation & Amortization | 569.00 | 627.00 | 1,333.00 | 1,276.00 | 1,265.00 |
| Operating Income | 14,641 | 14,852 | 13,300 | 19,435 | 18,961 |
| Operating Income Growth | - | 0.01 | -0.10 | 0.46 | -0.02 |
| Operating Income Margin | - | - | - | - | 28.78% |
| Non-Operating Income (Expense) | 1,098 | 986.00 | 1,012.00 | 1,066 | 1,038.00 |
| Miscellaneous Non Operating Expense | 1,098 | 986 | 1,012 | 1,066 | 1,038 |
| Pretax Income | 15,739 | 15,838 | 14,312 | 20,501 | 19,999 |
| Pretax Income Growth | - | 0.63% | -9.64% | 43.24% | -2.45% |
| Pretax Margin | - | - | - | - | 0.30 |
| Income Taxes | 3,329.00 | 3,043.00 | 2,952.00 | 4,581.00 | 4,302.00 |
| Income Tax - Current - Domestic | 3,128.00 | 3,199.00 | 3,542.00 | 4,785.00 | 3,921.00 |
| Income Tax - Deferred - Domestic | 201 | -156 | -590.00 | -204.00 | 381.00 |
| Equity in Affiliates | 2100.00% | 7600.00% | 7700.00% | 13000.00% | 110 |
| Consolidated Net Income | 12,431.00 | 12,871.00 | 11,437.00 | 16,050.00 | 15,807.00 |
| Minority Interest Expense | 31.00 | 11.00 | 5.00 | 12.00 | 13.00 |
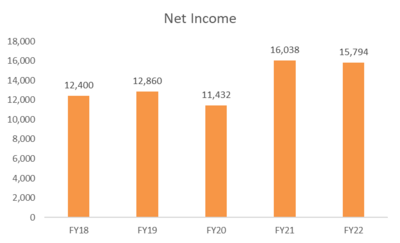
| Net Income | 12,400 | 12,860 | 11,432 | 16,038 | 15,794 |
| Net Income Growth | - | 0.04 | -0.11 | 0.40 | -0.02 |
| Net Margin | - | - | - | - | 0.24 |
| Net Income After Extraordinaries | 12,400.00 | 12,860.00 | 11,432.00 | 16,038.00 | 15,794.00 |
| Preferred Dividends | 285 | 269 | 268 | 257 | 247 |
| Net Income Available to Common | 12,115 | 12,591 | 11,164 | 15,781 | 15,547 |
| EPS (Basic) | 8.39 | 8.78 | 7.84 | 11.08 | 11.08 |
| EPS (Basic) Growth | - | 4.59% | -10.66% | 41.31% | -0.03% |
| Basic Shares Outstanding | 1,444.00 | 1,435.00 | 1,424.00 | 1,424.00 | 1,404.00 |
| EPS (Diluted) | 8.36 | 8.75 | 7.82 | 11.06 | 11.06 |
| EPS (Diluted) Growth | - | 0.05 | -0.11 | 0.41 | 0.00 |
| Diluted Shares Outstanding | 1,450.00 | 1,441.00 | 1,429.00 | 1,427.00 | 1,406.00 |
Balance Sheet
| Fiscal Year is Nov-Oct. All values CAD millions | FY18 | FY19 | FY20 | FY21 | FY22 |
|---|---|---|---|---|---|
| Total Cash & Due from Banks | 44,676.00 | 41,939.00 | 137,007.00 | 128,387.00 | 98,031.00 |
| Cash & Due from Banks Growth | - | -6.13% | 227% | -6% | -24% |
| Investments - Total | 611,507.00 | 657,525.00 | 702,317.00 | 688,168.00 | 790,507.00 |
| Trading Account Securities | 220,741.00 | 247,259.00 | 247,007.00 | 233,193.00 | 303,685.00 |
| Federal Funds Sold & Securities Purchased | 294,602.00 | 306,961.00 | 313,015.00 | 307,903.00 | 317,845.00 |
| Securities Bought Under Resale Agreement | 294,602 | 306,961 | 313,015 | 307,903 | 317,845 |
| Treasury Securities | 24,690.00 | 23,574.00 | 34,374.00 | 36,746.00 | 36,081.00 |
| Federal Agency Securities | 238.00 | 657.00 | 2,541.00 | 3,703.00 | 3,781.00 |
| State & Municipal Securities | 34,018.00 | 40,437.00 | 64,070.00 | 65,370.00 | 80,614.00 |
| Mortgage Backed Securities | 10,345.00 | 11,476.00 | 10,798.00 | 11,070.00 | 11,647.00 |
| Other Securities | 25,317.00 | 26,326.00 | 27,960.00 | 28,595.00 | 37,895.00 |
| Other Investments | 1,556.00 | 835.00 | 2,552.00 | 1,588.00 | -1,041.00 |
| Investments Growth | - | 7.53% | 6.81% | -2.01% | 14.87% |
| Net Loans | 613,289.00 | 657,201.00 | 700,005.00 | 797,213.00 | 927,976.00 |
| Commercial & Industrial Loans | 185,144.00 | 201,304.00 | 214,397.00 | 230,069.00 | 286,636.00 |
| Consumer & Installment Loans | 112,115 | 112,561 | 109,637 | 111,263 | 118,286 |
| Interbank Loans | 36,471.00 | 38,345.00 | 39,013.00 | 79,638.00 | 108,011.00 |
| Real Estate Mortgage Loans | 282,471.00 | 308,091.00 | 342,597.00 | 380,332.00 | 418,796.00 |
| Loan Loss Allowances (Reserves) | -2,912.00 | -3,100.00 | -5,639.00 | -4,089.00 | -3,753.00 |
| Investment in Unconsolidated Subs. | 686.00 | 652.00 | 652.00 | 654.00 | 711.00 |
| Customer Liability on Acceptances | 15,641.00 | 18,062.00 | 18,507.00 | 19,798.00 | 17,827.00 |
| Loans - 1 Yr Growth Rate | - | 0.07 | 0.07 | 0.14 | 0.16 |
| Net Property, Plant & Equipment | 2,832.00 | 3,191.00 | 7,934.00 | 7,424.00 | 7,214.00 |
| Other Assets (Including Intangibles) | 44,628 | 48,376 | 55,547 | 62,668 | 73,481 |
| Other Assets | 28,804.00 | 32,466.00 | 39,493.00 | 47,343.00 | 55,121.00 |
| Intangible Assets | 15,824.00 | 15,910.00 | 16,054.00 | 15,325.00 | 18,360.00 |
| Deferred Charges | 626.00 | 147.00 | 143.00 | 2,640 | 3,331 |
| Total Assets | 1,334,734 | 1,428,935 | 1,624,548 | 1,706,323 | 1,917,219 |
| Total Deposits | 803,676.00 | 860,214.00 | 967,363.00 | 1,058,841.00 | 1,164,802.00 |
| Demand Deposits | 373,718.00 | 397,071.00 | 498,217.00 | 563,513.00 | 551,649.00 |
| Savings/Time Deposits | 429,958.00 | 463,143.00 | 469,146.00 | 495,328.00 | 613,153.00 |
| Deposits Growth | - | 0.07 | 0.12 | 0.09 | 0.10 |
| Total Debt | 248,466.00 | 262,192.00 | 333,977.00 | 318,861.00 | 342,703.00 |
| ST Debt & Current Portion LT Debt | 208,324.00 | 228,967.00 | 282,395.00 | 255,669.00 | 277,471.00 |
| Current Portion of Long Term Debt | - | - | 633.00 | 819.00 | 764.00 |
| Short Term Debt | 208,324.00 | 228,967.00 | 281,762.00 | 254,850.00 | 276,707.00 |
| Long-Term Debt | 40,142.00 | 33,225.00 | 51,582.00 | 63,192.00 | 65,232.00 |
| LT Debt excl. Capitalized Leases | 40,142.00 | 33,225.00 | 46,858.00 | 58,746.00 | 60,776.00 |
| Provision for Risks & Charges | 2,409.00 | 3,280.00 | 3,042.00 | 2,639.00 | 2,295.00 |
| Long Term Debt Growth | - | -17.23% | 55.25% | 22.51% | 3.23% |
| Deferred Tax Liabilities | -1,391.00 | -1,907.00 | -2,527.00 | -1,937.00 | -1,033.00 |
| Deferred Taxes - Credit | 84.00 | 82.00 | 52.00 | 74.00 | 439.00 |
| Deferred Taxes - Debit | 1,475.00 | 1,989.00 | 2,579.00 | 2,011.00 | 1,472.00 |
| Other Liabilities | 200,144.00 | 219,542.00 | 233,347.00 | 227,146.00 | 298,805.00 |
| Other Liabilities (excl. Deferred Income) | 197,885.00 | 216,979.00 | 230,402.00 | 223,628.00 | 295,145.00 |
| Deferred Income | 2,259.00 | 2,563.00 | 2,945.00 | 3,518.00 | 3,660.00 |
| Total Liabilities | 1,254,779.00 | 1,345,310.00 | 1,537,781.00 | 1,607,561.00 | 1,809,044.00 |
| Preferred Stock (Carrying Value) | 6,306.00 | 5,706.00 | 5,948.00 | 6,723.00 | 7,323.00 |
| Non-Redeemable Preferred Stock | 6,306.00 | 5,706.00 | 5,948.00 | 6,723.00 | 7,323.00 |
| Common Equity (Total) | 73,555.00 | 77,817.00 | 80,716.00 | 91,944.00 | 100,741.00 |
| Common Stock Par/Carry Value | 17,635.00 | 17,645.00 | 17,628.00 | 17,728.00 | 17,318.00 |
| Retained Earnings | 51,112 | 55,981 | 59,806 | 71,795 | 78,037 |
| Cumulative Translation Adjustment/Unrealized For. Exch. Gain | 4,147.00 | 4,221.00 | 4,632.00 | 2,055.00 | 5,688.00 |
| Unrealized Gain/Loss Marketable Securities | -12 | 33 | -139 | -88.00 | -2,357.00 |
| Other Appropriated Reserves | 688.00 | -6.00 | -1,079.00 | 566.00 | 2,394.00 |
| Treasury Stock | -15.00 | -57.00 | -132.00 | -112.00 | -339.00 |
| Common Equity / Total Assets | 0.06% | 0.05% | 0.05% | 0.05% | 0.05% |
| Total Shareholders' Equity | 79,861.00 | 83,523.00 | 86,664.00 | 98,667.00 | 108,064.00 |
| Total Shareholders' Equity / Total Assets | 5.98% | 5.85% | 5.33% | 5.78% | 5.64% |
| Return On Average Total Equity | - | - | - | - | 0.15 |
| Accumulated Minority Interest | 94.00 | 102.00 | 103.00 | 95.00 | 111.00 |
| Total Equity | 79,955.00 | 83,625.00 | 86,767.00 | 98,762.00 | 108,175.00 |
| Liabilities & Shareholders' Equity | 1,334,734.00 | 1,428,935.00 | 1,624,548.00 | 1,706,323.00 | 1,917,219.00 |
Cash Flow Statement
| Fiscal Year is Nov-Oct. All values CAD millions | FY18 | FY19 | FY20 | FY21 | FY22 |
|---|---|---|---|---|---|
| Funds from Operations | 15,659.00 | 15,705.00 | 17,567.00 | 18,166.00 | 19,261.00 |
| Funds from Operations Growth | - | 0.29% | 11.86% | 3.41% | 6.03% |
| Changes in Working Capital | 1,408.00 | 9,808.00 | 25.00 | 1,124 | 62,826 |
| Net Operating Cash Flow | 17,067.00 | 25,513.00 | 17,592.00 | 19,290.00 | 82,087.00 |
| Net Operating Cash Flow Growth | - | 49.49% | -31.05% | 9.65% | 325.54% |
| Capital Expenditures | -1,980 | -2,261 | -2,629 | -2,186 | -2,500 |
| Capital Expenditures (Fixed Assets) | -1,980 | -2,261 | -2,629 | -2,186 | -2,500 |
| Net Assets from Acquisitions | -65 | -106 | -22 | - | -2,360 |
| Sale of Fixed Assets & Businesses | 14.00 | 173.00 | - | 78.00 | - |
| Purchase/Sale of Investments | -72,523 | -45,214 | -43,835 | 5,273 | -101,592 |
| Purchase of Investments | -132,912.00 | -110,591.00 | -167,498.00 | -126,711.00 | -200,735.00 |
| Sale/Maturity of Investments | 60,389 | 65,377 | 123,663 | 131,984 | 99,143 |
| Increase in Loans | -45,286 | -44,546 | -46,315 | -95,605 | -131,026 |
| Net Investing Cash Flow | -119,840 | -91,954 | -92,801 | -92,440 | -237,478 |
| Net Investing Cash Flow Growth | - | 23.27% | -0.92% | 0.39% | -156.90% |
| Cash Dividends Paid - Total | -5,640 | -6,025.00 | -6,333.00 | -6,420.00 | -6,960.00 |
| Common Dividends | -5,640.00 | -6,025.00 | -6,333.00 | -6,420.00 | -6,960.00 |
| Cash Dividend Growth | - | -0.07 | -0.05 | -1.37% | -8.41% |
| Increase in Deposits | 48,499 | 49,808 | 126,826 | 88,876 | 108,533 |
| Change in Capital Stock | -2,043.00 | -1,567.00 | -582.00 | 880.00 | -5,008.00 |
| Repurchase of Common & Preferred Stk. | -7,853 | -7,544 | -7,175 | -6,218 | -11,282 |
| Sale of Common & Preferred Stock | 5,810 | 5,977 | 6,593 | 7,098 | 6,274 |
| Proceeds from Stock Options | 5,810 | 5,977 | 6,593 | 7,098 | 6,274 |
| Issuance/Reduction of Debt, Net | 63,730 | 19,909 | 47,408 | -11,794 | 22,163 |
| Change in Current Debt | 63,730 | 19,509 | 47,658 | -12,044 | 21,355 |
| Change in Long-Term Debt | - | 400 | -250 | 250 | 808 |
| Issuance of Long-Term Debt | - | 1,500 | 2,750 | 2,750 | 1,000 |
| Reduction in Long-Term Debt | - | -1,100 | -3,000 | -2,500 | -192 |
| Other Funds | -37.00 | -2.00 | -6.00 | -3.00 | -5.00 |
| Other Uses | -37.00 | -2.00 | -6.00 | -3.00 | -5.00 |
| Net Financing Cash Flow | 104,509 | 62,123 | 166,725 | 70,918 | 118,094 |
| Net Financing Cash Flow Growth | - | -40.56% | 168.38% | -57.46% | 66.52% |
Capital Structure
| Debt Ratios | FY18 | FY19 | FY20 | FY21 | FY22 |
|---|---|---|---|---|---|
| Debt Ratio | 0.94 | 0.94 | 0.95 | 0.94 | 0.94 |
| Debt to Equity Ratio | 3.11 | 3.14 | 3.85 | 3.23 | 3.17 |
| Long-term Debt to Capitalization | 0.35 | 0.30 | 0.39 | 0.41 | 0.39 |
| Total Debt to Capitalization | 0.77 | 0.77 | 0.81 | 0.78 | 0.77 |
| Interest Coverage | 0.97 | 0.69 | 0.95 | 2.39 | 1.05 |
| Cash flow to Debt Ratio | 0.07 | 0.10 | 0.05 | 0.06 | 0.24 |
| Equity Multiplier | 16.69 | 17.09 | 18.72 | 17.28 | 17.72 |
| Tax Rate | ||||||
|---|---|---|---|---|---|---|
| FY18 | FY19 | FY20 | FY21 | FY22 | ||
| Historical Tax Rate | Effective Tax Rate from B/S | 21.10% | 19.10% | 20.50% | 22.20% | 21.40% |
| Selected Tax Rate | 20.86% | |||||
| Cost of Debt (Effective Interest Rate Method) | ||||||
|---|---|---|---|---|---|---|
| FY18 | FY19 | FY20 | FY21 | FY22 | ||
| Interest Expense | From I/S | 15,069 | 21,584 | 14,048 | 8,143 | 18,054 |
| Total Debt | From B/S | 248,466 | 262,192 | 333,977 | 318,861 | 342,703 |
| Effective Interest Rate | 6.06% | 8.23% | 4.21% | 2.55% | 5.27% | |
| Average Effective Interest Rate | 5.27% | |||||
| Weighted Average Cost of Capital | |
|---|---|
| Share Price | 130.16 |
| Beta | 0.78 |
| Diluted Shares Outstanding | 1,406.00 |
| Cost of Debt | 5.27% |
| Tax Rate | 20.86% |
| After Tax Cost of Debt | 4.17% |
| Risk Free Rate | 3.53% |
| Market Risk Premium | 14.86% |
| Cost of Equity | 15.10% |
| Total Debt | 342,703.00 |
| Total Equity | 183,004.96 |
| Total Capital | 525,707.96 |
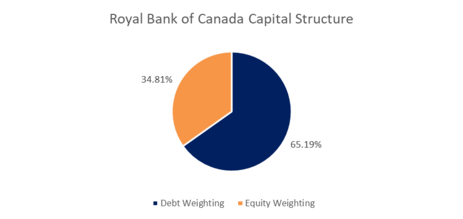
| Debt Weighting | 65.19% |
| Equity Weighting | 34.81% |
| WACC | 7.97% |
RBC has a credit rating of Aa- which is investment grade. It has maintained an interest coverage ratio of 0.97 - 2.39 from FY18-FY22 indicating that it has more interest expenses that EBIT. The debt/equity ratio ranged from 3.11 - 3.85 from FY18-FY22 indicating that RBC is a highly levered firm. The Weighted Average Cost of Capital is 7.97%.
Valuations
Dividend Discount Model
| Current Price | 130.16 |
| Dividend yield | 3.94% |
| Dividend payout ratio | 44.07% |
| Retention rate | 55.93% |
| ROE | 14.60% |
| Growth Rate | 8.17% |
| Current Dividend | 4.96 |
| Risk Free Rate | 3.53% |
| Market Risk Premium | 14.86% |
| Beta | 0.78 |
| Cost of Equity | 15.10% |
| 1 year forward dividend | 5.37 |
| DDM fair value | 77.36 |
| Sensitivity Analysis | ||||||||||||||
|---|---|---|---|---|---|---|---|---|---|---|---|---|---|---|
| Growth Rate | ||||||||||||||
| 77.36 | 5.0% | 5.5% | 6.0% | 6.5% | 7.0% | 7.5% | 8.0% | 8.5% | 9.0% | 9.5% | 10.0% | 10.5% | 11.0% | |
| Required Rate of Return | 11% | 86.80 | 95.14 | 105.15 | 117.39 | 132.68 | 152.34 | 178.56 | 215.26 | 270.32 | 362.08 | 545.60 | 1096.16 | -1.3224E+17 |
| 12% | 74.40 | 80.50 | 87.63 | 96.04 | 106.14 | 118.49 | 133.92 | 153.76 | 180.21 | 217.25 | 272.80 | 365.39 | 550.56 | |
| 13% | 65.10 | 69.77 | 75.11 | 81.27 | 88.45 | 96.95 | 107.14 | 119.59 | 135.16 | 155.18 | 181.87 | 219.23 | 275.28 | |
| 14% | 57.87 | 61.56 | 65.72 | 70.43 | 75.82 | 82.03 | 89.28 | 97.85 | 108.13 | 120.69 | 136.40 | 156.59 | 183.52 | |
| 15% | 52.08 | 55.08 | 58.42 | 62.15 | 66.34 | 71.09 | 76.53 | 82.79 | 90.11 | 98.75 | 109.12 | 121.80 | 137.64 | |
| 16% | 47.35 | 49.84 | 52.58 | 55.60 | 58.97 | 62.73 | 66.96 | 71.75 | 77.23 | 83.56 | 90.93 | 99.65 | 110.112 | |
| 17% | 43.40 | 45.50 | 47.80 | 50.31 | 53.07 | 56.13 | 59.52 | 63.31 | 67.58 | 72.42 | 77.94 | 84.32 | 91.76 | |
| 18% | 40.06 | 41.86 | 43.81 | 45.93 | 48.25 | 50.78 | 53.57 | 56.65 | 60.07 | 63.90 | 68.20 | 73.08 | 78.65142857 | |
| 19% | 37.20 | 38.76 | 40.44 | 42.26 | 44.23 | 46.37 | 48.70 | 51.25 | 54.06 | 57.17 | 60.62 | 64.48 | 68.82 | |
| 20% | 34.72 | 36.09 | 37.55 | 39.13 | 40.82 | 42.66 | 44.64 | 46.80 | 49.15 | 51.73 | 54.56 | 57.69 | 61.17333333 | |
| 21% | 32.55 | 33.76 | 35.05 | 36.43 | 37.91 | 39.50 | 41.21 | 43.05 | 45.05 | 47.23 | 49.60 | 52.20 | 55.056 | |
| Implied Growth Rate | |
|---|---|
| Current Price | 130.16 |
| Estimated Next Year Dividend | 5.37 |
| Cost of Equity | 15.10% |
| Implied Growth Rate | 10.98% |
For the dividend discount model, the growth rate was calculated using the ROE and Retention rate. Cost of equity was calculated using the CAPM. The fair value for RBC's stock price comes up to CAD 77.36 which is at a 40% discount to the current market price of 130.16.
Multiples Approach
| Competitors | P/Ex | P/Bx |
|---|---|---|
| Bank of America Corp | 9.10 | 0.9 |
| BMO Bank of Montreal | 9.34 | 1.29 |
| Citi Group | 7.14 | 0.49 |
| HSBC Holdings | 6.94 | 0.9 |
| JPMorgan Chase & Co. | 10.41 | 1.5 |
| Toronto-Dominion Bank | 10.73 | 1.41 |
| Wells Fargo & Co. | 11.00 | 0.9 |
| Average | 9.24 | 1.06 |
| Median | 9.34 | 0.90 |
| Calculating the price based on P/E multiple | ||||
|---|---|---|---|---|
| P/E | Earnings | Shares | Price | Market cap |
| 9.24x | 15,794.00 | 1,406.00 | 103.76 | 145,891.43 |
| Calculating the price based on P/B multiple | ||||
|---|---|---|---|---|
| P/B | Book Value | Shares | Price | Market cap |
| 1.06x | 108,175.00 | 1,406.00 | 81.22 | 114,201.89 |
For the multiples approach, the average P/E and P/B ratio was calculated using a basket of P/E and P/B ratios of competitors. Based on the P/E multiple, the price is CAD 103.76 which is at a 23% discount to the current market price. Based on the P/B multiple, the price is CAD 81.22 which is at a 37.5% discount to the current market price.
Risks
Interest Rate Risks
- Arguably, the biggest factor affecting the banking sector is the high interest rate environments. Central banks of developed countries have gone through a process of aggressive rate hikes over the past year to combat persistent inflation. However, it is expected that the central banks are approaching the end of their current cycle of rate increases, for example, even though the Fed raised the interest rates to 5.5%in the recent meeting, it is expected that this is the last rate hike.
- The lagged effects of aggressive rate hikes are beginning to show, with easing inflation but mild recessions expected in some of the large global economies.
- We have already seen a rise in the provisions for Gross Impaired Loans, Allowances for Credit Losses and Write-Offs in Credit Cards and Personal Loans
Canadian Housing and Household Indebtness
- Canadian housing and household indebtedness risks remain heightened in the current rising interest rate environment. Concerns related to elevated levels of mortgage-related Canadian household debt, which accelerated during the COVID-19 pandemic, could escalate if the BoC continues to increase interest rates, if the current period of elevated inflation is prolonged or if unemployment increases, potentially resulting in, among other things, higher credit losses.
Credit Risk
- Credit risk includes retail credit risk, wholesale credit risk and wrong-way risk. Total credit risk exposure increased CAD179 billion or 10% from FY21, primarily due to the impact of foreign exchange translation, volume growth in loans, higher derivative exposure and an increase in securities.
