File:Image5-b79de835be7f9c3b8036bce0718d904b.png
No higher resolution available.
Image5-b79de835be7f9c3b8036bce0718d904b.png (800 × 294 pixels, file size: 39 KB, MIME type: image/png)
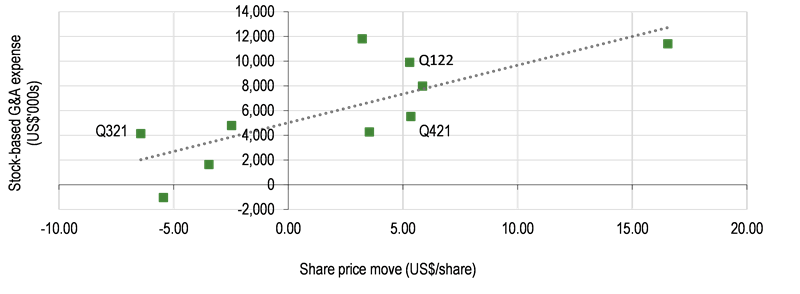
Graph of historical share price move (US$/share) versus quarterly stock-based G&A expense, Q419–Q122
File history
Click on a date/time to view the file as it appeared at that time.
| Date/Time | Thumbnail | Dimensions | User | Comment | |
|---|---|---|---|---|---|
| current | 11:03, 24 June 2022 | 800 × 294 (39 KB) | Edison (talk | contribs) |
You cannot overwrite this file.
File usage
The following page uses this file: