Mint Measure: Difference between revisions
>Louis Created page with "'''Making ad spend analytics easy to understand for every marketer''' == Summary == * $930K lifetime revenue (historical & contracted) * Hired first two full-time employees in 2022 (Engineer & BDR) * Raised $200K in pre-seed round in late 2021 * Four active clients, two signed LOIs, $350k in weighted sales pipeline * Fully automated reporting UI launched Q4 2021 (manual work cut 90% YoY) * Approached by two companies for acquisition in 2022 (both declined) * Added 5x C..." |
No edit summary |
||
| (2 intermediate revisions by one other user not shown) | |||
| Line 1: | Line 1: | ||
== Summary == | |||
'''Making ad spend analytics easy to understand for every marketer''' | '''Making ad spend analytics easy to understand for every marketer''' | ||
[[File:Mintmeasurelogo.png|thumb]] | |||
* $930K lifetime revenue (historical & contracted) | * $930K lifetime revenue (historical & contracted) | ||
| Line 30: | Line 33: | ||
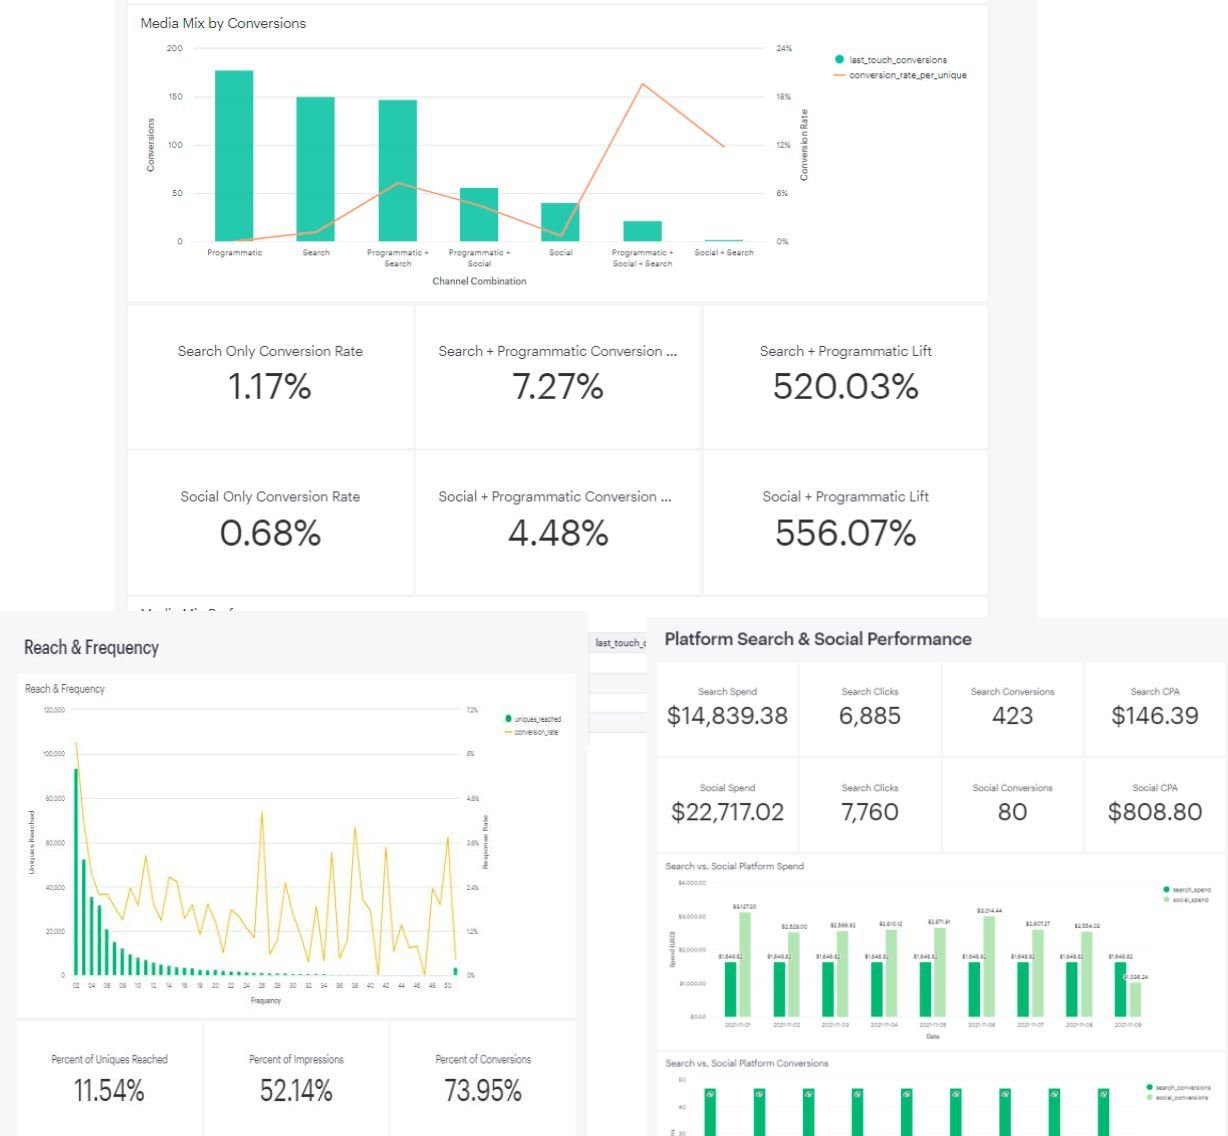
Here's a look at our UI and reports: | Here's a look at our UI and reports: | ||
[[File:81dac9f2fad9c07adc328ba9105eefb787c70cf.png]] | |||
== Product == | == Product == | ||
| Line 37: | Line 42: | ||
This data is cleaned and transformed into easy-to-read charts. Insights give context, and recommendations are provided for the client to take action. | This data is cleaned and transformed into easy-to-read charts. Insights give context, and recommendations are provided for the client to take action. | ||
[[File:C416b18259c182cb277a2fc8f44690b085b1fa79.png]] | |||
=== Mint Measure’s unfair advantage === | === Mint Measure’s unfair advantage === | ||
| Line 50: | Line 57: | ||
== Traction == | == Traction == | ||
== By the numbers == | === By the numbers === | ||
=== Revenue === | ==== Revenue ==== | ||
* 2020 revenue - $47,500 | * 2020 revenue - $47,500 | ||
| Line 58: | Line 65: | ||
* 2022 bookings - $506,000 (+53% YoY) | * 2022 bookings - $506,000 (+53% YoY) | ||
** $149K ARR + $357K Pay-per-use | ** $149K ARR + $357K Pay-per-use | ||
[[File:36d80221b9f374b46716da358c69259a13a57498.png]] | |||
=== Customers === | ==== Customers ==== | ||
* 4 active clients | * 4 active clients | ||
| Line 67: | Line 75: | ||
=== Where we are today === | === Where we are today === | ||
==== Core Analytics Platform ==== | |||
Serving clients for ~18 months | Serving clients for ~18 months | ||
| Line 74: | Line 82: | ||
* $506K booked so far for 2022 | * $506K booked so far for 2022 | ||
Repackage products | ==== Repackage products ==== | ||
* Parsed analytics into 3 SaaS products to align with client needs and stages of growth | * Parsed analytics into 3 SaaS products to align with client needs and stages of growth | ||
* Launched new SaaS website in February, with ability for customer to purchase online | * Launched new SaaS website in February, with ability for customer to purchase online | ||
Data Sales | ==== Data Sales ==== | ||
* Upsold a current client to begin using audience data | * Upsold a current client to begin using audience data | ||
* 3 upcoming pilot campaigns with brands for data sales | * 3 upcoming pilot campaigns with brands for data sales | ||
Staff & Growth | ==== Staff & Growth ==== | ||
Hired first 2 staff | Hired first 2 staff | ||
| Line 91: | Line 96: | ||
* Lead Engineer | * Lead Engineer | ||
Partnerships | ==== Partnerships ==== | ||
* Developing long term partnership with High There/CannaGrowth platform to serve as their dedicated analytics provider | * Developing long term partnership with High There/CannaGrowth platform to serve as their dedicated analytics provider | ||
* Expanding relationships with ad agencies to gain client referrals | * Expanding relationships with ad agencies to gain client referrals | ||
| Line 101: | Line 105: | ||
=== We service brands spending $400k–$30M per year on advertising. === | === We service brands spending $400k–$30M per year on advertising. === | ||
[[File:1695e004504aa2cec410d737a7517bbda9329bc.png]] | |||
=== Facts about attribution === | === Facts about attribution === | ||
* 70% say cost justification is a challenge | * '''70%''' say cost justification is a challenge | ||
* 78% of marketers plan to adapt of increase their use of cross channel attribution | * '''78%''' of marketers plan to adapt of increase their use of cross channel attribution | ||
* Only 39% of companies are carrying out attribution on ‘all or most’ of their marketing activities (Source: econsultancy) | * Only '''39%''' of companies are carrying out attribution on ‘all or most’ of their marketing activities (Source: '''econsultancy''') | ||
* 70% of businesses are now struggling to act on the insights they gain from attribution (Source: AdRoll) | * '''70%''' of businesses are now struggling to act on the insights they gain from attribution (Source: '''AdRoll''') | ||
* 42% of marketers report attribution manually using spreadsheets (Source: econsultancy) | * '''42%''' of marketers report attribution manually using spreadsheets (Source: econsultancy) | ||
* 53.3% say a minimal understanding is the main challenge of effective marketing attribution (Source: Ruler Analytics) | * '''53.3%''' say a minimal understanding is the main challenge of effective marketing attribution (Source: Ruler Analytics) | ||
== Business model == | == Business model == | ||
== Monthly fee and pay-per-use options == | === Monthly fee and pay-per-use options === | ||
=== Option 1: Monthly Fee (SaaS) === | ==== Option 1: Monthly Fee (SaaS) ==== | ||
* 3 tiers of product | * 3 tiers of product | ||
| Line 123: | Line 128: | ||
* Currently our GTM for 2022 | * Currently our GTM for 2022 | ||
=== Option 2: Pay-Per-Use === | ==== Option 2: Pay-Per-Use ==== | ||
* For ad agencies only | * For ad agencies only | ||
| Line 131: | Line 136: | ||
== Market == | == Market == | ||
== Attribution companies intersect: == | === Attribution companies intersect: === | ||
=== Analytics + digital identity + data sales === | ==== Analytics + digital identity + data sales ==== | ||
* Nielsen – $6B Revenue | * Nielsen – $6B Revenue | ||
| Line 143: | Line 148: | ||
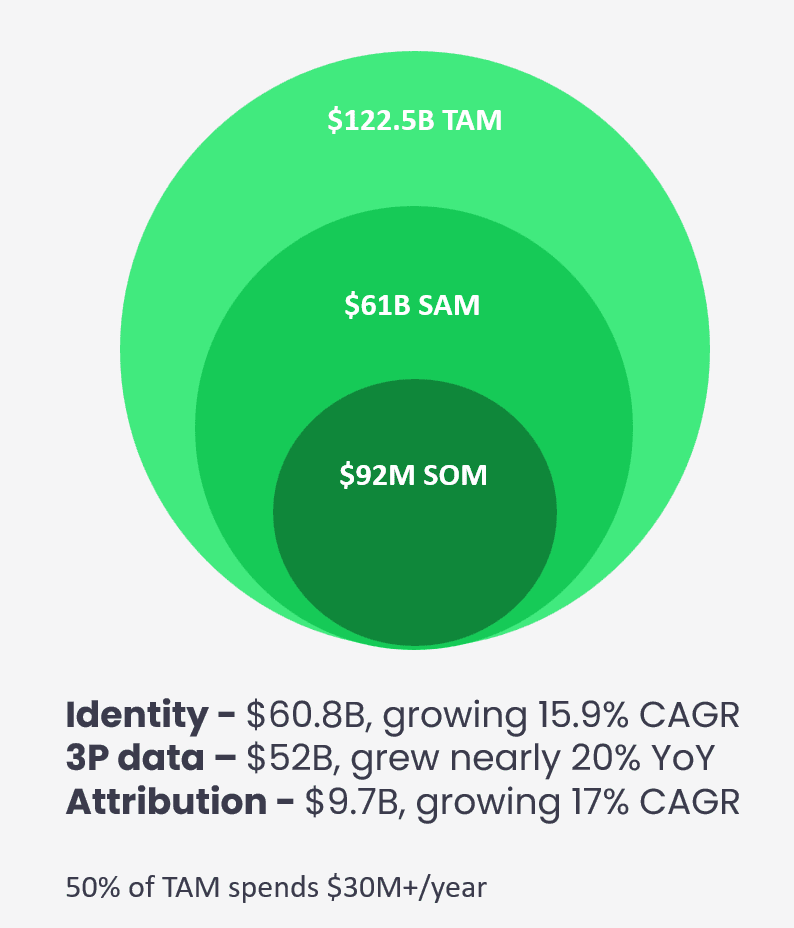
* 18 month SOM* - $2M ARR | * 18 month SOM* - $2M ARR | ||
* 6 year SOM* - $92M ARR | * 6 year SOM* - $92M ARR | ||
[[File:5f40067d93a8cebfcf709cd3b5215e5401b8986.png]] | |||
<nowiki>*</nowiki>SOM is project growth | <nowiki>*</nowiki>SOM is project growth | ||
| Line 148: | Line 154: | ||
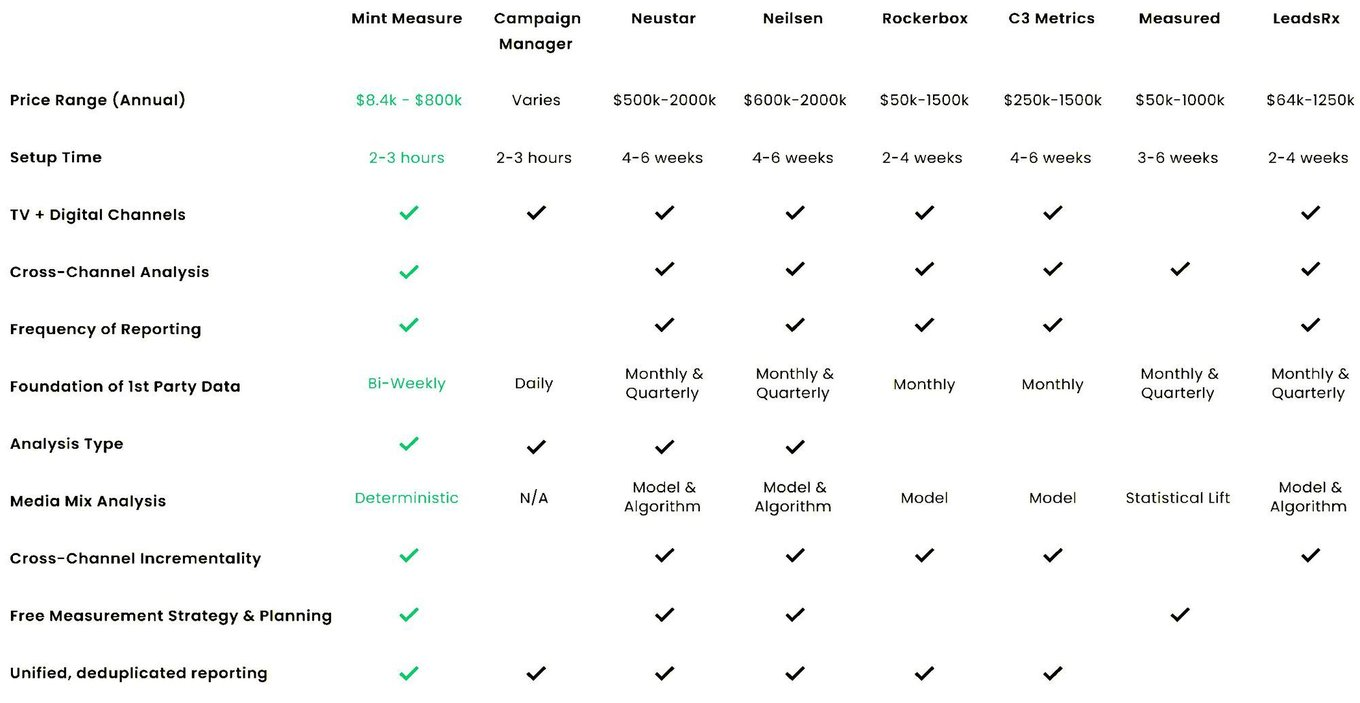
== Competition == | == Competition == | ||
== Competitive landscape == | === Competitive landscape === | ||
[[File:010b502a817b5d16e3c37db3a05eaed232a0b9c6.png]] | |||
== Vision and strategy == | == Vision and strategy == | ||
== What we'll achieve with your investment == | === What we'll achieve with your investment === | ||
==== Core Analytics (SaaS) ==== | |||
* Finalize product market fit; repeatable sales processes | * Finalize product market fit; repeatable sales processes | ||
* Add $750K ARR in 12 months | * Add $750K ARR in 12 months | ||
| Line 160: | Line 167: | ||
* Continue automating workflows and scale prep | * Continue automating workflows and scale prep | ||
Data Sales & Identity | ==== Data Sales & Identity ==== | ||
* Build pipes & automate data workflows for data sales | * Build pipes & automate data workflows for data sales | ||
** Create integrations into top 5 DSPs | ** Create integrations into top 5 DSPs | ||
| Line 168: | Line 174: | ||
=== Use of Funds === | === Use of Funds === | ||
=== Team Marketing === | ==== Team Marketing ==== | ||
* Biz Dev & Account Executives (23%) | * Biz Dev & Account Executives (23%) | ||
| Line 174: | Line 180: | ||
* Data Analyst (11%) | * Data Analyst (11%) | ||
=== Capx === | ==== Capx ==== | ||
* Databricks & Azure (7%) | * Databricks & Azure (7%) | ||
* ID5 & Experian (4%) | * ID5 & Experian (4%) | ||
=== Marketing === | ==== Marketing ==== | ||
* SEO & paid search (7%) | * SEO & paid search (7%) | ||
| Line 185: | Line 191: | ||
* Industry conferences (3%) | * Industry conferences (3%) | ||
=== Other === | ==== Other ==== | ||
* Legal (2%) | * Legal (2%) | ||
| Line 193: | Line 199: | ||
== Funding == | == Funding == | ||
* Joe Zawadzki - Former CEO & Co-Founder at MediaMath, GP at Aperiam Ventures (<nowiki>https://www.linkedin.com/in/jzawadzki/</nowiki>) | * Joe Zawadzki - Former CEO & Co-Founder at MediaMath, GP at Aperiam Ventures [https://www.linkedin.com/in/jzawadzki/ (<nowiki>https://www.linkedin.com/in/jzawadzki/</nowiki>)] | ||
* Erich Wasserman - Co-Founder at MediaMath & Rigor (<nowiki>https://www.linkedin.com/in/erichwasserman/</nowiki>) | * Erich Wasserman - Co-Founder at MediaMath & Rigor [https://www.linkedin.com/in/erichwasserman/ (<nowiki>https://www.linkedin.com/in/erichwasserman/</nowiki>)] | ||
* Andy Kemp - Managing Partner at KORTX (<nowiki>https://www.linkedin.com/in/kemperdrew/</nowiki>) | * Andy Kemp - Managing Partner at KORTX [https://www.linkedin.com/in/kemperdrew/ (<nowiki>https://www.linkedin.com/in/kemperdrew/</nowiki>)] | ||
* Erik Stubenvoll - Managing Director at KORTX (<nowiki>https://www.linkedin.com/in/erik-stubenvoll/</nowiki>) | * Erik Stubenvoll - Managing Director at KORTX [https://www.linkedin.com/in/erik-stubenvoll/ (<nowiki>https://www.linkedin.com/in/erik-stubenvoll/</nowiki>)] | ||
== Founders == | == Founders == | ||
[[File:Scott Konopasek.png|250x250px]] | |||
'''Scott Konopasek''' | '''Scott Konopasek''' | ||
| Line 209: | Line 217: | ||
* Track record driving double-digit growth for clients | * Track record driving double-digit growth for clients | ||
* Process-driven thinker | * Process-driven thinker | ||
[[File:Alex Netelkos.png|268x268px]] | |||
'''Alex Netelkos''' | '''Alex Netelkos''' | ||
| Line 236: | Line 245: | ||
Business Development Representative | Business Development Representative | ||
[[Category:Thesis]] | |||
[[Category:Equities]] | |||
__INDEX__ | |||
Latest revision as of 11:26, 14 August 2022
Summary edit edit source
Making ad spend analytics easy to understand for every marketer

- $930K lifetime revenue (historical & contracted)
- Hired first two full-time employees in 2022 (Engineer & BDR)
- Raised $200K in pre-seed round in late 2021
- Four active clients, two signed LOIs, $350k in weighted sales pipeline
- Fully automated reporting UI launched Q4 2021 (manual work cut 90% YoY)
- Approached by two companies for acquisition in 2022 (both declined)
- Added 5x CEO Bill Eichen as advisor in Jan 2022 (MD @ GimmelFund)
Problem edit edit source
79% of marketers struggle to interpret and apply data analytics to improve marketing ROAS. edit edit source
This is due to specialized knowledge requirements and lack of analytical staff.*
As a result, advertisers either forego buying analytics tools or use biased platform data to evaluate ad spend effectiveness.
*emarketer study 2019
Solution edit edit source
Simple, actionable ad analytics edit edit source
Mint Measure’s ad analytics platform provides easy-to-read charts and pre-analyzed insights so any marketer knows what’s working.
Prescriptive recommendations make optimizations easy and actionable.
We help brands know which ad channels are driving results and how to optimize.
Here's a look at our UI and reports:
Product edit edit source
How it works edit edit source
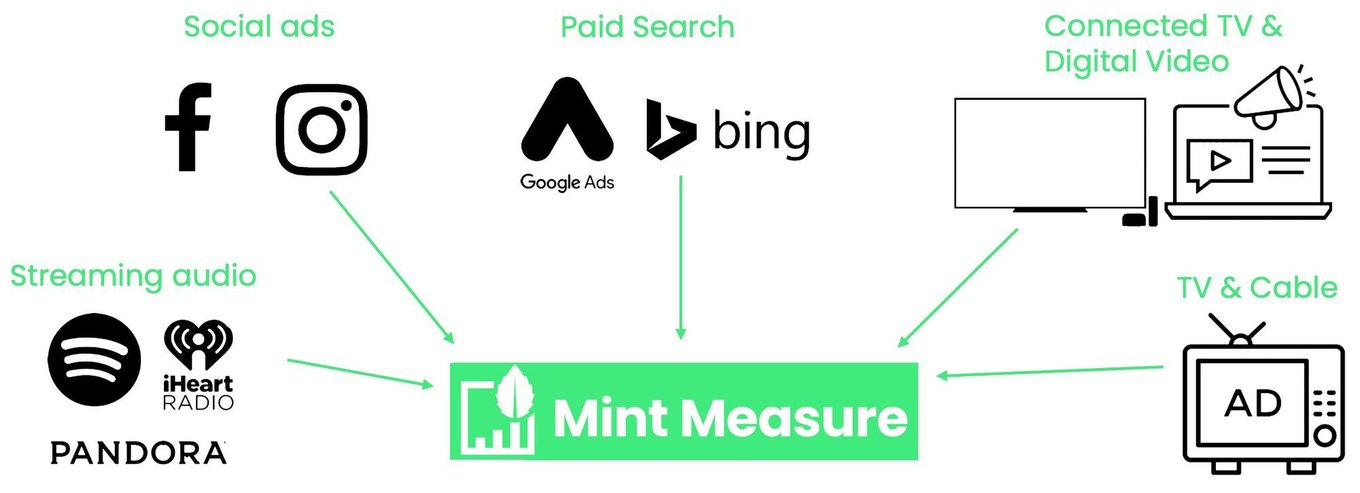
Mint Measure's tech is placed in each ad platform for a brand, and we monitor ad delivery and actions taken by users.
This data is cleaned and transformed into easy-to-read charts. Insights give context, and recommendations are provided for the client to take action.
Mint Measure’s unfair advantage edit edit source
We created a new way to process data to deliver 80% of the value of the enterprise solutions at 20% of the cost.
Our unique methodology quantifies what's working and where marketers should allocate ad budgets to drive growth with these proprietary metrics:
- Incremental reach
- iCPM - cost of incremental reach
- Incremental conversions
- iCPA - cost per incremental conversion
Traction edit edit source
By the numbers edit edit source
Revenue edit edit source
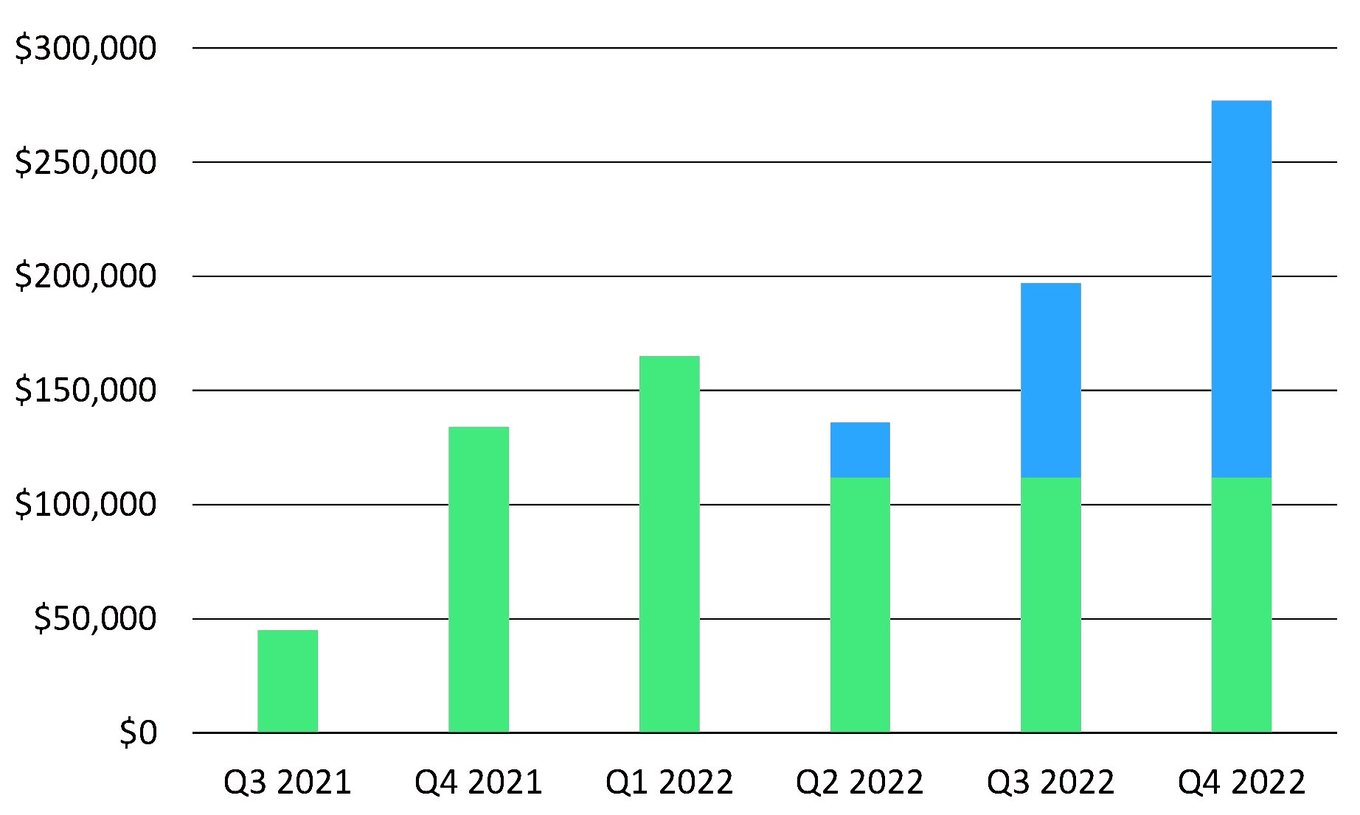
- 2020 revenue - $47,500
- 2021 revenue - $321,000
- 2022 bookings - $506,000 (+53% YoY)
- $149K ARR + $357K Pay-per-use
Customers edit edit source
- 4 active clients
- Q4 2021 closed 2 new deals
- Q2 2022 forecast – 4 new deals ($10k MRR)
- 4 proposals out for approval; strong sales pipeline
Where we are today edit edit source
Core Analytics Platform edit edit source
Serving clients for ~18 months
- $930K lifetime revenue
- $506K booked so far for 2022
Repackage products edit edit source
- Parsed analytics into 3 SaaS products to align with client needs and stages of growth
- Launched new SaaS website in February, with ability for customer to purchase online
Data Sales edit edit source
- Upsold a current client to begin using audience data
- 3 upcoming pilot campaigns with brands for data sales
Staff & Growth edit edit source
Hired first 2 staff
- Sales Rep; has been 1st sales rep 3x
- Lead Engineer
Partnerships edit edit source
- Developing long term partnership with High There/CannaGrowth platform to serve as their dedicated analytics provider
- Expanding relationships with ad agencies to gain client referrals
Customers edit edit source
Customer segments edit edit source
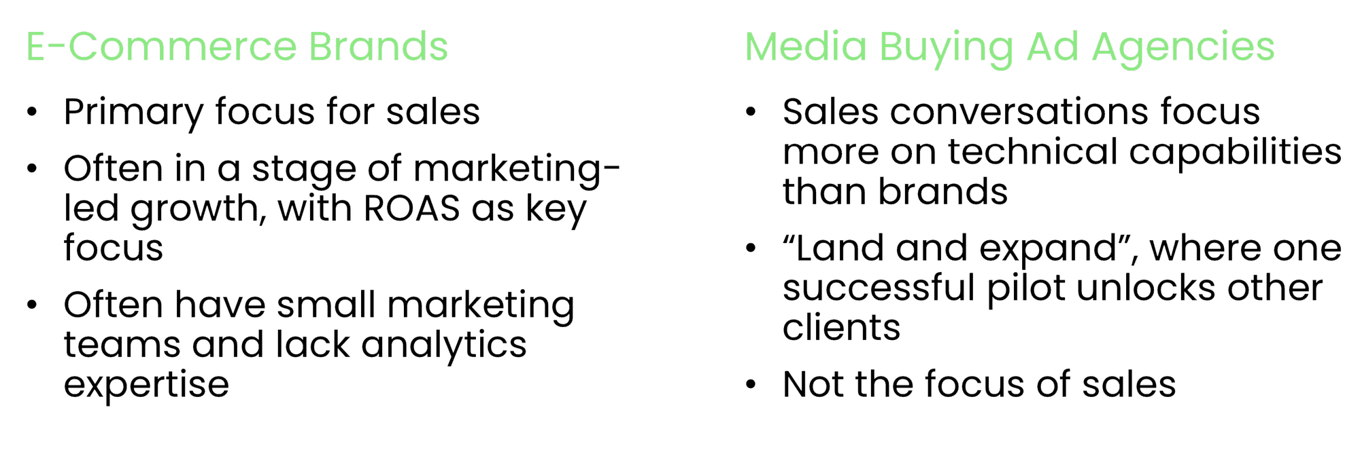
We service brands spending $400k–$30M per year on advertising. edit edit source
Facts about attribution edit edit source
- 70% say cost justification is a challenge
- 78% of marketers plan to adapt of increase their use of cross channel attribution
- Only 39% of companies are carrying out attribution on ‘all or most’ of their marketing activities (Source: econsultancy)
- 70% of businesses are now struggling to act on the insights they gain from attribution (Source: AdRoll)
- 42% of marketers report attribution manually using spreadsheets (Source: econsultancy)
- 53.3% say a minimal understanding is the main challenge of effective marketing attribution (Source: Ruler Analytics)
Business model edit edit source
Monthly fee and pay-per-use options edit edit source
Option 1: Monthly Fee (SaaS) edit edit source
- 3 tiers of product
- $699 ($500K ad spend)
- $1,249 ($1M ad spend)
- $2,499 ($2M+ ad spend)
- Currently our GTM for 2022
Option 2: Pay-Per-Use edit edit source
- For ad agencies only
- Rates range from $0.50-$1.00 CPM
- Yields 30% increased profit
Market edit edit source
Attribution companies intersect: edit edit source
Analytics + digital identity + data sales edit edit source
- Nielsen – $6B Revenue
- Neustar – $575M Revenue
- LiveRamp – $443M Revenue
Companies that offer all 3 earn 20–50x higher revenues than single-service companies
- 18 month SOM* - $2M ARR
- 6 year SOM* - $92M ARR
*SOM is project growth
Competition edit edit source
Competitive landscape edit edit source
Vision and strategy edit edit source
What we'll achieve with your investment edit edit source
Core Analytics (SaaS) edit edit source
- Finalize product market fit; repeatable sales processes
- Add $750K ARR in 12 months
- Incorporate client feedback to improve platform usability
- Continue automating workflows and scale prep
Data Sales & Identity edit edit source
- Build pipes & automate data workflows for data sales
- Create integrations into top 5 DSPs
- Add $150k in data sales revenue
Use of Funds edit edit source
Team Marketing edit edit source
- Biz Dev & Account Executives (23%)
- Data engineer (22%)
- Data Analyst (11%)
Capx edit edit source
- Databricks & Azure (7%)
- ID5 & Experian (4%)
Marketing edit edit source
- SEO & paid search (7%)
- Content marketing (5%)
- Industry conferences (3%)
Other edit edit source
- Legal (2%)
- Office supplies (1%)
- Discretionary (15%)
Funding edit edit source
- Joe Zawadzki - Former CEO & Co-Founder at MediaMath, GP at Aperiam Ventures (https://www.linkedin.com/in/jzawadzki/)
- Erich Wasserman - Co-Founder at MediaMath & Rigor (https://www.linkedin.com/in/erichwasserman/)
- Andy Kemp - Managing Partner at KORTX (https://www.linkedin.com/in/kemperdrew/)
- Erik Stubenvoll - Managing Director at KORTX (https://www.linkedin.com/in/erik-stubenvoll/)
Founders edit edit source
Scott Konopasek
CEO / Platform Creator
11 years in Adtech
- Built Mint to solve the pain points he experienced
- Performance marketer & analytics expert
- Track record driving double-digit growth for clients
- Process-driven thinker
Alex Netelkos
CPO / Product, Data, and Analytics
7 years in AdTech
- Analytics Lead at DSP MediaMath for clients Walmart, Home Depot and Proctor & Gamble
- Led creation of MediaMath’s SOURCE Reporting Dashboard
- Experience in analytics, client services and product development
Mint Measure Team edit edit source
Scott Konopasek
Founder
Alex Netelkos
Head of Product & Analytics
Keoni Murray
Lead Engineer
Brandon Beck
Business Development Representative
