Amazon.com, Inc.: Difference between revisions
Tag: Manual revert |
(formatting mostly) |
||
| Line 88: | Line 88: | ||
[[File:Us_e_commerce_market.png]] | [[File:Us_e_commerce_market.png]] | ||
| Line 138: | Line 116: | ||
[[File:Smart_speaker_market.png]] | [[File:Smart_speaker_market.png]] | ||
| Line 162: | Line 124: | ||
[[File:Stats1.png]] | [[File:Stats1.png]] | ||
| Line 177: | Line 130: | ||
[[File:Stats2.png]] | [[File:Stats2.png]] | ||
| Line 191: | Line 136: | ||
[[File:Stats3.png]] | [[File:Stats3.png]] | ||
| Line 256: | Line 179: | ||
[[File:Car1.png]] | [[File:Car1.png]] | ||
[[File:Car2.png]] | [[File:Car2.png]] | ||
'''Project Kuiper and sattelite network''' | '''Project Kuiper and sattelite network''' | ||
| Line 338: | Line 215: | ||
|} | |} | ||
[[File:11.png]] | [[File:11.png]] | ||
| Line 360: | Line 220: | ||
[[File:333.png]] | [[File:333.png]] | ||
| Line 386: | Line 225: | ||
[[File:Image12.png]] | [[File:Image12.png]] | ||
| Line 412: | Line 230: | ||
[[File:Image3333.png]] | [[File:Image3333.png]] | ||
| Line 863: | Line 661: | ||
|} | |} | ||
[[File:NetProfitForecacst.png]] | [[File:NetProfitForecacst.png]] | ||
Revision as of 18:32, 6 July 2023
Summary
Amazon.com, Inc. engages in the retail sale of consumer products and subscriptions in North America and internationally. The company operates through three segments: North America, International, and Amazon Web Services (AWS). It sells merchandise and content purchased for resale from third-party sellers through physical and online stores. The company also manufactures and sells electronic devices, including Kindle, Fire tablets, Fire TVs, Rings, and Echo and other devices; provides Kindle Direct Publishing, an online service that allows independent authors and publishers to make their books available in the Kindle Store; and develops and produces media content. In addition, it offers programs that enable sellers to sell their products on its websites, as well as its stores; and programs that allow authors, musicians, filmmakers, Twitch streamers, skill and app developers, and others to publish and sell content. Further, the company provides compute, storage, database, analytics, machine learning, and other services, as well as fulfillment, advertising, publishing, and digital content subscriptions. Additionally, it offers Amazon Prime, a membership program, which provides free shipping of various items; access to streaming of movies and series; and other services. The company serves consumers, sellers, developers, enterprises, and content creators. Amazon.com, Inc. was incorporated in 1994 and is headquartered in Seattle, Washington.
Segments covered by Amazon
E-Commerce:
Amazon is one of the world's largest online marketplaces, selling a vast array of products, including electronics, books, apparel, household items, and more.
Cloud Computing services:
Amazon provides several cloud computing services to businesses and individuals, via its platform called Amazon Web Services (AWS) and it provides the following:
a. Infrastructure as a service (IaaS): access to virtual servers, storage and networking withouth the need for a physical hardware
b. Platform as a service (PaaS): ability to create applications using pre made platform templates
c. Software as a service (SaaS); ability to use certain applications without buying them
Digital Content:
Amazon offers a variety of digital content platforms such as
a. Amazon Prime Video for streaming movies and TV shows
b. Amazon Music for streaming music
c. Kindle for e-books.
Logistics and Delivery:
a. Amazon has developed an extensive logistics and delivery network to fulfil orders efficiently, including its own delivery service called Amazon Logistics.
Smart Home Devices:
a. Amazon has introduced various smart home devices under the Amazon Echo brand, powered by the virtual assistant Alexa. These include smart speakers, smart displays, and smart home automation devices.
Grocery and Food Delivery:
a. Through Amazon Fresh, Whole Foods Market (acquired by Amazon in 2017), and Amazon Prime Now, the company provides grocery and food delivery services. Amazon Prime Now, will stop existing and the fast delivery service will be combined with the third party partners
Healthcare:
a. Amazon has expanded into the healthcare sector with initiatives such as Amazon Pharmacy, offering prescription medication delivery, and Amazon Care, a virtual healthcare service for employees.
Entertainment and Media:
a. Amazon Studios produces and distributes original movies and TV shows through Amazon Prime Video. The company has also ventured into sports broadcasting, streaming live sports events.
Advertising:
a. Amazon has a growing advertising business, offering advertising solutions for brands to reach customers on its platforms through Amazon Advertising.
Hardware and Consumer Electronics:
a. In addition to its smart home devices, Amazon manufactures and sells hardware products like Fire tablets, Kindle e-readers, and Fire TV streaming devices.
Other include:
a. Robotics (amazon scout etc), space exploration (blue origin), AI and machine learning
The previous section showcases Amazon’s breakdown of revenue and the most important segments to Amazon from the perspective of revenues are: e-commerce, third party seller services, AWS and subscription services. Below figures will illustrate the market share of Amazon in some of those segments.
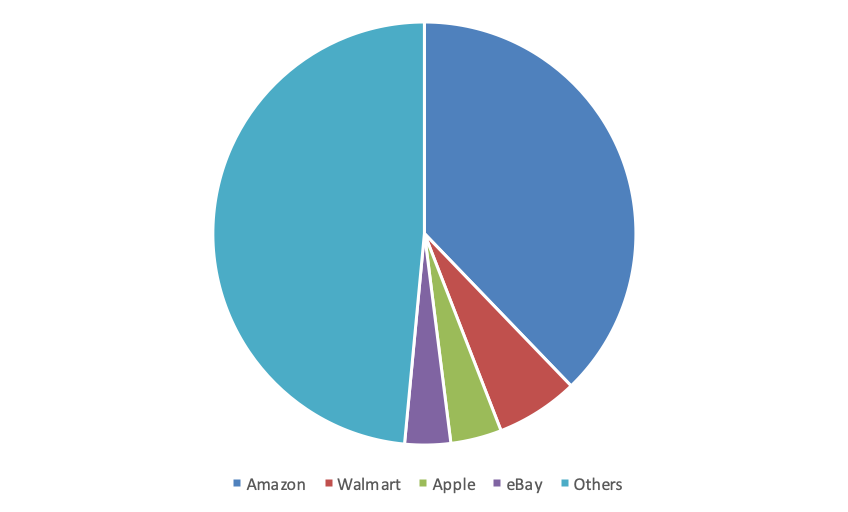
US e-commerce market share (June 2022)
The US e-commerce is clearly dominated by Amazon followed by Walmart, Apple and eBay. Other players hold maximum of 2% of the market. Some related statistics about Amazon are as follows:
The US e-commerce is clearly dominated by Amazon followed by Walmart, Apple and eBay. Other players hold maximum of 2% of the market. Some related statistics about Amazon are as follows:
| 2021 e-commerce Amazon revenue | USD 220 billion |
| Number of active sellers (2022) | 9.7 million |
| Number of shipments in 2021 | 7.7 billion |
| Global number of users (2022) | 310 million |
| Number of fulfilment centres (2023) | 185 |
| Total area of fulfilment centres (2019) | 150 mln sq ft |
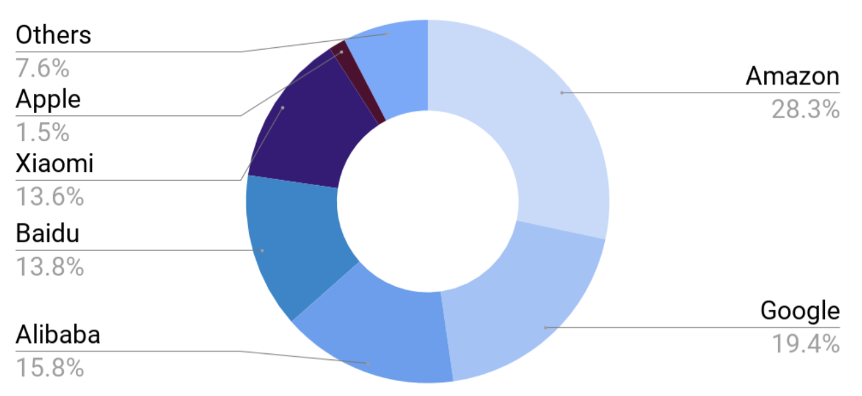
Smart speaker market share (2020)
Similarly, to e-commerce, Amazon dominates the market of smart speakers with the help of Alexa
In general, the most demanded products from Amazon can be shown in the below diagram. Amazon is most popular with electronics goods followed by clothing with shoes and then home and furniture. The least frequent orders are pet supplies.
Popularity of Amazon’s as an e-commerce does not end here. Amazon is also the place where more than half of online purchasers start their search.
Cloud computing market
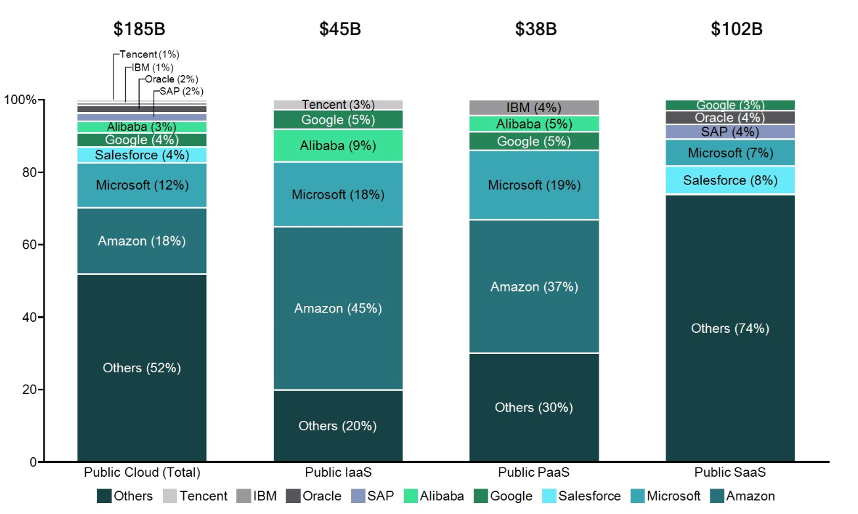
In 2019, Amazon outperformed its major competitors across the entire cloud computing market with a total market share of 18%. Out of the cloud computing, Amazon is most popular among Infrastructure as a service segment with a eye watering 45% of market share. In q1 2022, AWS is still the preferred provider of cloud computing services with Azure (cloud computing provided by Microsoft) catching up but still below.
Some of the cloud computing market trends that AWS could take advantage of are:
- The cloud becomes more popular with SMEs
- Businesses look towards multi-cloud solutions
- The cloud gaming market is expanding
Overall, the competition for Amazon across its key segments can be summarised in the below table:
| Segment of competition | Main competitors |
|---|---|
| E-commerce | Apple, Walmart, eBay, Homedepot, Costco, Shopify |
| Cloud Computing | Microsoft, Google, Sales Force, Alibaba, several other chinese competitors |
| Digital content | Netflix, Spotify, Apple, |
| Smart home appliances | Alibaba, Xiaomi, Google, Baidu, Apple, Echo dot |
On-going and future Amazon projects
Renewable energy
In septemebr 2022, Amazon announced that it will help tackle the global warming and will contribute to making the planet more green. With that Amazon announced new 379 renewable energy projects across the globe, where it plans to construct solar and wind panels. The aim is to supply 4.6 million houses with renewable energy while also making sure that the business is 100% renewable energy dependent ie all the business units of Amazon will solely use its own renewable energy. Poland and france were planned to host the first projects, and in October 2022, a spanish renewables investment platform Q-Energy last closed financing for a solar farm in Poland that will generate electricity for Amazon. Similarly, in 2022, Israeli flexible solar module manufacturer Apollo Power announced it will provide its products Amazon to build at one of its facilities in France.
In 2019, Amazon co-founded The Climate Pledge, further showing its commitment to net-zero carbon world. It aims to reach this status by 2040—10 years ahead of the Paris Agreement.
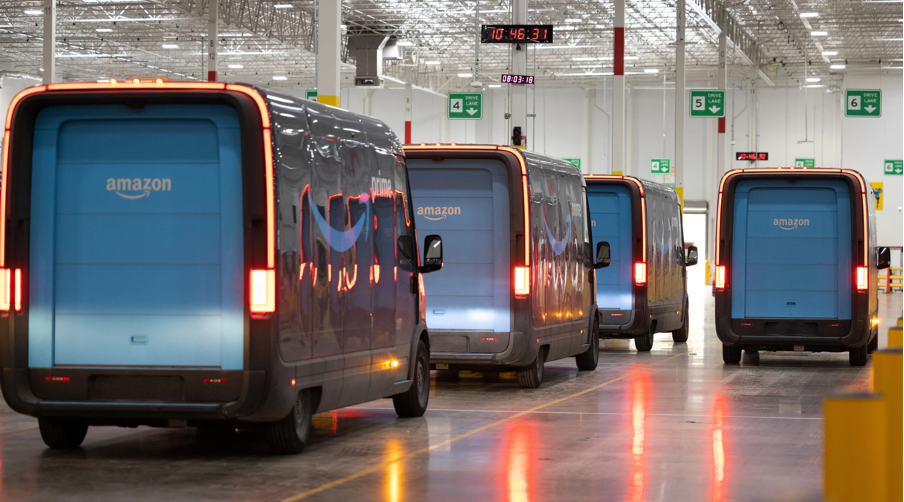
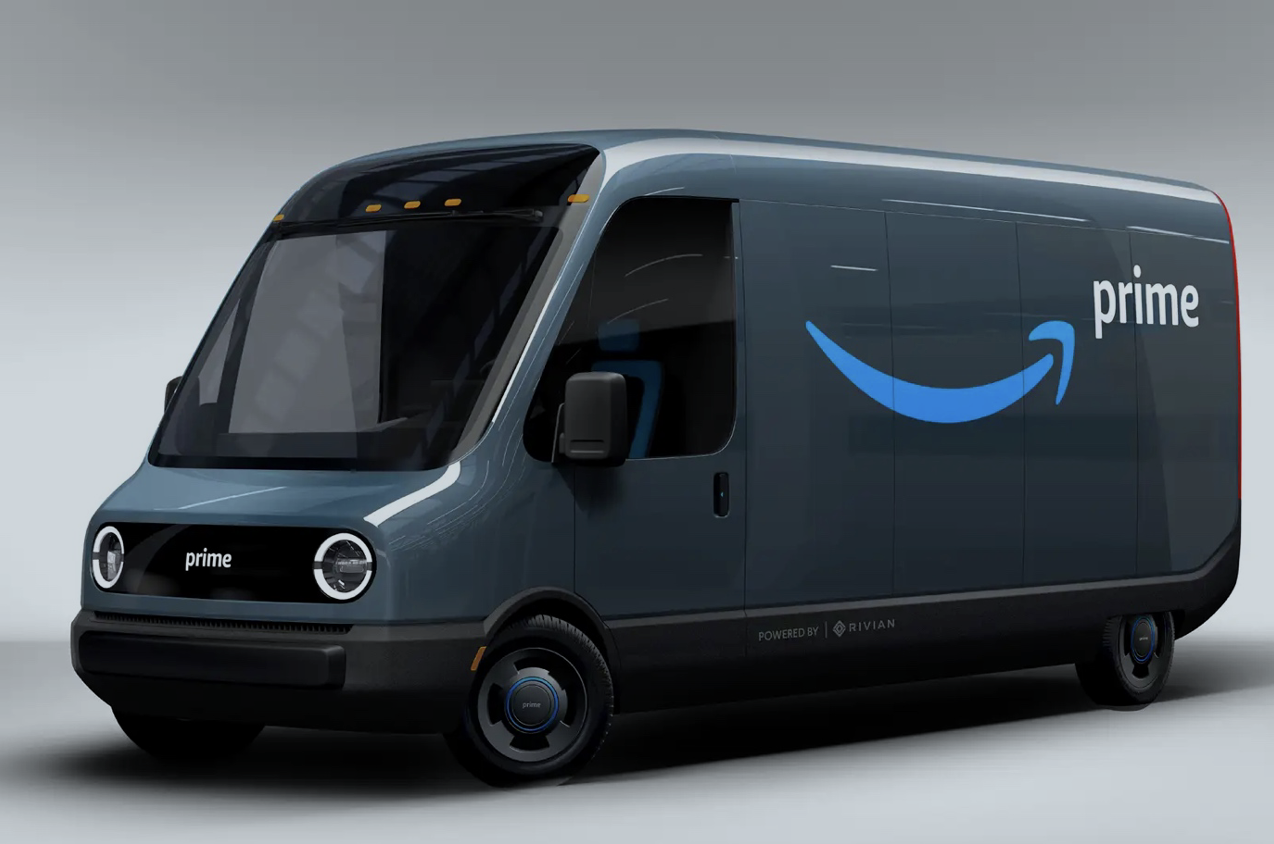
The Pledge has now over 375 signatories, including IBM, Microsoft, PepsiCo, Siemens, Unilever, Verizon, and Visa. However, it does not stop ther. Amazon partnered with Rivian (EV company) and ordered over 100,000 (to be on streers by 2030) electric vehicles to be doing carbon free delivery, 3,000 of which are already in the streets!
Project Kuiper and sattelite network
Project Kuiper is yet another act of Amazon on the way of completely changing the world. Amazon identified a problem where traditional antennas can be expensive, hard and heavy to construct, making it difficult for certain regions in the world to access broadband or mobile network. Amazon’s Project Kuiper is a solution to this problem. The project is a satellite network which will help people access broadband and internet. The way it works is that a household purchases one of the antennas, referred to as “customer terminal” (which is cheaper, lighter and easier to install) from the below pictures and connects it to the satellites above (in the sky).
Below table will shows the comparison between three customer terminals.
| Customer terminal type: | Cost of installation: | Speed of terminal | Size | Weight |
| Medium sized terminal aimed at residential and small buiness customers | $400 | 400 megabits per second (Mbps) | Less than 11 inches square and 1 inch thick | Less than 5 pounds |
| Ultra compact terminal aimed for a personal use. Light and transportable | NA | 100 megabits per second (Mbps) | 7 square inches | 1 pound |
| A high-bandwidth design for the most demanding needs | NA but aimed at governments, telecoms and enterprises | 1 gigabit per second (Gbps) | 19 inches by 30 inches | NA |
Terminals for residential and small business customers
Ultra compact terminal
A high-bandwidth design for the most demanding needs
Amazon industrial innovation fund
In april of 2022, Amazon committed to create a USD 1 billion “venture capital” like platform called Amazon industrial innovation fund. The aim of such fund is to ultimately improve its operations, logistics, speed of parcel deliveries and simply take Amazon to a new level. The “fund” will invest in companies (not owned by Amazon) that incrementally enhance delivery speed and further improve the experience of employees working in warehousing and logistics fields.
The first round of investments of the round involves tech and safety wearing ventures which are summarised below:
| Investee | Main offerings | Website |
|---|---|---|
| Modjoul | Wearable safety technology, personalised ads and safety signals | https://modjoul.com |
| Vimaan | Computer vision and artificial intelligence solutions to improve inventory management | https://vimaan.ai |
| Agility Robotics | Bi-pedal walking robot | https://agilityrobotics.com |
| BionicHIVE | Autonomous robotic solution facilitating with shelving racks and boxes in warehouses | https://www.bionichive.com |
| Mantis Robotics | Tactile robotic arm that uses sensor technology to cohesively work alongside people | https://www.mantis-robotics.com |
Organisational Structure
Beneficial owners
As of the 2023 Proxy Statement[1], sole voting and investment power is granted to individuals who serve as directors and/or executive officers, the directors and executive officers as a group, and individuals and organisations that own 5% or more of the total common stock. The beneficial owners list was released as following:
| Beneficial owner | Share stake |
|---|---|
| Jeffrey P. Bezos | 12.3% |
| The Vanguard Group, Inc. | 6.9% |
| BlackRock, Inc. | 5.8% |
| Andrew R. Jassy | 0.02% |
| Keith B. Alexander | <0.01% |
| Edith W. Cooper | <0.01% |
| Jamie S. Gorelick | <0.01% |
| Daniel P. Huttenlocher | <0.01% |
| Judith A. McGrath | <0.01% |
| Indra K. Nooyi | <0.01% |
| Jonathan J. Rubinstein | <0.01% |
| Patricia Q. Stonesifer | <0.01% |
| Wendell P. Weeks | <0.01% |
| Brian T. Olsavsky | <0.01% |
| Douglas J. Herrington | <0.01% |
| Adam N. Selipsky | <0.01% |
| David A. Zapolsky | <0.01% |
| All directors and executive officers as a group (16 persons) | 12.3% |
Other major stockholders[2]
| Stockholders | Share stake |
|---|---|
| SSgA Funds Management, Inc. | 3.24% |
| Fidelity Management & Research Co... | 2.47% |
| T. Rowe Price Associates, Inc. (I... | 1.85% |
| Geode Capital Management LLC | 1.61% |
| Norges Bank Investment Management | 0.96% |
| Capital Research & Management Co.... | 0.92% |
Financials
Historic
Most recent quarter
During the three month period ending on 31st March 2023 Amazon Inc achieved revenues of $127.36 billion, showing a 14,64% decrease to the last quarter of 2022. Despite that, it achieved a net income of $3.17 billion, marking an impressive increase to the previous quarter, when a $278 million net income was reported. A significant cut to operating expenses was observed, that resulted to the operating margin increasing from 1.83% to 3.75%.
Most recent year
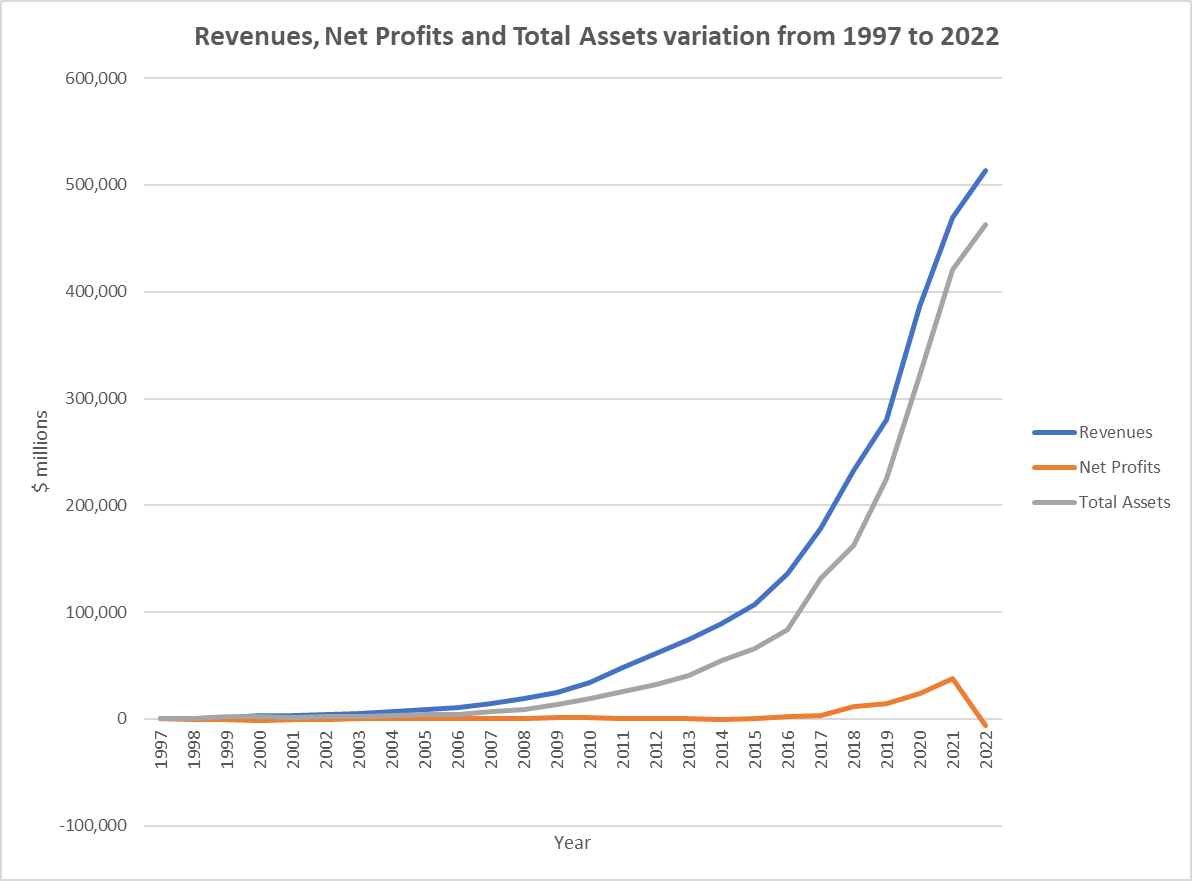
In the end of the fiscal year of 2022 Amazon, Inc reported a loss of $5.94 billion. The revenue and total assets experienced an slight increase compared to 2021, interrupting the exponential increase trend observed in the previous years. A 23.35% increase in operating expenses can partially account for the loss, as it outweighs the 14% increase in gross profit, resulting in a lower operating income. The increase in expenses can be linked to the Rivian Automotive (RIVN) investment that Amazon originally made in 2019. The company went public in 2021, and lost 75% of its value during the next year, therefore not returning the expected turnovers.
All periods[3]
| Year | Year end date | Income Statement | Balance Sheet | Employees | |
|---|---|---|---|---|---|
| Revenues($million) | Net profits ($million) | Total Assets($million) | |||
| 1 | 31/12/1997 | $148 | -$31 | $149 | 614 |
| 2 | 31/12/1998 | $610 | -$125 | $648 | 2,100 |
| 3 | 31/12/1999 | $1,640 | -$720 | $2,466 | 7,600 |
| 4 | 31/12/2000 | $2,762 | -$1,411 | $2,135 | 9,000 |
| 5 | 31/12/2001 | $3,122 | -$567 | $1,638 | 7,800 |
| 6 | 31/12/2002 | $3,933 | -$149 | $1,990 | 7,500 |
| 7 | 31/12/2003 | $5,264 | $35 | $2,162 | 7,800 |
| 8 | 31/12/2004 | $6,921 | $588 | $3,248 | 9,000 |
| 9 | 31/12/2005 | $8,490 | $359 | $3,696 | 12,000 |
| 10 | 31/12/2006 | $10,711 | $190 | $4,363 | 13,900 |
| 11 | 31/12/2007 | $14,835 | $476 | $6,485 | 17,000 |
| 12 | 31/12/2008 | $19,166 | $645 | $8,314 | 20,700 |
| 13 | 31/12/2009 | $24,509 | $902 | $13,813 | 24,300 |
| 14 | 31/12/2010 | $34,204 | $1,152 | $18,797 | 33,700 |
| 15 | 31/12/2011 | $48,077 | $631 | $25,278 | 56,200 |
| 16 | 31/12/2012 | $61,093 | -$39 | $32,555 | 88,400 |
| 17 | 31/12/2013 | $74,452 | $274 | $40,159 | 117,300 |
| 18 | 31/12/2014 | $88,988 | -$241 | $54,505 | 154,100 |
| 19 | 31/12/2015 | $107,006 | $596 | $65,444 | 230,800 |
| 20 | 31/12/2016 | $135,987 | $2,371 | $83,402 | 341,400 |
| 21 | 31/12/2017 | $177,866 | $3,033 | $131,310 | 566,000 |
| 22 | 31/12/2018 | $232,887 | $11,261 | $162,648 | 647,500 |
| 23 | 31/12/2019 | $280,522 | $13,976 | $225,248 | 822,500 |
| 24 | 31/12/2020 | $386,064 | $24,178 | $321,195 | 1,298,000 |
| 25 | 31/12/2021 | $469,822 | $38,151 | $420,549 | 1,608,000 |
| 26 | 31/12/2022 | $513,983 | -$5,936 | $462,675 | 1,541,000 |
Forward
Method
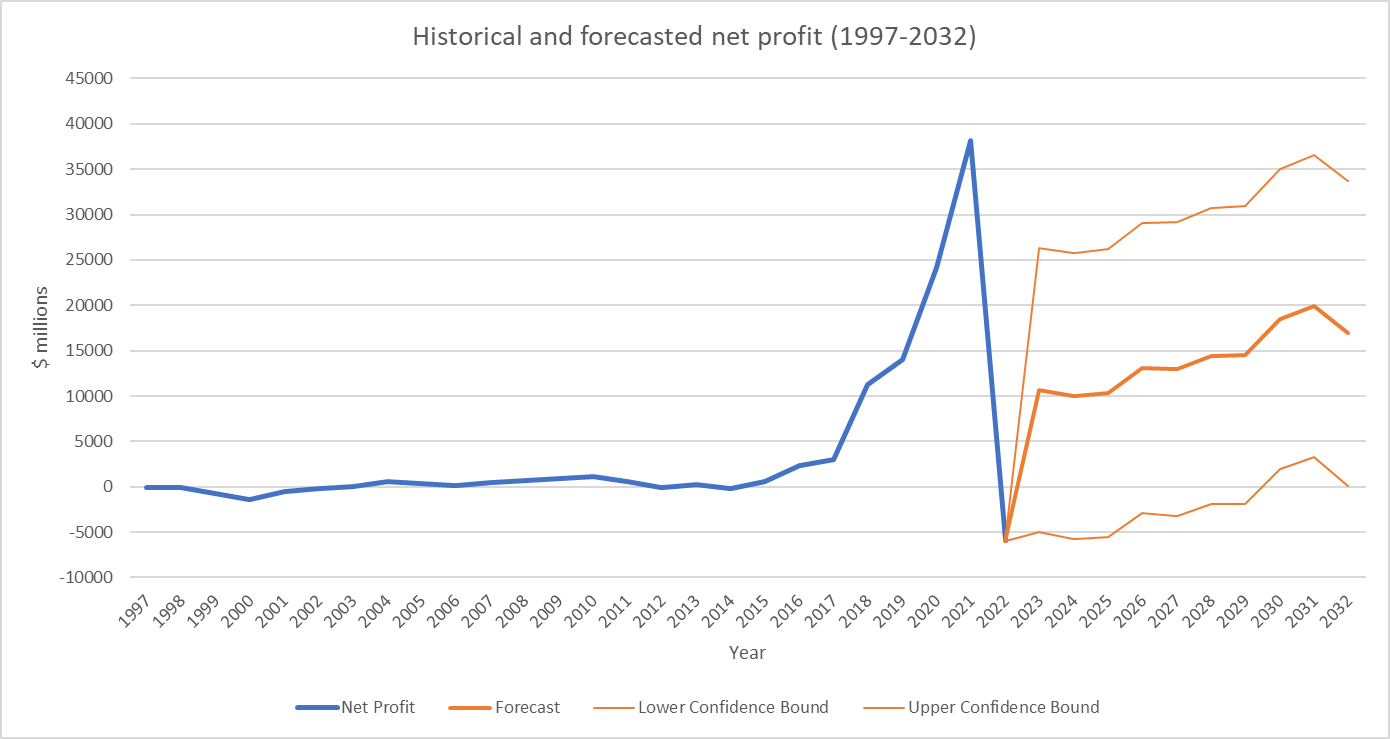
To evaluate the forecasted revenue and net profit values, the function "FORECAST.EST()" was used in Microsoft Excel. The inputs were the historical values, the timeline corresponding to those values (1997-2022), the target date (2032), and seasonality, which was set to 12. Excel uses the method of linear regression, which bases the future values of the historical trends. A forecast for the next 10 years is provided, as a more in-depth analysis is required to accurately predict the financials across the entire lifetime of the company.
Financial Forecasts
| Year | Revenue ($millions) | Net Profit ($millions) | ||||
|---|---|---|---|---|---|---|
| Forecast | Lower-bound value | Upper-bound value | Forecast | Lower-bound value | Upper-bound value | |
| 2023 | 316,184 | 129,953 | 502,415 | 10651.307 | -4995.60 | 26298.21 |
| 2024 | 329,583 | 141,856 | 517,310 | 10001.486 | -5771.10 | 25774.07 |
| 2025 | 343,325 | 154,090 | 532,559 | 10335.191 | -5564.04 | 26234.43 |
| 2026 | 405,810 | 215,056 | 596,563 | 13082.175 | -2944.67 | 29109.02 |
| 2027 | 410,113 | 217,829 | 602,396 | 12965.08 | -3190.33 | 29120.49 |
| 2028 | 419,340 | 225,515 | 613,165 | 14423.065 | -1861.86 | 30707.99 |
| 2029 | 438,952 | 243,575 | 634,330 | 14562.07 | -1853.31 | 30977.45 |
| 2030 | 465,707 | 268,765 | 662,648 | 18514.424 | 1967.66 | 35061.19 |
| 2031 | 489,988 | 291,472 | 688,504 | 19926.654 | 3247.58 | 36605.73 |
| 2032 | 458,247 | 258,146 | 658,349 | 16926.32 | 114.02 | 33738.62 |
Appendix
Financial Statements
| Year end date | 31/12/2022 | 31/12/2021 | 31/12/2020 | 31/12/2019 | 31/12/2018 |
|---|---|---|---|---|---|
| Current Assets | |||||
| Cash and Cash Equivalents ($million) | $53,888 | $36,220 | $42,122 | $36,092 | $31,750 |
| Marketable securities ($million) | $16,138 | $59,829 | $42,274 | $18,929 | $9,500 |
| Inventory ($million) | $34,405 | $32,640 | $23,795 | $20,497 | $17,174 |
| Net Receivables ($million) | $42,360 | $32,891 | $24,542 | $20,816 | $16,677 |
| Total Current Assets ($million) | $146,791 | $161,580 | $132,733 | $96,334 | $75,101 |
| Long-Term Assets | |||||
| Net Property and equipment ($million) | $186,715 | $160,281 | $113,114 | $72,705 | $61,797 |
| Operating leases ($million) | $66,123 | $56,082 | $37,553 | $25,141 | -- |
| Goodwill ($million) | $20,288 | $15,371 | $15,017 | $14,754 | $14,548 |
| Other Assets ($million) | $42,758 | $27,235 | $22,778 | $16,314 | $11,202 |
| Total Assets ($million) | $462,675 | $420,549 | $321,195 | $225,248 | $162,648 |
| Current Liabilities | |||||
| Accounts Payable ($million) | $79,600 | $78,664 | $72,529 | $47,183 | $38,192 |
| Accrued expenses and other ($million) | $62,566 | $51,775 | $44,138 | $32,439 | $23,663 |
| Unearned revenue ($million) | $13,227 | $11,827 | $9,708 | $8,190 | $6,536 |
| Total Current Liabilities ($million) | $155,393 | $142,266 | $126,385 | $87,812 | $68,391 |
| Long-Term lease liabilities ($million) | $72,968 | $67,651 | $52,573 | $39,791 | $9,650 |
| Long-Term Debt ($million) | $67,150 | $48,744 | $31,816 | $23,414 | $23,495 |
| Other Liabilities ($million) | $21,121 | $23,643 | $17,017 | $12,171 | $17,563 |
| Total Liabilities ($million) | $316,632 | $282,304 | $227,791 | $163,188 | $119,099 |
| Stock Holders Equity | |||||
| Common Stocks ($million) | $108 | $106 | $5 | $5 | $5 |
| Capital Surplus ($million) | $75,066 | $55,437 | $42,865 | $33,658 | $26,791 |
| Retained Earnings | $83,193 | $85,915 | $52,551 | $31,220 | $19,625 |
| Treasury Stock ($million) | -$7,837 | -$1,837 | -$1,837 | -$1,837 | -$1,837 |
| Other Equity ($million) | -$4,487 | -$1,376 | -$180 | -$986 | -$1,035 |
| Total Equity ($million) | $146,043 | $138,245 | $93,404 | $62,060 | $43,549 |
| Total Liabilities & Equity ($million) | $462,675 | $420,549 | $321,195 | $225,248 | $162,648 |
| Year end date | 31/12/2022 | 31/12/2021 | 31/12/2020 | 31/12/2019 | 31/12/2018 |
|---|---|---|---|---|---|
| Net Income ($million) | -$2,722 | $33,364 | $21,331 | $11,588 | $10,073 |
| Cash Flows-Operating Activities | |||||
| Depreciation ($million) | $41,921 | $34,433 | $25,180 | $21,789 | $15,341 |
| Net Income Adjustments ($million) | $28,439 | -$1,859 | $6,072 | $7,575 | $6,352 |
| Changes in Operating Activities | |||||
| Changes in Inventories ($million) | -$2,592 | -$9,487 | -$2,849 | -$3,278 | -$1,314 |
| Accounts Receivable ($million) | -$21,897 | -$18,163 | -$8,169 | -$7,681 | -$4,615 |
| Accounts Payable ($million) | $2,945 | $3,602 | $17,480 | $8,193 | $3,263 |
| Other Operating Activities ($million) | $658 | $4,437 | $7,019 | $328 | $1,623 |
| Net Cash Flow-Operating ($million) | $46,752 | $46,327 | $66,064 | $38,514 | $30,723 |
| Cash Flows-Investing Activities | |||||
| Capital Expenditures ($million) | -$58,321 | -$55,396 | -$35,044 | -$12,689 | -$11,323 |
| Investments ($million) | -$2,565 | -$60,157 | -$72,479 | -$31,812 | -$7,100 |
| Other Investing Activities ($million) | $23,285 | $57,399 | $47,912 | $20,220 | $6,054 |
| Net Cash Flows-Investing ($million) | -$37,601 | -$58,154 | -$59,611 | -$24,281 | -$12,369 |
| Cash Flows-Financing Activities | |||||
| Proceeds from short-term debt ($million) | $41,553 | $7,956 | $6,796 | $1,402 | $886 |
| Repayments of short-term debt ($million) | -$37,554 | -$7,753 | -$6,177 | -$1,518 | -$813 |
| Proceeds from long-term debt ($million) | $21,166 | $19,003 | $10,525 | $871 | $182 |
| Repayments of long-term debt ($million) | -$1,258 | -$1,590 | -$1,553 | -$1,166 | -$155 |
| Other financing activities ($million) | -$8,189 | -$11,325 | -$10,695 | -$9,655 | -$7,786 |
| Net Cash Flows-Financing ($million) | $9,718 | $6,291 | -$1,104 | -$10,066 | -$7,686 |
| Effect of Exchange Rate ($million) | -$351 | $70 | $618 | -$364 | -$1,093 |
| Net Cash Flow ($million) | $17,776 | -$5,900 | $5,967 | $4,237 | $10,317 |
| Year end date | 31/12/2022 | 31/12/2021 | 31/12/2020 | 31/12/2019 | 31/12/2018 |
|---|---|---|---|---|---|
| Total Revenue ($million) | $513,983 | $469,822 | $386,064 | $280,522 | $232,887 |
| Cost of Revenue ($million) | $288,831 | $272,344 | $233,307 | $165,536 | $139,156 |
| Gross Profit ($million) | $225,152 | $197,478 | $152,757 | $114,986 | $93,731 |
| Operating Expenses | |||||
| Fulfillment ($million) | $84,299 | $75,111 | $58,517 | $40,232 | $34,027 |
| Technology and content ($million) | $73,213 | $56,052 | $42,740 | $35,931 | $28,837 |
| Sales, General and admin. ($million) | $54,129 | $41,372 | $28,676 | $24,081 | $18,150 |
| Other Operating Items ($million) | $1,263 | $62 | -$75 | $201 | $296 |
| Operating Income | $12,248 | $24,879 | $22,899 | $14,541 | $12,421 |
| Interest income and other | -$15817 | $15081 | $2926 | $1035 | $257 |
| Earnings Before Interest and Tax | -$3,569 | $39,960 | $25,825 | $15,576 | $12,678 |
| Interest Expense | -$2,367 | -$1,809 | -$1,647 | -$1,600 | -$1,417 |
| Earnings Before Tax | -$5,936 | $38,151 | $24,178 | $13,976 | $11,261 |
| Net Income Tax | $3,214 | -$4,787 | -$2,847 | -$2,388 | -$1,188 |
| Net Income | -$2,722 | $33,364 | $21,331 | $11,588 | $10,073 |
| Net Income Applicable to Common Shareholders | -$2,722 | $33,364 | $21,331 | $11,588 | $10,073 |
| Year end date | 31/12/2022 | 31/12/2021 | 31/12/2020 | 31/12/2019 | 31/12/2018 |
|---|---|---|---|---|---|
| Liquidity Ratios | |||||
| Current Ratio | 94% | 114% | 105% | 110% | 110% |
| Quick Ratio | 72% | 91% | 86% | 86% | 85% |
| Cash Ratio | 35% | 25% | 33% | 41% | 46% |
| Profitability Ratios | |||||
| Gross Margin | 44% | 42% | 40% | 41% | 40% |
| Operating Margin | 2% | 5% | 6% | 5% | 5% |
| Pre-Tax Margin | -1% | 8% | 6% | 5% | 5% |
| Profit Margin | -1% | 7% | 6% | 4% | 4% |
| Pre-Tax ROE | -4% | 28% | 26% | 23% | 26% |
| After Tax ROE | -2% | 24% | 23% | 19% | 23% |
1. Intense Competition
Amazon has competitors across geographies and industries- retail (physical, e-commerce, omni-channel), computing services (both web and infrastructure), electronic devices, digital content, grocery etc.
2. Expansion into newer market segments
There could be a possibility of failure to recoup investments in new technologies, products, or services. This is because of the limited or no experience in these areas.
1. International Expansion
There are several factors like government restrictions/ regulations, physical and technological infrastructure, income levels, geopolitical events etc. which pose a threat to significant revenues and profits from the international market. Amazon has no first-to-market advantage in some geographies and little operating experience in others. For example, regulations in the two biggest Asian markets- India and China are quite restrictive to Amazon’s business activities. Violation of these regulations may result in heavy penalties or revocation of licences. They also face threats from more established local companies and brands.
2. Fluctuation in Demand
Variability in Amazon’s retail business because of seasonality, promotions, unforeseen economic, climate and geopolitical events place increased strain on operations. The risks related to fulfilment network optimisation and inventory are magnified during periods of high demand. This results in high fluctuations in operating results and growth rate.
3. Technological Risks (data loss, security breaches, system interruption, lack of redundancy)
Because a lot of sensitive and confidential information is collected, processed, stored and transmitted by Amazon, failure to prevent data loss, theft, and misuse could lead to litigation liability, and regulatory action, discouraging its customers and vendors to use the platform, and could harm the business reputation.
Furthermore, any event that could prevent Amazon from accepting and fulfilling customer orders and providing services, due to system interruption, delays etc. Can make its product and service offerings less attractive and subject to liability.
4. Strategic Alliances, Commercial Agreements, Supplier and other Business Relationships
Violations by suppliers or other vendors of applicable laws, regulations, contractual terms, intellectual property rights of others, or Supply Chain Standards, as well as products or practices regarded as unethical, unsafe, or hazardous, could expose Amazon to claims, damage their reputation, limit our growth, and negatively affect our operating results. A point to be noted is that there are limited or single sources of supply in some cases.
Additionally, these arrangements are complex and require substantial infrastructure capacity, personnel, and other resource commitments, which may limit the amount of business Amazon can service. They may not be able to implement, maintain, and develop the components of these commercial relationships, which creates additional risk.
References and notes
- ↑ https://s2.q4cdn.com/299287126/files/doc_financials/2023/ar/Amazon-2023-Proxy-Statement.pdf
- ↑ Amazon.com, Inc. (AMZN) Stock Major Holders - Yahoo Finance
- ↑ Amazon.com, Inc. - Annual reports, proxies and shareholder letters (aboutamazon.com)
