Amazon.com, Inc.

Amazon's mission is to be the most customer-centric company, the best employer, and the safest workplace on Earth. edit edit source
The company prioritises customer satisfaction and employee well-being, guided by principles such as customer obsession, passion for invention, operational excellence, and long-term thinking. Amazon operates in various segments, including e-commerce, cloud computing services (Amazon Web Services), digital content, logistics and delivery, smart home devices, grocery and food delivery, healthcare, entertainment and media, advertising, and consumer electronics.
The company's key revenue drivers are e-commerce retail, third-party seller services, AWS, and subscription services. Amazon dominates the e-commerce market in the US, and its smart speakers with Alexa hold a significant market share.
Amazon faces competition in different segments from players such as Walmart, Apple, Google, and Alibaba. Amazon is also involved in initiatives related to renewable energy, satellite network (Project Kuiper), industrial innovation, lending, and has a strong leadership team guiding its operations. Despite some financial challenges, Amazon continues to invest in its infrastructure, logistics capabilities, physical assets, and strategic acquisitions to maintain its market leadership and drive innovation.
The idea edit edit source
Amazon.com was founded by Jeff Bezos in 1994. The idea for the company came about when Bezos, a Princeton graduate and successful Wall Street executive, recognized the enormous potential of the Internet and e-commerce in the early 1990s.
In 1994, he came across a statistic that the Internet was growing at a rate of 2300% per year. Intrigued, Bezos left his job at D.E. Shaw, a hedge fund, and started to explore potential business ideas that could be capitalized on this boom.
Bezos made a list of 20 possible product categories to sell online, and books were on top of the list. The reasons were many - books were low cost and universally demanded. Plus, no physical bookstore could match the selection of books that an online store could offer.
After moving to Seattle, Bezos set up the business in his garage, where he and a few employees began developing the software for Amazon.com. He named his new company after the Amazon River in South America, in part because it suggested scale (Amazon River is the largest in the world), and his goal was for Amazon to become the largest bookstore in the world.
Amazon.com was officially launched in July 1995. In the beginning, it was only a bookstore. Still, Bezos had a vision for Amazon to become an "everything store". Today, Amazon sells millions of different items, and its business interests extend far beyond retail to include cloud services, digital streaming, artificial intelligence, and more.
Mission Statement edit edit source
Amazon's mission statement is:
"Our mission is to be Earth's most customer-centric company. This is what unites Amazonians across teams and geographies as we are all striving to delight our customers and make their lives easier, one innovative product, service, and idea at a time."
This statement reflects Amazon's aim to put the customer first and continuously innovate on their behalf.
Segments covered by Amazon edit edit source
E-Commerce edit edit source
Amazon operates as one of the world's most expansive online retail platforms, offering an extensive assortment of products spanning categories such as electronics, books, clothing, and household goods, among others.
Cloud Computing services edit edit source
Through its dedicated cloud computing platform, Amazon Web Services (AWS), Amazon offers a range of services to businesses and individuals, including:
- Infrastructure as a Service (IaaS): This service allows users to access virtual servers, storage, and networking capabilities, eliminating the need for physical hardware.
- Platform as a Service (PaaS): This service provides users with the ability to develop applications using pre-configured platform templates.
- Software as a Service (SaaS): This service enables users to utilize specific applications without the need for outright purchase or installation.
Digital Content edit edit source
Amazon provides an extensive array of digital content platforms tailored to cater to a range of interests:
- Amazon Prime Video: A streaming service featuring an expansive library of movies and TV shows, offering both popular hits and Amazon's original productions.
- Amazon Music: A platform catering to music enthusiasts, streaming a diverse selection of songs across various genres.
- Kindle: A dedicated platform for book lovers, delivering a vast collection of e-books spanning numerous categories, from contemporary fiction to academic texts.
Logistics and Delivery edit edit source
Amazon has developed an extensive logistics and delivery network to fulfil orders efficiently, including its own delivery service called Amazon Logistics.
Smart Home Devices edit edit source
Amazon has introduced various smart home devices under the Amazon Echo brand, powered by the virtual assistant Alexa. These include smart speakers, smart displays, and smart home automation devices.
Grocery and Food Delivery edit edit source
Through Amazon Fresh, Whole Foods Market (acquired by Amazon in 2017), and Amazon Prime Now, the company provides grocery and food delivery services. Amazon Prime Now, will stop existing and the fast delivery service will be combined with the third party partners
Healthcare edit edit source
Amazon has expanded into the healthcare sector with initiatives such as Amazon Pharmacy, offering prescription medication delivery, and Amazon Care, a virtual healthcare service for employees.
Entertainment and Media edit edit source
Amazon Studios produces and distributes original movies and TV shows through Amazon Prime Video. The company has also ventured into sports broadcasting, streaming live sports events.
Advertising edit edit source
Amazon is steadily expanding its advertising division, providing a comprehensive suite of products and services via Amazon Advertising. This enables brands to effectively reach their customers on Amazon's various platforms.
Hardware and Consumer Electronics edit edit source
Beyond its range of smart home devices, Amazon also produces and retails an array of hardware products. This includes the Fire series of tablets and TV streaming devices, as well as the popular Kindle e-readers.
Others edit edit source
Other business sectors Amazon is involved in include Robotics, as demonstrated by initiatives like Amazon Scout, and space exploration, spearheaded by Blue Origin. The company also has significant investments in artificial intelligence and machine learning technologies.
Breakdown of sector revenues[5] edit edit source
E-commerce Retail edit edit source
Amazon's core business lies in e-commerce retail, encompassing the sales of a diverse array of consumer goods via its eponymous online platform. This includes a vast assortment of items such as electronics, books, clothing, and home goods. In 2022, Amazon's online storefronts achieved an impressive revenue of $220 billion. This accounts for 42% of the company's income which is basically a fee from 3rd party retailers selling their products on amaozn.
Physical stores edit edit source
Amazon's physical stores have been experiencing significant growth in terms of revenues. With their diverse range of offerings, including Amazon Go cashier-less stores, Amazon Books, and Amazon 4-star, the brick-and-mortar locations have attracted customers that resulted in substantial revenue for the e-commerce giant. In 2022, Amazon's online stores raked in an $18.96 billion in revenue.
Amazon Web Services (AWS) edit edit source
AWS is a cloud computing platform offered by Amazon. It provides numerous services, such as storage, computing power, database management, and analytics, to businesses and individuals. AWS has been a significant revenue driver for Amazon, contributing a significant portion of its overall revenue. In 2022, Amazon's revenue from Amazon Web Services (AWS) amounted to a $80 billion.
Subscription Services edit edit source
Amazon offers various subscription-based services, such as Amazon Prime, which provides benefits like free shipping, streaming of movies and TV shows, and access to exclusive deals. Prime membership fees contribute to the subscription services sector revenue. For the year 2022, Amazon generated $35.22 billion from Subscription Services.
Third-Party Seller Services edit edit source
Amazon allows third-party sellers to sell their products through its platform. Amazon charges fees for services like fulfilment (through its Fulfilment by Amazon program), referral fees, and advertising. These fees contribute to the third-party seller services sector. In the year 2022, Third-Party Seller Services contributed to Amazon's revenue with a staggering $117.71 billion.
Advertising edit edit source
Amazon has been expanding its advertising business by offering display and sponsored product ads on its platform. This sector generates revenue through advertising fees paid by businesses to promote their products on Amazon. In 2022, the advertising revenue generated by Amazon amounted to $37.74 billion.
Other Revenue edit edit source
This category includes various sources of revenue for Amazon that do not fall into the aforementioned sectors. It may include revenue from physical stores (such as Whole Foods Market, acquired by Amazon), digital content sales, and other miscellaneous sources. For the year 2022, Amazon generated $4.25B billion from Other Revenue.
edit edit source
The previous section showcases Amazon’s breakdown of revenue and the most important segments to Amazon from the perspective of revenues are: e-commerce, third party seller services, AWS and subscription services. Below figures will illustrate the market share of Amazon in some of those segments.[6]
edit edit source
Amazon is the indisputable leader in the US e-commerce sector, enjoying a commanding position, with Walmart, Apple, and eBay trailing behind. Other participants in the market hold a mere maximum of 2% of the overall share.[7]

Noteworthy statistics regarding Amazon's position in the industry are as follows:
| Statistic | Statistic value |
|---|---|
| 2021 Amazon e-commerce revenue | USD 220 billion |
| Number of active sellers (2022) | 9.7 million |
| Number of shipments in 2021 | 7.7 billion |
| Global number of users (2022) | 310 million |
| Number of fulfilment centres (2023) | 185 |
| Total area of fulfilment centres (2019) | 150 mln sq ft |
Ecommerce Trends edit edit source
Global eccomerce sales will reach $5.8 trillion in 2023, reaching $8 trillion in 2027 (https://www.shopify.com/uk/blog/global-ecommerce-sales). Between 2023 and 2028 the average annual growth rate of ecommerce sales will be 8.62% (https://www.oberlo.com/statistics/global-ecommerce-sales-growth). This growth is being supported by mobile use for online shopping. Mobile ecommerce is expected to 42.9% of ecommerce sales by 2024.
Amazon's eccomerce sales was as follows:
141.2 billion 2019
197.3 billion 2020 (40% increase)
222 billion 2021 (12.53% increase)
220 billion in 2022 (decline of 0.932%)
The 40% in 2020 was due to covid. While this growth is unique as a result of that year the sales volumes have remained in that region as a result. Furthermore, Amazon market share of global eccomerce sales increased singificantly in 2020 as global growth only reached 25.7% (https://www.velotrade.com/blog/global-growth-of-ecommerce-markets/). However, since this Amazon's growth has been trivial to global growth in eccomcer sales - global growth reaching 19.6% in 2021 and 12.7% in 2022 (https://www.velotrade.com/blog/global-growth-of-ecommerce-markets/).
edit edit source

Much like their unrivalled presence in the e-commerce industry, Amazon's smart speakers, powered by the popular voice assistant Alexa, maintain a dominant position in the market.
The following diagram illustrates the demand for various products on Amazon. Electronics goods emerge as the most sought-after category, closely followed by clothing and shoes, and then home and furniture. Conversely, pet supplies rank as the least frequently ordered items on the platform.[8]

Amazon's prominence as an e-commerce giant extends beyond its popularity in product categories. In fact, it serves as the initial search destination for over half of online shoppers, cementing its position as a starting point for their online purchasing journey.[8]

Cloud computing market edit edit source
 edit
edit source
edit
edit source

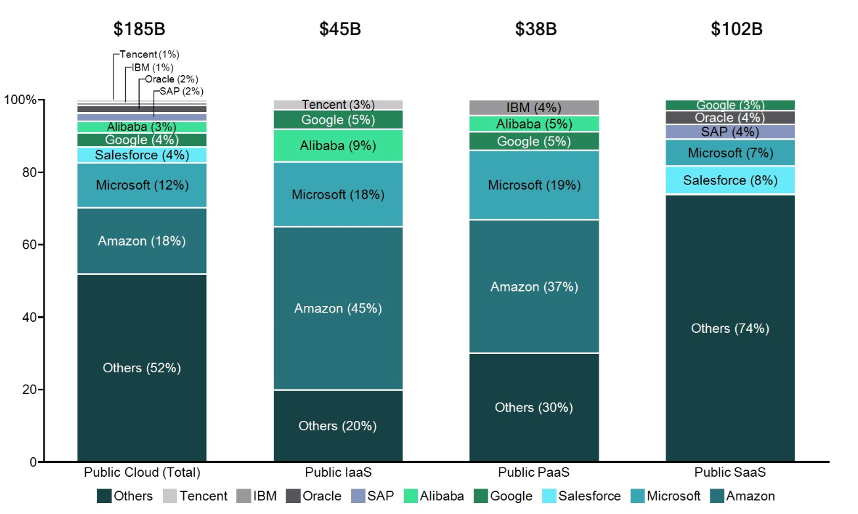
In 2019, Amazon dominated the cloud computing market, surpassing its major competitors with a significant 18% market share. Among the various segments of cloud computing, Amazon's Infrastructure as a Service (IaaS) holds an impressive 45% market share. As of Q1 2022, AWS continues to lead as the preferred provider of cloud computing services, with Microsoft's Azure making progress but still trailing behind.
There are several noteworthy trends in the cloud computing market that AWS can leverage to its advantage:
- Growing popularity of the cloud among small and medium-sized enterprises (SMEs).
- Increasing adoption of multi-cloud solutions by businesses.
- Expansion of the cloud gaming market.
To provide an overview of the competition faced by Amazon in its key segments, the following table summarises the landscape:
| Segment of competition | Main competitors |
|---|---|
| E-commerce | Apple, Walmart, eBay, Homedepot, Costco, Shopify |
| Cloud Computing | Microsoft, Google, Sales Force, Alibaba, several other chinese competitors |
| Digital content | Netflix, Spotify, Apple, |
| Smart home appliances | Alibaba, Xiaomi, Google, Baidu, Apple, Echo dot |
On-going and future Amazon projects edit edit source
Renewable energy edit edit source
In September 2022, Amazon publicly committed to addressing global warming, announcing an ambitious renewable energy initiative.[9] The company disclosed plans for 379 new renewable energy projects worldwide, which involve the construction of solar and wind facilities. The goal of these projects is to power approximately 4.6 million homes with renewable energy while transitioning all Amazon business units to 100% renewable energy dependence.
Poland and France were selected for the inaugural projects. In October 2022, Spanish renewable investment platform Q-Energy completed the financing for a solar farm in Poland dedicated to generating electricity for Amazon. That same year, Apollo Power, an Israeli flexible solar module manufacturer, announced a contract with Amazon for its product to be used at a facility in France.
In 2019, Amazon underscored its dedication to a net-zero carbon world by co-founding The Climate Pledge. The company aims to achieve net-zero carbon status by 2040, a full decade ahead of the Paris Agreement. As of now, The Climate Pledge has accrued more than 375 signatories, including prominent corporations like IBM, Microsoft, PepsiCo, Siemens, Unilever, Verizon, and Visa.
In addition to this, Amazon has initiated a partnership with electric vehicle company Rivian, placing an order for over 100,000 electric vehicles for carbon-free delivery, scheduled to be operational by 2030. Notably, 3,000 of these vehicles are already in service.


Project Kuiper and satellite network edit edit source
Amazon's Project Kuiper is a recent venture aiming to address the challenge of costly and complex traditional antenna systems, a difficulty often faced in various regions of the world where access to broadband and mobile networks is limited.[10]
The project involves the deployment of a satellite network intended to provide broadband and internet connectivity to these underserved areas. The function of this system is predicated upon households purchasing a "customer terminal," which serves as a connection point to the satellite network.
The customer terminal, as compared to conventional antennas, is lighter, less expensive, and simpler to install, as per the information provided. Once purchased and set up, this terminal enables households to connect to the overhead satellite network, thereby facilitating internet access.
The following table provides a comparative analysis of three distinct customer terminals.
| Customer terminal type: | Cost of installation: | Speed of terminal | Size | Weight |
|---|---|---|---|---|
| Medium sized terminal aimed at residential and small buiness customers | $400 | 400 megabits per second (Mbps) | Less than 11 inches square and 1 inch thick | Less than 5 pounds |
| Ultra compact terminal aimed for a personal use. Light and transportable | NA | 100 megabits per second (Mbps) | 7 square inches | 1 pound |
| A high-bandwidth design for the most demanding needs | NA but aimed at governments, telecoms and enterprises | 1 gigabit per second (Gbps) | 19 inches by 30 inches | NA |

Terminals for residential and small business customers

Ultra compact terminal

A high-bandwidth design for the most demanding needs

Amazon industrial innovation fund[11] edit edit source
In April 2022, Amazon announced the creation of a USD 1 billion platform, dubbed the "Amazon Industrial Innovation Fund". This venture capital-style fund is designed with a focus on bettering the company's operations, enhancing logistics, improving delivery speeds, and advancing the experience for warehouse and logistics employees.
The aim of the fund is to invest in non-Amazon owned companies that can contribute significantly to improvements in delivery speed and employee experience within the logistics and warehousing industries.
The initial round of investments is targeted towards technology and safety wear ventures, with further details provided below:
| Investee | Main offerings | Website |
|---|---|---|
| Modjoul | Wearable safety technology, personalised ads and safety signals | https://modjoul.com |
| Vimaan | Computer vision and artificial intelligence solutions to improve inventory management | https://vimaan.ai |
| Agility Robotics | Bi-pedal walking robot | https://agilityrobotics.com |
| BionicHIVE | Autonomous robotic solution facilitating with shelving racks and boxes in warehouses | https://www.bionichive.com |
| Mantis Robotics | Tactile robotic arm that uses sensor technology to cohesively work alongside people | https://www.mantis-robotics.com |
Amazon lending edit edit source
Amazon, which began its lending operations in 2016, is considering a partnership with Goldman Sachs to expand this facet of its business. As of December 2022, Amazon had over USD 863 million in outstanding loans, with interest rates levied between 6% and 17% on the remaining balance.
This potential collaboration is enabled by the "Open Banking" regulation, a set of rules implemented by the European Union in 2019. The regulation permits financial institutions to share critical financial information, such as credit histories, with technology companies.
Amazon, despite having abundant customer data, does not possess direct access to clients' credit histories. This information is crucial in assessing credit risk and lending viability. A partnership with Goldman Sachs would fill this gap by providing Amazon access to this important data, potentially enhancing its lending operations.
It's important to note that previous instances have shown e-commerce platforms collaborating with financial service providers to offer capital to SMEs. However, the actual impact of this proposed venture on small and medium-sized businesses would depend on various factors including competition and market conditions, and thus cannot be precisely predicted at this point.
Team[12] edit edit source
Leadership edit edit source
Executive Chairman edit edit source

Jeff Bezos is the visionary founder of Amazon.com.
Bezos is also the founder of Blue Origin, focusing on reducing space travel costs and enhancing safety. He owns The Washington Post and is known for his philanthropy. The Bezos Earth Fund supports conservation efforts, while The Bezos Day One Fund helps homeless families and establishes preschools in underserved communities.
Educated at Princeton University, Bezos graduated with honours in electrical engineering and computer science. He was named TIME Magazine's Person of the Year in 1999.
Chief Executive Officer edit edit source

Andy Jassy, the CEO of Amazon, is a visionary leader whose exceptional expertise and strategic acumen have played a pivotal role in shaping the company's success. With an impressive tenure at Amazon, Jassy has demonstrated unwavering commitment to innovation and customer-centricity, driving Amazon's transformation into a global tech giant. Known for his sharp intellect, Jassy possesses a deep understanding of the evolving technology landscape and has been instrumental in the growth of Amazon Web Services (AWS), Amazon's cloud computing division. His visionary leadership and ability to navigate complex challenges have garnered admiration, as he consistently fosters a culture of relentless innovation and high standards. Under Jassy's guidance, Amazon continues to expand its reach and redefine the boundaries of what is possible, making him a respected and influential figure in the tech industry.
Senior Vice President and Chief Financial Officer edit edit source

Brian T. Olsavsky joined Amazon.com in April 2002. As CFO of Amazon.com, he oversees the company's overall financial activities, including controllership, tax, treasury, analysis, investor relations, internal audit and financial operations. Prior to becoming Senior Vice President and CFO in June 2015, he served as Vice President, Finance and CFO for the Global Consumer Business. In his role as Vice President, Finance and CFO for the Global Consumer Business, Mr. Olsavsky had oversight and responsibility for the finance team supporting Amazon.com websites, merchant services, and fulfillment operations and subsidiaries. From 2007 to 2010, Mr. Olsavsky was Vice President, Finance for Amazon's North America retail business unit and acquisitions, and from 2002 to 2007 Mr. Olsavsky led the finance departments for Amazon's Worldwide Operations organization. Prior to joining Amazon.com, Mr. Olsavsky spent seven years at Fisher Scientific, where he held a variety of financial and business management roles, and a total of eight years at BF Goodrich and Union Carbide, where he held a variety of financial and operational roles. Mr. Olsavsky received a BS in Mechanical Engineering from Penn State and an MBA in Finance from Carnegie Mellon University.
Chief Executive Officer, Worldwide Amazon Stores edit edit source

Douglas J. Herrington has served as CEO of Worldwide Amazon Stores since July 2022. In this role, he leads numerous businesses, including Amazon’s online and mobile shopping experiences worldwide, global operations and fulfillment, Prime, Amazon Grocery, Amazon Business, Selling Partner Services, and Amazon Health Services. He joined Amazon in 2005 to launch the Amazon consumables business and was named senior vice president of North America Consumer in 2015. Doug is passionate about building and innovating. He led teams that invented services such as Subscribe and Save, Amazon Fresh, Amazon Business, Alexa Shopping, and Buy with Prime. Before joining Amazon, he was the founder and CEO of KeepMedia and previously served on the executive team at online grocery retailer Webvan. Doug received a BA in economics from Princeton University and holds an MBA from Harvard Business School.
Vice President, Worldwide Controller edit edit source

Shelley L. Reynolds joined Amazon in February 2006 as Vice President of Finance and Controller. In April 2007, she was promoted to Vice President, Worldwide Controller and Principal Accounting Officer. In her role, she oversees Amazon’s accounting function, leading the team that touches every geography in which the company operates. Prior to joining Amazon, Ms. Reynolds spent 19 years at Deloitte & Touche LLP, serving as partner from 1998 to 2006. At Deloitte, Ms. Reynolds specialized in matters related to mergers & acquisitions and the Securities and Exchange Commission, serving multiple publicly traded multi-national corporations from a broad range of industries. Ms. Reynolds received her undergraduate degree from the University of Washington Foster School of Business, where she currently serves on the advisory board.
Chief Executive Officer, Amazon Web Services edit edit source

Adam N. Selipsky is the CEO of Amazon Web Services (AWS), the world’s most comprehensive and broadly adopted cloud. He also leads Worldwide Sustainability for Amazon, overseeing efforts to scale and drive Amazon’s adoption of renewable energy, path to net-zero carbon emissions, and other company-wide initiatives. Having previously led AWS Marketing, Sales, and Support from its infancy, Selipsky was instrumental in launching and growing AWS from a startup into a multi-billion-dollar business. In 2016, Selipsky left to become president and CEO of data visualization pioneer Tableau Software, where he led the company through its acquisition by Salesforce in what was the third-largest software industry acquisition at the time, before returning to AWS in 2021. Selipsky is a member of the World Economic Forum Information, Technology, and Communications governors, and serves on the Harvard Business School Dean’s Advisory Board. He has an AB in government from Harvard University and an MBA from Harvard Business School.
Senior Vice President, Global Public Policy & General Counsel edit edit source

David Zapolsky joined Amazon.com in November 1999 as Associate General Counsel for Litigation and Regulatory matters and was promoted to Vice President in April 2002. He became Vice President, General Counsel and Secretary in September 2012, and Senior Vice President, General Counsel and Secretary in May 2014. He currently oversees the company’s legal, policy, compliance, and regulatory affairs and serves as Amazon’s corporate secretary.
Prior to joining Amazon.com, David was a partner at the Seattle offices of Dorsey & Whitney and Bogle & Gates. Before moving to Seattle from New York City in 1994, he served as an Assistant District Attorney in the Brooklyn District Attorney’s Office and later practiced law at Wachtell Lipton Rosen & Katz. He received his undergraduate degree in music from Columbia University and a J.D. with honors from the University of California, Berkeley.
Ownership structure edit edit source
Beneficial owners
As of the 2023 Proxy Statement[13], individuals who serve as directors and/or executive officers, the collective group of directors and executive officers, and individuals and organizations that own 5% or more of the total common stock have been granted sole voting and investment power. The beneficial owners list has been released as follows:
| Beneficial owner | Share stake |
|---|---|
| Jeffrey P. Bezos | 12.3% |
| The Vanguard Group, Inc. | 6.9% |
| BlackRock, Inc. | 5.8% |
| Andrew R. Jassy | 0.02% |
| Keith B. Alexander | <0.01% |
| Edith W. Cooper | <0.01% |
| Jamie S. Gorelick | <0.01% |
| Daniel P. Huttenlocher | <0.01% |
| Judith A. McGrath | <0.01% |
| Indra K. Nooyi | <0.01% |
| Jonathan J. Rubinstein | <0.01% |
| Patricia Q. Stonesifer | <0.01% |
| Wendell P. Weeks | <0.01% |
| Brian T. Olsavsky | <0.01% |
| Douglas J. Herrington | <0.01% |
| Adam N. Selipsky | <0.01% |
| David A. Zapolsky | <0.01% |
| All directors and executive officers as a group (16 persons) | 12.3% |
Other major stockholders[14] edit edit source
| Stockholders | Share stake |
|---|---|
| SSgA Funds Management, Inc. | 3.24% |
| Fidelity Management & Research Co... | 2.47% |
| T. Rowe Price Associates, Inc. (I... | 1.85% |
| Geode Capital Management LLC | 1.61% |
| Norges Bank Investment Management | 0.96% |
| Capital Research & Management Co.... | 0.92% |
Corporate Strategy edit edit source
Infrastructure Development
Amazon has heavily invested in building a robust infrastructure to support its vast operations. The company has established a global network of fulfilment centres strategically located to ensure efficient order fulfilment and fast delivery to customers. These fulfilment centres are equipped with advanced technologies, including robotics and automation, to optimize operational efficiency and minimize processing times. Additionally, Amazon has developed data centres worldwide to support its cloud computing services offered through Amazon Web Services (AWS).
Logistics Capabilities
Amazon has developed a highly efficient and scalable logistics network to support its extensive product range and ensure timely delivery. The company operates its fleet of delivery vehicles, including vans and trucks, to handle last-mile deliveries and manage its logistics operations effectively. Furthermore, Amazon has expanded its logistics capabilities through partnerships with third-party logistics providers and the establishment of its delivery service, Amazon Logistics. This enables Amazon to have greater control over its delivery process and enhance the customer experience.
Physical Assets
In addition to its digital presence, Amazon has made tangible investments in physical assets to support its business operations. This includes the acquisition of Whole Foods Market, a prominent grocery store chain, which provides Amazon with a physical retail footprint and strengthens its position in the grocery industry. Amazon has also established physical stores, such as Amazon Go and Amazon 4-star, to create immersive shopping experiences and extend its reach to offline customers.
Strategic Acquisitions
Amazon has pursued strategic acquisitions to expand its capabilities, enter new markets, and gain a competitive edge. Notable acquisitions include the purchase of Ring, a home security company specializing in smart doorbells and cameras, and Twitch, a popular live streaming platform for gaming and creative content. These acquisitions have allowed Amazon to diversify its offerings, integrate innovative technologies into its ecosystem, and tap into new customer segments.
Amazon's tangible assets and investments play a crucial role in supporting its corporate strategy and ensuring the delivery of exceptional customer experiences. The company's infrastructure, logistics capabilities, physical assets, and strategic acquisitions all contribute to its market leadership and growth. By continually investing in tangible resources, Amazon strengthens its operational efficiency, expands its market reach, and enhances its competitive advantage. As Amazon continues to innovate and adapt to evolving customer needs, its tangible assets will remain key drivers of its success in the highly competitive e-commerce landscape.
Financials edit edit source
Historic edit edit source
Most recent quarter edit edit source
During the three month period ending on 31st March 2023 Amazon Inc achieved revenues of $127.36 billion, showing a 14,64% decrease to the last quarter of 2022. Despite that, it achieved a net income of $3.17 billion, marking an impressive increase to the previous quarter, when a $278 million net income was reported. A significant cut to operating expenses was observed, that resulted to the operating margin increasing from 1.83% to 3.75%.
Most recent year edit edit source
In the end of the fiscal year of 2022 Amazon, Inc reported a loss of $5.94 billion. The revenue and total assets experienced an slight increase compared to 2021, interrupting the exponential increase trend observed in the previous years. A 23.35% increase in operating expenses can partially account for the loss, as it outweighs the 14% increase in gross profit, resulting in a lower operating income. The increase in expenses can be linked to the Rivian Automotive (RIVN) investment that Amazon originally made in 2019. The company went public in 2021, and lost 75% of its value during the next year, therefore not returning the expected turnovers.[15]
All periods[16] edit edit source
| Year | Year end date | Income Statement | Balance Sheet | Employees | |
|---|---|---|---|---|---|
| Revenues($million) | Net profits ($million) | Total Assets($million) | |||
| 1 | 31/12/1997 | $148 | -$31 | $149 | 614 |
| 2 | 31/12/1998 | $610 | -$125 | $648 | 2,100 |
| 3 | 31/12/1999 | $1,640 | -$720 | $2,466 | 7,600 |
| 4 | 31/12/2000 | $2,762 | -$1,411 | $2,135 | 9,000 |
| 5 | 31/12/2001 | $3,122 | -$567 | $1,638 | 7,800 |
| 6 | 31/12/2002 | $3,933 | -$149 | $1,990 | 7,500 |
| 7 | 31/12/2003 | $5,264 | $35 | $2,162 | 7,800 |
| 8 | 31/12/2004 | $6,921 | $588 | $3,248 | 9,000 |
| 9 | 31/12/2005 | $8,490 | $359 | $3,696 | 12,000 |
| 10 | 31/12/2006 | $10,711 | $190 | $4,363 | 13,900 |
| 11 | 31/12/2007 | $14,835 | $476 | $6,485 | 17,000 |
| 12 | 31/12/2008 | $19,166 | $645 | $8,314 | 20,700 |
| 13 | 31/12/2009 | $24,509 | $902 | $13,813 | 24,300 |
| 14 | 31/12/2010 | $34,204 | $1,152 | $18,797 | 33,700 |
| 15 | 31/12/2011 | $48,077 | $631 | $25,278 | 56,200 |
| 16 | 31/12/2012 | $61,093 | -$39 | $32,555 | 88,400 |
| 17 | 31/12/2013 | $74,452 | $274 | $40,159 | 117,300 |
| 18 | 31/12/2014 | $88,988 | -$241 | $54,505 | 154,100 |
| 19 | 31/12/2015 | $107,006 | $596 | $65,444 | 230,800 |
| 20 | 31/12/2016 | $135,987 | $2,371 | $83,402 | 341,400 |
| 21 | 31/12/2017 | $177,866 | $3,033 | $131,310 | 566,000 |
| 22 | 31/12/2018 | $232,887 | $11,261 | $162,648 | 647,500 |
| 23 | 31/12/2019 | $280,522 | $13,976 | $225,248 | 822,500 |
| 24 | 31/12/2020 | $386,064 | $24,178 | $321,195 | 1,298,000 |
| 25 | 31/12/2021 | $469,822 | $38,151 | $420,549 | 1,608,000 |
| 26 | 31/12/2022 | $513,983 | -$5,936 | $462,675 | 1,541,000 |

Forward edit edit source
Method edit edit source
To evaluate the forecasted revenue and net profit values, the function "FORECAST.EST()" was used in Microsoft Excel. The inputs were the historical values, the timeline corresponding to those values (1997-2022), the target date (2032), and seasonality, which was set to 12. Excel uses the method of linear regression, which bases the future values of the historical trends. A forecast for the next 10 years is provided, as a more in-depth analysis is required to accurately predict the financials across the entire lifetime of the company.
Financial Forecasts edit edit source
| Year | Revenue ($millions) | Net Profit ($millions) | ||||
|---|---|---|---|---|---|---|
| Forecast | Lower-bound value | Upper-bound value | Forecast | Lower-bound value | Upper-bound value | |
| 2023 | 316,184 | 129,953 | 502,415 | 10,651 | (4,996) | 26,298 |
| 2024 | 329,583 | 141,856 | 517,310 | 10,001 | (5,771) | 25,774 |
| 2025 | 343,325 | 154,090 | 532,559 | 10,335 | (5,564) | 26,234 |
| 2026 | 405,810 | 215,056 | 596,563 | 13,082 | (2,945) | 29,109 |
| 2027 | 410,113 | 217,829 | 602,396 | 12,965 | (3,190) | 29,120 |
| 2028 | 419,340 | 225,515 | 613,165 | 14,423 | (1,862) | 30,708 |
| 2029 | 438,952 | 243,575 | 634,330 | 14,562.07 | (1,853) | 30,977 |
| 2030 | 465,707 | 268,765 | 662,648 | 18,514 | 1,968 | 35,061 |
| 2031 | 489,988 | 291,472 | 688,504 | 19,927 | 3,248 | 36,606 |
| 2032 | 458,247 | 258,146 | 658,349 | 16,926 | 114.02 | 33,739 |

edit edit source
Intense Competition edit edit source
Amazon has competitors across geographies and industries- retail (physical, e-commerce, omni-channel), computing services (both web and infrastructure), electronic devices, digital content, grocery etc.
Expansion into newer market segments edit edit source
There could be a possibility of failure to recoup investments in new technologies, products, or services. This is because of the limited or no experience in these areas.
edit edit source
International Expansion edit edit source
There are several factors like government restrictions/ regulations, physical and technological infrastructure, income levels, geopolitical events etc. which pose a threat to significant revenues and profits from the international market. Amazon has no first-to-market advantage in some geographies and little operating experience in others. For example, regulations in the two biggest Asian markets- India and China are quite restrictive to Amazon’s business activities. Violation of these regulations may result in heavy penalties or revocation of licences. They also face threats from more established local companies and brands.
Fluctuation in Demand edit edit source
Variability in Amazon’s retail business because of seasonality, promotions, unforeseen economic, climate and geopolitical events place increased strain on operations. The risks related to fulfilment network optimisation and inventory are magnified during periods of high demand. This results in high fluctuations in operating results and growth rate.
Technological Risks (data loss, security breaches, system interruption, lack of redundancy) edit edit source
Because a lot of sensitive and confidential information is collected, processed, stored and transmitted by Amazon, failure to prevent data loss, theft, and misuse could lead to litigation liability, and regulatory action, discouraging its customers and vendors to use the platform, and could harm the business reputation.
Furthermore, any event that could prevent Amazon from accepting and fulfilling customer orders and providing services, due to system interruption, delays etc. Can make its product and service offerings less attractive and subject to liability.
Strategic Alliances, Commercial Agreements, Supplier and other Business Relationships edit edit source
Violations by suppliers or other vendors of applicable laws, regulations, contractual terms, intellectual property rights of others, or Supply Chain Standards, as well as products or practices regarded as unethical, unsafe, or hazardous, could expose Amazon to claims, damage their reputation, limit our growth, and negatively affect our operating results. A point to be noted is that there are limited or single sources of supply in some cases.
Additionally, these arrangements are complex and require substantial infrastructure capacity, personnel, and other resource commitments, which may limit the amount of business Amazon can service. They may not be able to implement, maintain, and develop the components of these commercial relationships, which creates additional risk.
edit edit source
There are several inventory risk factors that may adversely affect the operating results . Some of these are rapid changes in product cycles and pricing, defective merchandise, changes in customer demand and consumer spending patterns, changes in consumer tastes with respect to products offered, spoilage, new product launches. Additionally, certain goods or components require significant lead time and prepayment which may not be returnable. They also carry significant inventory levels of certain products, like consumer electronics, and are sometimes unable to sell products in sufficient quantity or to meet demand during relevant selling seasons.
For existing and future payment options they offer to their customers, Amazon currently is subject to, and may become subject to additional, regulations and compliance requirements (including obligations to implement enhanced authentication processes that could result in significant costs and reduce the ease of use of their payments products), as well as fraud. For certain payment methods, including credit and debit cards, they pay interchange and other fees, which may increase over time and raise their operating costs and lower profitability.
Valuation edit edit source
We employed a Discounted Cash Flow (DCF) model to arrive at an intrinsic valuation for Amazon. Furthermore, we utilized a trading comparable analysis to generate a relative valuation.
DCF edit edit source
We obtained the average year-on-year growth rate by using revenue figures from 2018 to 2022. This growth rate was then utilised to project the expected revenues from 2023 to 2027. In a similar fashion, we used the average growth in taxes (as a percentage of EBIT) from the past years to forecast future taxes. As for other financial statement components, their growth was analysed and forecasted as a percentage of the projected revenue.
| $ million | Historical | Projected | ||||||||
|---|---|---|---|---|---|---|---|---|---|---|
| Income Statement [17] | 2018 | 2019 | 2020 | 2021 | 2022 | 2023 | 2024 | 2025 | 2026 | 2027 |
| Revenue | 232,887 | 280,522 | 386,064 | 469,822 | 513,983 | 565,381 | 630,400 | 693,440 | 780,120 | 873,735 |
| % growth | - | 20.45% | 37.62% | 21.70% | 9.40% | 10.00% | 11.50% | 10.00% | 12.50% | 12.00% |
| EBIT | 25,330 | 30,457 | 39,572 | 48,362 | 39,039 | 49,162 | 61,750 | 75,553 | 93,578 | 114,419 |
| % revenue | 11% | 11% | 10% | 10% | 8% | 9% | 10% | 11% | 12% | 13% |
| Profit | 10,073 | 11,588 | 21,331 | 33,364 | -2,722 | -42 | 5,519 | 12,375 | 22,421 | 35,217 |
| % revenue | 4% | 4% | 6% | 7% | -1% | 0% | 1% | 2% | 3% | 4% |
| Cash Flow items [18] | ||||||||||
| D&A | 12,613 | 15,715 | 16,748 | 23,421 | 25,528 | 37,084 | 43,325 | 49,566 | 56,587 | 63,664 |
| % of PPE | 13% | 11% | 8% | 8% | 7% | 9% | 9% | 9% | 9% | 9% |
| Net Operating Cash Flow | 30,723 | 38,514 | 66,064 | 46,327 | 46,752 | 55,554 | 80,778 | 95,548 | 116,789 | 139,190 |
| Net Investing Cash Flow | -12,369 | -24,281 | -59,611 | -58,154 | -37,601 | -67,097 | -74,744 | -75,285 | -84,545 | -85,815 |
| Net Financing Cash Flow | -7,686 | -10,066 | -1,104 | 6,291 | 9,718 | -936 | 1,064 | 1,064 | 1,064 | 1,064 |
| Cash, BOP | - | 32,176 | 36,413 | 42,380 | 36,480 | 54,256 | 41,777 | 48,876 | 70,204 | 103,512 |
| Net Change in Cash | 10,317 | 4,237 | 5,967 | -5,900 | 17,776 | -12,479 | 7,099 | 21,328 | 33,309 | 54,439 |
| Cash, EOP | 32,176 | 36,413 | 42,380 | 36,480 | 54,256 | 41,777 | 48,876 | 70,204 | 103,512 | 157,952 |
| Net Operating Cash Flows* | 30,723 | 38,514 | 66,064 | 46,327 | 46,752 | 55,554 | 80,778 | 95,548 | 116,789 | 139,190 |
| CAPEX | -11,323 | -12,689 | -35,044 | -55,396 | -58,321 | -57,721 | -64,650 | -64,415 | -72,837 | -73,202 |
| Free Cash Flow | 19,400 | 25,825 | 31,020 | -9,069 | -11,569 | -2,168 | 16,128 | 31,133 | 43,952 | 65,988 |
| Note: Net Operating Cash Flows incorporate the effect of Depreciation and Amortisation and changes in Net Working Capital. | ||||||||||
Sources suggest a terminal growth rate within the 3-5% range[19]. The DCF model employs an estimate of 3%, but the full range is accommodated in the sensitivity analysis. This figure is used in calculating the terminal value, which, when discounted, results in a present terminal value of approximately $1.199 trillion.
In calculating the DCF that forecasts the financial trajectory of a US-based company over the next five years, the risk-free rate is pegged at the US 5-year Treasury rate of 3.87%[20]. This figure represents the monthly average rate spanning from January to July 2023.
The summarised estimates from the DCF analysis can be found in the table below.
| Input name | Input value | Reasons |
|---|---|---|
| Risk free rate | 3.87% | US 5 year Treasury note rate [20] |
| Market risk premium | 4.70% | Analysts expectations [21] |
| Levered beta | 0.88 | Analysts expectations [22] |
| Cost of equity | 8.01% | CAPM model |
| Cost of debt | 5.25% | US typical debt rate [23] |
| Internally calculated WACC | 7.74% | Calculated using the WACC formula from above estimates |
| Terminal growth rate | 3% | Analysts expectations [19] |
The market risk premium fluctuates between 4.2% and 5.2% [21], thus we employ an average of 4.7% for our calculations. The volatility of Amazon's stock price is viewed as being lower relative to the general market. This is reflected in its beta, which varies from 0.64 to 1.12 [22], yielding an average of 0.88. Consequently, we derive a cost of equity of 8.01%. When this is combined with the cost of debt, which stands at 5.25% [23], we arrive at a weighted average cost of capital (WACC) of 7.74%.
DCF calculation incorporates the H-model with an underlying assumption that starting from 2027 Amazon's free cash flows will grow by 7% until until 2037 where the terminal growth of cash flows will be 3%. The H-model assumes a smooth transition between the two stage of Amazon lifecycle. In the process of discounting the future Free Cash Flow to its present value, the WACC serves as the discount factor. This calculation leads to a share price of $138.23, a summary of which is presented in the table below.
| Metric | Metric value |
|---|---|
| WACC | 7.96% |
| Short term Growth | 7% |
| Long term growth | 3% |
| H terminal value | 1,758,880 |
| PV of terminal value | 1,199,300 |
| PV of all future cash flows | 1,326,882 |
| Number of years | 10 |
| Cash | 54,253 |
| Debt | 140,118 |
| Equity | 1,412,747 |
| Number of shares outstanding | 10,220 |
| Fair share price | 138.23 |
| Current Share Price | 134.30 |
The closing share price for Amazon stocks on 14th July 2023 stood at $134.40[24].
We conducted a sensitivity analysis using a WACC range of 6.5% to 9.0%, and a terminal growth rate span of 1.5% to 4.0%.
| WACC | ||||||||
|---|---|---|---|---|---|---|---|---|
| 6.50% | 7.00% | 7.50% | 7.74% | 8.00% | 8.50% | 9.00% | ||
| Terminal growth rate | 1.5% | $ 152.25 | $ 137.38 | $ 125.02 | $ 115.37 | $ 114.60 | $ 105.70 | $ 98.00 |
| 2.0% | $ 164.52 | $ 147.00 | $ 132.71 | $ 121.71 | $ 120.84 | $ 110.82 | $ 102.26 | |
| 2.5% | $ 179.85 | $ 158.77 | $ 141.94 | $ 129.21 | $ 128.21 | $ 116.79 | $ 107.16 | |
| 3.0% | $ 199.57 | $ 173.48 | $ 153.22 | $ 138.22 | $ 137.05 | $ 123.86 | $ 112.89 | |
| 3.5% | $ 225.86 | $ 192.38 | $ 167.32 | $ 149.26 | $ 147.86 | $ 132.33 | $ 119.65 | |
| 4.0% | $ 262.67 | $ 217.59 | $ 185.45 | $ 163.08 | $ 161.38 | $ 142.69 | $ 127.77 | |
Relative Valuation edit edit source
A comparable trade analysis is conducted to establish a relative valuation for Amazon, supplementing the aforementioned absolute DCF valuation. The analysis takes into account key competitors, such as Alibaba and Ebay [25].
The EV/EBITDA ratio, a commonly used valuation metric, takes into account both debt and liabilities relative to the actual earnings. On the other hand, the EV/Revenue ratio serves as an effective tool to determine whether a stock is undervalued or overvalued compared to its industry peers by accounting for the enterprise value and revenue generated by the firm.
The table provides a brief analysis of the ratios and market cap of the several companies in the analysis including their minimum/maximum, median, quartile and mean values.
In order to consider growth in relative valuation, PEG and growth adjusted EV/Revenue valuation multiples are used. PEG is the ratio of P/E to the annual growth in EPS. Growth adjusted EV/Revenue multiple is the ratio of EV/Revenue to the annual growth in revenue.
| Name | P/E [26] | EPS 2022 [27] | EPS 2023 [28] | EPS growth | PEG |
|---|---|---|---|---|---|
| Amazon.com Inc | 321.8 | -0.27 | 1.57 | -681.5% | -47.22 |
| MercadoLibre Inc | 92.3 | 9.53 | 16.69 | 75.1% | 122.85 |
| Etsy Inc | -16.1 | -5.48 | 2.33 | -142.5% | 11.30 |
| Chewy Inc | 306.7 | 0.12 | -0.01 | -108.3% | -283.11 |
| eBay Inc | 39.2 | -2.27 | 3.35 | -247.6% | -15.83 |
| Alibaba Group | 23.9 | 2.34 | 8.52 | 264.1% | 9.05 |
| Vipshop Holdings Ltd | 9.8 | 1.43 | 1.88 | 31.5% | 31.14 |
| Median | 31.6 | 0.8 | 2.8 | -38.4% | 10.2 |
| Mean | 111.1 | 0.8 | 4.9 | -115.6% | -24.5 |
| Name | Revenue 2022 [29] | Revenue 2023 [28] | Revenue growth | EV/Revenue | Growth Adjusted EV/Revenue |
|---|---|---|---|---|---|
| Amazon.com Inc | 514.0 | 560.8 | 9.1% | 2.9 | 31.8 |
| MercadoLibre Inc | 10.5 | 13.5 | 28.5% | 5.2 | 18.2 |
| Etsy Inc | 2.6 | 2.8 | 7.6% | 4.8 | 63.5 |
| Chewy Inc | 10.1 | 11.4 | 12.7% | 2.0 | 15.8 |
| eBay Inc | 9.8 | 10.1 | 2.6% | 2.5 | 96.0 |
| Alibaba Group | 126.491 | 132.7 | 4.9% | 2.5 | 50.8 |
| Vipshop Holdings Ltd | 14.956 | 15.8 | 5.6% | 2.5 | 44.3 |
| Median | 10.3 | 12.5 | 6.6% | 2.5 | 47.6 |
| Mean | 98.3 | 106.7 | 10.1% | 3.2 | 45.8 |
Amazon had a negative annual EPS in 2022 which results in a negative EPS growth and PEG. Therefore, this multiple is not used to obtain a valuation. It has both a high PE and EV/Revenue multiple compared to the industry median, which usually implies that the stock is overvalued.
On the other hand, Amazon has a noticeably lower growth adjusted EV/Revenue multiple (31.8) compared to the industry median (47.6). This results in an implied share price of $211.09, which is significantly higher than the current share price.
Appendix edit edit source
Financial Statements edit edit source
| Year end date | 31/12/2018 | 31/12/2019 | 31/12/2020 | 31/12/2021 | 31/12/2022 |
|---|---|---|---|---|---|
| Current Assets | |||||
| Cash and Cash Equivalents ($million) | $31,750 | $36,092 | $42,122 | $36,220 | $53,888 |
| Marketable securities ($million) | $9,500 | $18,929 | $42,274 | $59,829 | $16,138 |
| Inventory ($million) | $17,174 | $20,497 | $23,795 | $32,640 | $34,405 |
| Net Receivables ($million) | $16,677 | $20,816 | $24,542 | $32,891 | $42,360 |
| Total Current Assets ($million) | $75,101 | $96,334 | $132,733 | $161,580 | $146,791 |
| Long-Term Assets | |||||
| Net Property and equipment ($million) | $61,797 | $72,705 | $113,114 | $160,281 | $186,715 |
| Operating leases ($million) | -- | $25,141 | $37,553 | $56,082 | $66,123 |
| Goodwill ($million) | $14,548 | $14,754 | $15,017 | $15,371 | $20,288 |
| Other Assets ($million) | $11,202 | $16,314 | $22,778 | $27,235 | $42,758 |
| Total Assets ($million) | $162,648 | $225,248 | $321,195 | $420,549 | $462,675 |
| Current Liabilities | |||||
| Accounts Payable ($million) | $38,192 | $47,183 | $72,529 | $78,664 | $79,600 |
| Accrued expenses and other ($million) | $23,663 | $32,439 | $44,138 | $51,775 | $62,566 |
| Unearned revenue ($million) | $6,536 | $8,190 | $9,708 | $11,827 | $13,227 |
| Total Current Liabilities ($million) | $68,391 | $87,812 | $126,385 | $142,266 | $155,393 |
| Long-Term lease liabilities ($million) | $9,650 | $39,791 | $52,573 | $67,651 | $72,968 |
| Long-Term Debt ($million) | $23,495 | $23,414 | $31,816 | $48,744 | $67,150 |
| Other Liabilities ($million) | $17,563 | $12,171 | $17,017 | $23,643 | $21,121 |
| Total Liabilities ($million) | $119,099 | $163,188 | $227,791 | $282,304 | $316,632 |
| Stock Holders Equity | |||||
| Common Stocks ($million) | $5 | $5 | $5 | $106 | $108 |
| Capital Surplus ($million) | $26,791 | $33,658 | $42,865 | $55,437 | $75,066 |
| Retained Earnings | $19,625 | $31,220 | $52,551 | $85,915 | $83,193 |
| Treasury Stock ($million) | -$1,837 | -$1,837 | -$1,837 | -$1,837 | -$7,837 |
| Other Equity ($million) | -$1,035 | -$986 | -$180 | -$1,376 | -$4,487 |
| Total Equity ($million) | $43,549 | $62,060 | $93,404 | $138,245 | $146,043 |
| Total Liabilities & Equity ($million) | $162,648 | $225,248 | $321,195 | $420,549 | $462,675 |
| Year end date | 31/12/2018 | 31/12/2019 | 31/12/2020 | 31/12/2021 | 31/12/2022 |
|---|---|---|---|---|---|
| Net Income ($million) | $10,073 | $11,588 | $21,331 | $33,364 | -$2,722 |
| Cash Flows-Operating Activities | |||||
| Depreciation ($million) | $15,341 | $21,789 | $25,180 | $34,433 | $41,921 |
| Net Income Adjustments ($million) | $6,352 | $7,575 | $6,072 | -$1,859 | $28,439 |
| Changes in Operating Activities | |||||
| Changes in Inventories ($million) | -$1,314 | -$3,278 | -$2,849 | -$9,487 | -$2,592 |
| Accounts Receivable ($million) | -$4,615 | -$7,681 | -$8,169 | -$18,163 | -$21,897 |
| Accounts Payable ($million) | $3,263 | $8,193 | $17,480 | $3,602 | $2,945 |
| Other Operating Activities ($million) | $1,623 | $328 | $7,019 | $4,437 | $658 |
| Net Cash Flow-Operating ($million) | $30,723 | $38,514 | $66,064 | $46,327 | $46,752 |
| Cash Flows-Investing Activities | |||||
| Capital Expenditures ($million) | -$11,323 | -$12,689 | -$35,044 | -$55,396 | -$58,321 |
| Investments ($million) | -$7,100 | -$31,812 | -$72,479 | -$60,157 | -$2,565 |
| Other Investing Activities ($million) | $6,054 | $20,220 | $47,912 | $57,399 | $23,285 |
| Net Cash Flows-Investing ($million) | -$12,369 | -$24,281 | -$59,611 | -$58,154 | -$37,601 |
| Cash Flows-Financing Activities | |||||
| Proceeds from short-term debt ($million) | $886 | $1,402 | $6,796 | $7,956 | $41,553 |
| Repayments of short-term debt ($million) | -$813 | -$1,518 | -$6,177 | -$7,753 | -$37,554 |
| Proceeds from long-term debt ($million) | $182 | $871 | $10,525 | $19,003 | $21,166 |
| Repayments of long-term debt ($million) | -$155 | -$1,166 | -$1,553 | -$1,590 | -$1,258 |
| Other financing activities ($million) | -$7,786 | -$9,655 | -$10,695 | -$11,325 | -$8,189 |
| Net Cash Flows-Financing ($million) | -$7,686 | -$10,066 | -$1,104 | $6,291 | $9,718 |
| Effect of Exchange Rate ($million) | -$1,093 | -$364 | $618 | $70 | -$351 |
| Net Cash Flow ($million) | $10,317 | $4,237 | $5,967 | -$5,900 | $17,776 |
| Year end date | 31/12/2018 | 31/12/2019 | 31/12/2020 | 31/12/2021 | 31/12/2022 |
|---|---|---|---|---|---|
| Total Revenue ($million) | $232,887 | $280,522 | $386,064 | $469,822 | $513,983 |
| Cost of Revenue ($million) | $139,156 | $165,536 | $233,307 | $272,344 | $288,831 |
| Gross Profit ($million) | $93,731 | $114,986 | $152,757 | $197,478 | $225,152 |
| Operating Expenses | |||||
| Fulfillment ($million) | $34,027 | $40,232 | $58,517 | $75,111 | $84,299 |
| Technology and content ($million) | $28,837 | $35,931 | $42,740 | $56,052 | $73,213 |
| Sales, General and admin. ($million) | $18,150 | $24,081 | $28,676 | $41,372 | $54,129 |
| Other Operating Items ($million) | $296 | $201 | -$75 | $62 | $1,263 |
| Operating Income | $12,421 | $14,541 | $22,899 | $24,879 | $12,248 |
| Interest income and other | $257 | $1035 | $2926 | $15081 | -$15817 |
| Earnings Before Interest and Tax | $12,678 | $15,576 | $25,825 | $39,960 | -$3,569 |
| Interest Expense | -$1,417 | -$1,600 | -$1,647 | -$1,809 | -$2,367 |
| Earnings Before Tax | $11,261 | $13,976 | $24,178 | $38,151 | -$5,936 |
| Net Income Tax | -$1,188 | -$2,388 | -$2,847 | -$4,787 | $3,214 |
| Net Income | $10,073 | $11,588 | $21,331 | $33,364 | -$2,722 |
| Net Income Applicable to Common Shareholders | $10,073 | $11,588 | $21,331 | $33,364 | -$2,722 |
| Year end date | 31/12/2018 | 31/12/2019 | 31/12/2020 | 31/12/2021 | 31/12/2022 |
|---|---|---|---|---|---|
| Liquidity Ratios | |||||
| Current Ratio | 110% | 110% | 105% | 114% | 94% |
| Quick Ratio | 85% | 86% | 86% | 91% | 72% |
| Cash Ratio | 46% | 41% | 33% | 25% | 35% |
| Profitability Ratios | |||||
| Gross Margin | 40% | 41% | 40% | 42% | 44% |
| Operating Margin | 5% | 5% | 6% | 5% | 2% |
| Pre-Tax Margin | 5% | 5% | 6% | 8% | -1% |
| Profit Margin | 4% | 4% | 6% | 7% | -1% |
| Pre-Tax ROE | 26% | 23% | 26% | 28% | -4% |
| After Tax ROE | 23% | 19% | 23% | 24% | -2% |
All financial data were retrieved from the annual reports that Amazon, Inc released at the end of each financial year.
ESG Factors edit edit source
Environmental Factors:
- Carbon Footprint and Climate Change: Amazon has committed to several environmental goals, including being net-zero carbon by 2040 and achieving 100% renewable energy usage. The company is investing in renewable energy projects and implementing energy-efficient technologies across its operations.
- Waste Reduction and Recycling: Amazon is working towards reducing waste and increasing recycling rates. It has introduced initiatives like Frustration-Free Packaging, which reduces packaging waste, and the Amazon Second Chance program, which encourages customers to recycle electronics and other products.
- Sustainable Supply Chain: Amazon aims to promote sustainability throughout its supply chain by encouraging suppliers to adopt environmentally responsible practices. The company focuses on responsible sourcing, reducing packaging waste, and optimizing transportation to minimize environmental impact.
Social Factors:
- Workforce Development: Amazon is committed to creating a diverse, inclusive, and safe work environment for its employees. The company invests in workforce development programs, training initiatives, and career advancement opportunities.
- Labour Practices: There have been ongoing discussions regarding labour practices at Amazon. Critics raise concerns about employee working conditions and labour rights. The company is taking steps to address these concerns and has increased minimum wage for its employees.
- Community Engagement: Amazon supports local communities through various initiatives, including philanthropy, job creation, and infrastructure development. The company also engages in disaster relief efforts and supports educational programs in underserved communities.
Governance Factors:
- Board Structure and Independence: Amazon's board is composed of directors with diverse backgrounds and expertise. The company emphasizes the importance of independent directors and maintains a strong governance structure.
- Transparency and Reporting: Amazon publishes an annual sustainability report that provides detailed information on its ESG initiatives, progress, and challenges. The company strives to maintain transparency in its reporting and regularly engages with stakeholders.
- Data Privacy and Security: As a technology-driven company, Amazon faces scrutiny over data privacy and security practices. It is committed to protecting customer data and complying with relevant regulations.
Amazon recognizes the importance of ESG factors and has made significant strides in addressing environmental, social, and governance challenges. The company's commitment to reducing its carbon footprint, promoting workforce development, engaging with communities, and maintaining strong governance practices is commendable. However, there are areas where Amazon can further improve, such as addressing labor concerns and enhancing data privacy practices. By continuing to prioritize ESG factors and implementing sustainable practices, Amazon can further strengthen its position as a responsible corporate citizen and contribute to a more sustainable and inclusive future.
References and notes edit edit source
- ↑
- ↑
- ↑
- ↑
- ↑ https://fourweekmba.com/amazon-revenue-breakdown/
- ↑ https://www.t4.ai/companies/amazon-market-share#:~:text=Amazon%27s%20Market%20Share%20in%20E,Streaming%20%2D%2013%25%20in%202019.
- ↑ https://aag-it.com/the-latest-cloud-computing-statistics/#:~:text=AWS%20remains%20the%20most%20popular,%2C%20with%20revenue%20up%2024%25.
- ↑ 8.0 8.1 https://financesonline.com/amazon-statistics/
- ↑ https://sustainabilitymag.com/renewable-energy/amazon-announces-71-new-projects-for-renewable-energy
- ↑ https://www.aboutamazon.com/news/innovation-at-amazon/what-is-amazon-project-kuiper
- ↑ https://www.aboutamazon.com/news/innovation-at-amazon/introducing-the-1-billion-amazon-industrial-innovation-fund
- ↑ https://ir.aboutamazon.com/officers-and-directors/default.aspx
- ↑ https://s2.q4cdn.com/299287126/files/doc_financials/2023/ar/Amazon-2023-Proxy-Statement.pdf
- ↑ Amazon.com, Inc. (AMZN) Stock Major Holders - Yahoo Finance
- ↑ Why Is Amazon Losing Money In 2022? (marketrealist.com)
- ↑ Amazon.com, Inc. - Annual reports, proxies and shareholder letters (aboutamazon.com)
- ↑ https://www.wsj.com/market-data/quotes/AMZN/financials/annual/income-statement
- ↑ https://www.wsj.com/market-data/quotes/AMZN/financials/annual/cash-flow
- ↑ 19.0 19.1 https://valueinvesting.io/AMZN/valuation/dcf-growth-exit-5y
- ↑ 20.0 20.1 https://ycharts.com/indicators/5_year_treasury_rate#:~:text=5%20Year%20Treasury%20Rate%20(I%3A5YTCMR)&text=5%20Year%20Treasury%20Rate%20is,long%20term%20average%20of%203.74%25.
- ↑ 21.0 21.1 https://valueinvesting.io/AMZN/valuation/wacc
- ↑ 22.0 22.1 https://valueinvesting.io/AMZN/valuation/wacc
- ↑ 23.0 23.1 https://www.theguardian.com/business/2023/jun/14/fed-interest-rate-pause-inflation#:~:text=US%20Federal%20Reserve%20officials%20have,year%20of%20consecutive%20rate%20increases.
- ↑ https://www.marketwatch.com/investing/stock/amzn
- ↑ https://www.shopify.com/blog/amazon-competitors
- ↑ https://finbox.com/NASDAQGS:AMZN/explorer/pe_ltm/
- ↑ https://www.macrotrends.net/stocks/charts/AMZN/amazon/eps-earnings-per-share-diluted
- ↑ 28.0 28.1 https://finance.yahoo.com/quote/AMZN/analysis/
- ↑ https://www.macrotrends.net/stocks/charts/AMZN/amazon/revenue