Company Overview
BP p.l.c. engages in the energy business worldwide. It operates through Gas & Low Carbon Energy, Oil Production & Operations, Customers & Products, and Rosneft segments. It produces and trades in natural gas; offers biofuels; operates onshore and offshore wind power, and solar power generating facilities; and provides de-carbonization solutions and services, such as hydrogen and carbon capture and storage. The company is also involved in the convenience and mobility business, which manages the sale of fuels to retail customers, convenience products, aviation fuels, and Castrol lubricants; and refining and trading of oil products, as well as operation of electric vehicle charging facilities. In addition, it produces and refines oil and gas; and invests in upstream, downstream, and alternative energy companies, as well as in advanced mobility, bio and low carbon products, carbon management, digital transformation, and power and storage areas. The company was founded in 1908 and is headquartered in London, the United Kingdom.
Industry Overview
BP operates in the global energy industry, where it is one of the leaders. It operates in all 3 major areas of the industry: power generations, transmission and distribution networks along with metering and sales.
Industry drivers
- Growing economy - an increasing number of factories, offices and other industrial institutions need energy supply.
- Growing population - increased usage of electricity, more vehicles being purchased and used all contribute to an increased demand for energy.
- Rise in urbanisation - increasing number of people move into cities and adopt a lifestyle with which energy consumption is higher.
Total Addressable Market
Here the total addressable market (TAM) is defined as the global power generation market and is estimated to be $1.94 trillion in size.
Serviceable Available Market
Here the serviceable available market (SAM) is defined as the global oil refinery market and is estimated to be $1.45 trillion in size.
Serviceable Obtainable Market
Here the serviceable obtainable market (SOM) is defined as the global oil refinery market and is estimated to be $1.45 trillion in size.
Competition
BP's main competitors include Equinor ASA, ConocoPhillips, Marathon Petroleum, Phillips 66 and Valero energy. With a market cap of $103.57 billion BP is second compared to it's competitors, losing only to ConocoPhillips with a market cap of $138.3 billion.
| Company | Market cap ($ billion) | P/E ratio | Revenue ($ billion) | 1 year price performance |
|---|---|---|---|---|
| BP | 103.57 | 5.87 | 241.4 | +14.70% |
| Equinor ASA | 95.31 | 3.98 | 150.81 | -19.7% |
| ConocoPhillips | 138.30 | 11.13 | 82.16B | +14.5% |
| Marathon Petroleum | 57.03 | 5.17 | 179.95B | +46.3% |
| Phillips 66 | 50.51 | 4.92 | 175.70B | +26.7% |
| Valero energy | 46.31 | 4.52 | 176.38B | +15.6% |
Operations
Management
Ownership Structure
Financials
Historical Financials
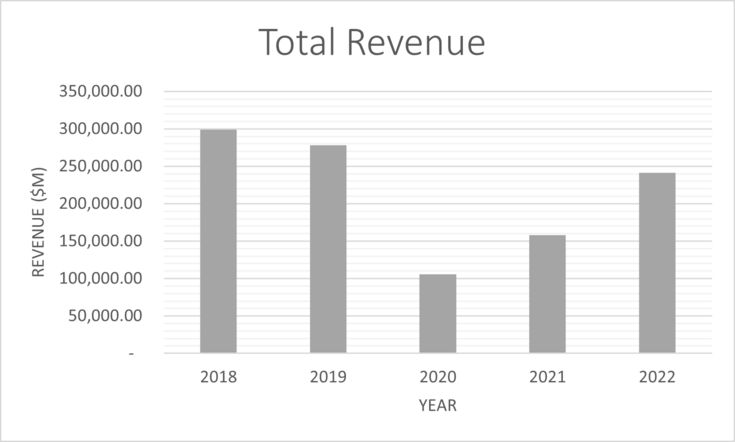
The table below shows revenue, EBIT and other financials for the previous 5 years. Revenue has shown an overall decline over the previous five years. The steep decline in 2020 was due to the global coronavirus pandemic. The jump in earnings from 2020 to 2021 and 2022 is due to the global volatility in oil prices as a result of the conflict in Ukraine. NCWC is non-cash working capital, and is calculated to be used in the DCF valuation below.
| Units ($m) | 2018 | 2019 | 2020 | 2021 | 2022 |
| Total Revenue | 298,756.00 | 278,397.00 | 105,944.00 | 157,739.00 | 241,392.00 |
| Purchases | 229,878.00 | 209,672.00 | 57,682.00 | 92,923.00 | 141,043.00 |
| P&M Expenses | 23,005.00 | 21,815.00 | 22,494.00 | 25,843.00 | 28,610.00 |
| D&A Expenses | 12,179.00 | 11,057.00 | 10,397.00 | 11,931.00 | 13,449.00 |
| EBIT | 18,237.00 | 18,073.00 | 482.00 | 12,237.00 | 43,972.00 |
| Depreciation | 15,457.00 | 17,780.00 | 14,889.00 | 14,805.00 | 14,318.00 |
| CapEx | - 16,707.00 | - 15,418.00 | - 12,306.00 | - 10,887.00 | - 12,069.00 |
| Current Assets | 71,310.00 | 82,059.00 | 72,982.00 | 92,590.00 | 107,688.00 |
| Cash | 21,340.00 | 20,965.00 | 29,527.00 | 26,221.00 | 23,907.00 |
| Current Liabilities | 68,237.00 | 73,595.00 | 59,799.00 | 80,287.00 | 99,018.00 |
| NCWC | - 18,267.00 | - 12,501.00 | - 16,344.00 | - 13,918.00 | - 15,237.00 |
| NCWC (inc/dec) | \ | - 5,766.00 | 3,843.00 | - 2,426.00 | 1,319.00 |
Notes - P&M = Production and Manufacturing, D&A = Distribution and Administration.
Forecasts
The following table shows how the financials have been forecast for a period of 10 years.
| Units ($m) | 2023 | 2024 | 2025 | 2026 | 2027 | 2028 | 2029 | 2030 | 2031 | 2032 |
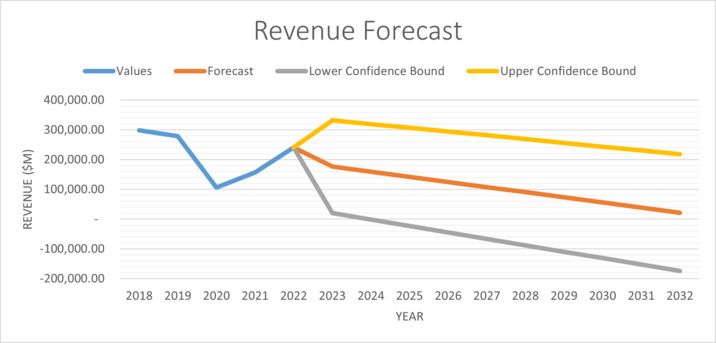
| Total Revenue | 331,884.34 | 319,540.81 | 307,093.20 | 294,550.32 | 281,919.91 | 269,208.77 | 256,422.93 | 243,567.76 | 230,648.06 | 217,668.16 |
| Purchases | 215,089.73 | 207,090.06 | 199,022.93 | 190,894.06 | 182,708.46 | 174,470.55 | 166,184.22 | 157,852.96 | 149,479.88 | 141,067.78 |
| P&M Expenses | 43,147.39 | 41,542.64 | 39,924.36 | 38,293.69 | 36,651.65 | 34,999.11 | 33,336.85 | 31,665.59 | 29,985.93 | 28,298.45 |
| D&A Expenses | 20,574.91 | 19,809.68 | 19,038.00 | 18,260.42 | 17,477.40 | 16,689.39 | 15,896.74 | 15,099.79 | 14,298.85 | 13,494.17 |
| EBIT | 39,104.56 | 40,274.04 | 36,820.05 | 37,957.65 | 34,474.42 | 35,585.12 | 32,077.04 | 33,164.70 | 29,635.21 | 30,702.93 |
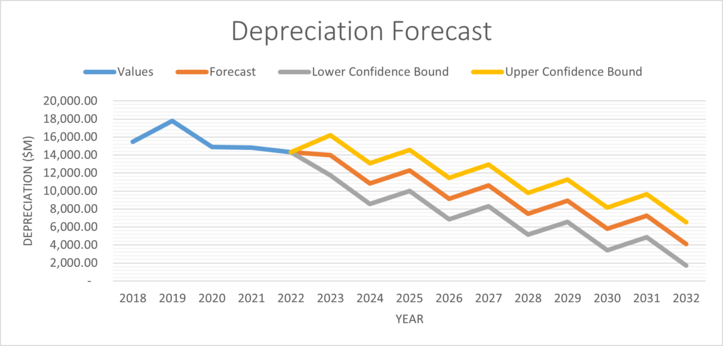
| Depreciation | 13,967.75 | 10,824.39 | 12,287.86 | 9,144.50 | 10,607.97 | 7,464.61 | 8,928.08 | 5,784.72 | 7,248.20 | 4,104.83 |
| CapEx | -16,095.57 | -15,017.62 | -13,971.98 | -12,959.48 | -11,980.90 | -11,036.89 | -10,128.07 | -9,254.97 | -8,418.08 | -7,617.84 |
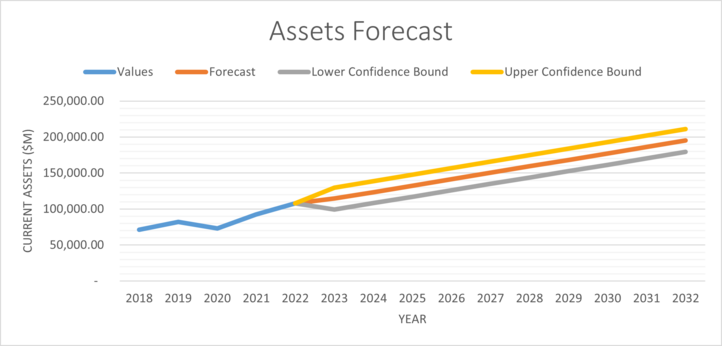
| Current Assets | 114,484.58 | 123,441.44 | 132,398.29 | 141,355.15 | 150,312.00 | 159,268.86 | 168,225.71 | 177,182.57 | 186,139.43 | 195,096.28 |
| Cash | 34,184.42 | 32,913.03 | 31,630.91 | 30,338.98 | 29,038.03 | 27,728.77 | 26,411.82 | 25,087.72 | 23,756.98 | 22,420.04 |
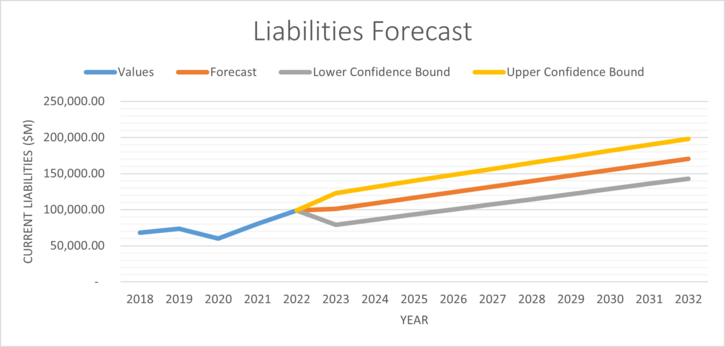
| Current Liabilities | 101,117.57 | 108,833.19 | 116,548.82 | 124,264.45 | 131,980.07 | 139,695.70 | 147,411.33 | 155,126.95 | 162,842.58 | 170,558.21 |
| NCWC | -20,817.41 | -18,304.78 | -15,781.44 | -13,248.28 | -10,706.10 | -8,155.62 | -5,597.43 | -3,032.11 | -460.14 | 2,118.03 |
| NCWC (inc/dec) | 5,580.41 | -2,512.63 | -2,523.35 | -2,533.16 | -2,542.17 | -2,550.49 | -2,558.18 | -2,565.32 | -2,571.97 | -2,578.17 |
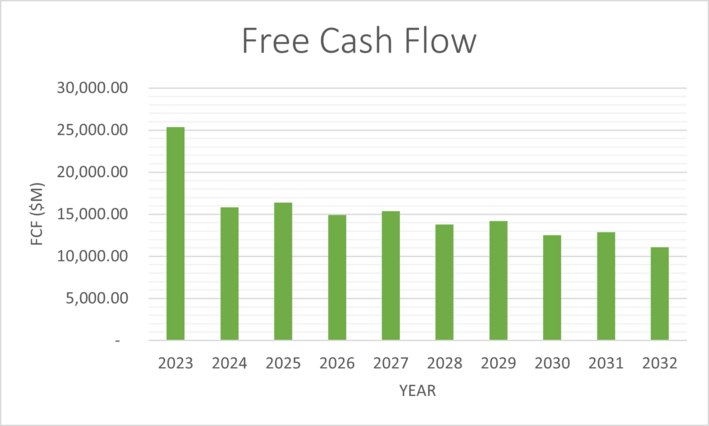
| FCF | 25,351.15 | 15,847.60 | 16,411.76 | 14,908.14 | 15,390.58 | 13,804.90 | 14,204.97 | 12,536.66 | 12,853.86 | 11,102.46 |
The following table and graphs show the assumptions used to forecast financials for the DCF valuation.
| Assumptions | 2018 | 2019 | 2020 | 2021 | 2022 | 2023 | 2024 | 2025 | 2026 | 2027 | 2028 | 2029 | 2030 | 2031 | 2032 |
| Purchases % of revenue | 76.9% | 75.3% | 54.4% | 58.9% | 58.4% | 64.8% | 64.8% | 64.8% | 64.8% | 64.8% | 64.8% | 64.8% | 64.8% | 64.8% | 64.8% |
| P&M % of revenue | 7.7% | 7.8% | 21.2% | 16.4% | 11.9% | 13.0% | 13.0% | 13.0% | 13.0% | 13.0% | 13.0% | 13.0% | 13.0% | 13.0% | 13.0% |
| D&A Expenses % of revenue | 4.1% | 4.0% | 9.8% | 7.6% | 5.6% | 6.2% | 6.2% | 6.2% | 6.2% | 6.2% | 6.2% | 6.2% | 6.2% | 6.2% | 6.2% |
| CapEx % of revenue | 5.6% | 5.5% | 11.6% | 6.9% | 5.0% | 4.8% | 4.7% | 4.5% | 4.4% | 4.2% | 4.1% | 3.9% | 3.8% | 3.6% | 3.5% |
| Cash % of revenue | 7.1% | 7.5% | 27.9% | 16.6% | 9.9% | 10.3% | 10.3% | 10.3% | 10.3% | 10.3% | 10.3% | 10.3% | 10.3% | 10.3% | 10.3% |
The purchases forecast was averaged over the previous years, and this average was applied going forwards. The same was done for P&M expenses, D&A expenses and Cash. CapEx displayed a declining pattern, and this is also in-line with bp's targets of reducing CapEx to 2030.
The following shows graphs for other variables that were forecast.
