BP p.l.c.
 | |
| Type | Publicly Limited Company |
|---|---|
| LSE: BP NYSE: BP | |
| Industry | Oil and Gas |
| Founded | 1909 |
| Headquarters | London, United Kingdom |
| Products | Gas & Petrol stations, fuel & credit cards, lubricants, aral (Europe), ampm (USA) |
| Revenue | US$241 billion (2022) |
| US$44 billion (2022) | |
| US$28 billion (2022) | |
Number of employees | 70,000 |
Company Overview
BP p.l.c. engages in the energy business worldwide. It operates through Gas & Low Carbon Energy, Oil Production & Operations, Customers & Products, and Rosneft segments. It produces and trades in natural gas; offers biofuels; operates onshore and offshore wind power, and solar power generating facilities; and provides de-carbonization solutions and services, such as hydrogen and carbon capture and storage. The company is also involved in the convenience and mobility business, which manages the sale of fuels to retail customers, convenience products, aviation fuels, and Castrol lubricants; and refining and trading of oil products, as well as operation of electric vehicle charging facilities. In addition, it produces and refines oil and gas; and invests in upstream, downstream, and alternative energy companies, as well as in advanced mobility, bio and low carbon products, carbon management, digital transformation, and power and storage areas. The company was founded in 1908 and is headquartered in London, the United Kingdom.
"BP is a focused oil and gas business actively managing our portfolio of Beals projects refineries plants and networks to maximize value safely and responsibly" -- BP
Key areas of business edit edit source
- Upstream Operations
- BP is involved in the exploration, drilling and production of oil and natural gas reserves.
- The company operates in various offshore and onshore locations round the world, with a focus on both conventional and unconventional resources.
- Downstream Operations
- In the downstream sector, BP is engaged in refining crude oil into various refined products such as gasoline, diesel, jet fuel, and petrochemicals.
- They also manage a network of retail outlets that sell these products to consumers.
- Alternative Energy
- Recognising the need for sustainable and cleaner energy sources, BP has been investing in renewable and alternative energy technologies.
- This includes wind, solar, biofuels, and advanced mobility solutions.
- Trading and Marketing
- BP has a global trading and marketing presence, allowing them to efficiently buy and sell energy products in various markets.
- This includes trading crude oil, refined products, natural gas, and other commodities.
- Safety and Environmental Responsibility
- BP places a strong emphasis on safety and environmental sustainability, especially in the wake of the Deepwater Horizon oil spill in 2010.
- BP places a strong emphasis on safety and environmental sustainability, especially in the wake of the Deepwater Horizon oil spill in 2010.
Key figures edit edit source
- 62 countries of operations
- 67,600 Employees
- 2.3 Million barrels of oil equivalent per day – upstream production
- 20,650 Retail sites
Industry Overview edit edit source
BP operates in the global energy industry, where it is one of the leaders. It operates in all 3 major areas of the industry: power generations, transmission and distribution networks along with metering and sales.
Industry drivers edit edit source
- Growing economy - an increasing number of factories, offices and other industrial institutions need energy supply.
- Growing population - increased usage of electricity, more vehicles being purchased and used all contribute to an increased demand for energy.
- Rise in urbanisation - increasing number of people move into cities and adopt a lifestyle with which energy consumption is higher.
Total Addressable Market edit edit source
Here the total addressable market (TAM) is defined as the global power generation market and is estimated to be $1.94 trillion in size.[1]
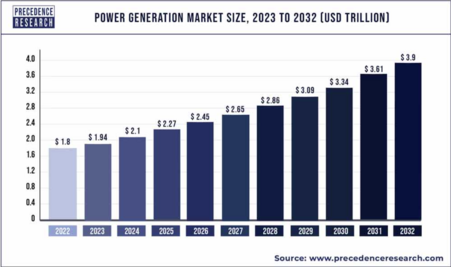
It is forecasted to continue growing, reaching $3.9 trillion by 2032.[1]
Serviceable Available Market edit edit source
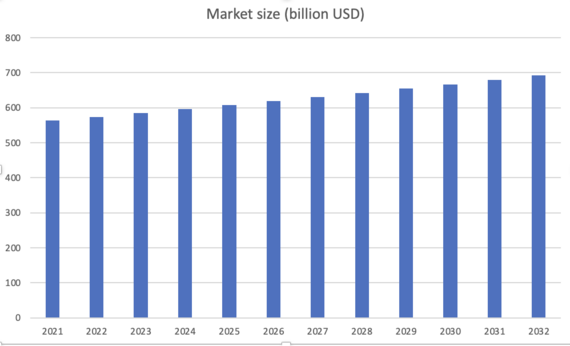
Here the serviceable available market (SAM) is defined as the global oil refinery market and is estimated to be $563.3 billion in size.
Serviceable Obtainable Market edit edit source
Here the serviceable obtainable market (SOM) is defined as the global oil refinery market and is estimated to be $563.3 billion in size.
The global oil refinery market is expected to grow with a compound annual growth rate of 1.9% until 2032. [2]
Competition edit edit source
BP's main competitors include Equinor ASA, ConocoPhillips, Marathon Petroleum, Phillips 66 and Valero energy. With a market cap of $103.57 billion BP is second compared to it's competitors, losing only to ConocoPhillips with a market cap of $138.3 billion.
| Company | Market cap ($ billion) | P/E ratio | Revenue ($ billion) | 1 year price performance |
|---|---|---|---|---|
| BP | 103.57 | 5.87 | 241.4 | +14.70% |
| Equinor ASA | 95.31 | 3.98 | 150.81 | -19.7% |
| ConocoPhillips | 138.30 | 11.13 | 82.16B | +14.5% |
| Marathon Petroleum | 57.03 | 5.17 | 179.95B | +46.3% |
| Phillips 66 | 50.51 | 4.92 | 175.70B | +26.7% |
| Valero energy | 46.31 | 4.52 | 176.38B | +15.6% |
Operations edit edit source
[3]Business Overview & Industry Chain (youtube) edit edit source
- Exploration: one of BP's distinctive strengths
- After negotiating and acquiring the right to explore, the firm deploys its specialised skills, especially Seismic Imaging, to locate oil and gas sources, which is usually miles beneath the earth surface / sedbed
- Development & Extraction
- BP specialises in deep water operations and giant fields: Prudhoe Bay in Alaska, to Ramallah in Iraq, to PSVM in Angola
- the next step is either sell the raw oil/gas to the market, or supply it to downsteam operations
- production rate: 2.3 Million barrels of oil per day
- reverses: £11 Billion, in key locations around the world; Angola, Azerbaijan, North Sea(UK), Gulf of Mexico(USA)
- several complex gas value chains, supplying it to Asia, Europe, and other markets worldwide
- Transportation & Trading
- extensive transport network: ships, trains, trucks, and thousands of miles of pipelines
- expert traders based in key market around the world to buy and sell to regional and international markets supply and trading is closely linked with our portfolio of high-quality downstream activities that add value by turning oil and gas safely and efficiently into premium products
- Manufacturing
- refineries apply the latest technology and understanding to refine process and blend hydrocarbons to make fuels lubricants and petrochemicals
- Marketing
- BP supplies consumers and other end-users with energy for heat and light, advanced lubricants to keep engines moving, and premium fuels for transportation
- world-leading processes produce petrochemicals such as acetic acid from which a wide variety of everyday items are made
- Investment
- BP's lower carbon businesses are managed through their alternative energy team
- the team develop and invest in biofuels with a focus on:
- integrating them into the hydrocarbon value chain
- operating a wind business in the United States
[4]Business Groups edit edit source
- Gas & low carbon energy
- Creating low carbon energy solutions. Integrating our existing natural gas capabilities with power trading and growth in low carbon businesses and markets, including wind, solar, hydrogen and carbon capture and storage (CCS).
- Creating value through
- Integrated gas and LNG businesses.
- Onshore and offshore wind.
- Our 50% stake in Lightsource bp.
- Hydrogen and CCS.
- Gas trading and power trading, and marketing of both renewable and non-renewable power.
- Production & operations
- The operational heart of bp, producing the hydrocarbon energy and products the world wants and needs – safely and efficiently.
- Finding and developing hydrocarbon resources, with selective exploration mostly focused near our existing hubs
- Operating oil and gas production assets
- Operating refineries, terminals and pipelines
- Deploying technical capability across hydrocarbons and low carbon businesses
- The operational heart of bp, producing the hydrocarbon energy and products the world wants and needs – safely and efficiently.
- Customers & products
- Focusing on customers as the driving force for innovating new business models and service platforms to deliver the convenience, mobility and energy products and services of today and the future.
- Differentiated convenience and fuel offers at our retail sites, including snacks, ready meals and coffee.
- EV charging businesses.
- Castrol lubricants and e-fluids brand sold through numerous channels.
- Aviation business.
- B2B and midstream businesses.
- Refining & oil trading – our products businesses.
- Bioenergy – our biogas and biofuels businesses.
- Optimizing across integrated fuels value chain.
- Focusing on customers as the driving force for innovating new business models and service platforms to deliver the convenience, mobility and energy products and services of today and the future.
[5]Sustainability Strategy -- "The Three Pillars" edit edit source
- Resilient Hydrocarbons
- Target business: Oil and Gas
- Target source: Bioenergy
- Convenience and Mobility
- Target Business: Retail; Castrol, Aviation, and B2B/Midstream
- Target source: Convenience & EV Charging
- Low Carbon Energy
- Target Source: Hydrogen & Renewables and Power
[6]Productions & Operations (site) edit edit source
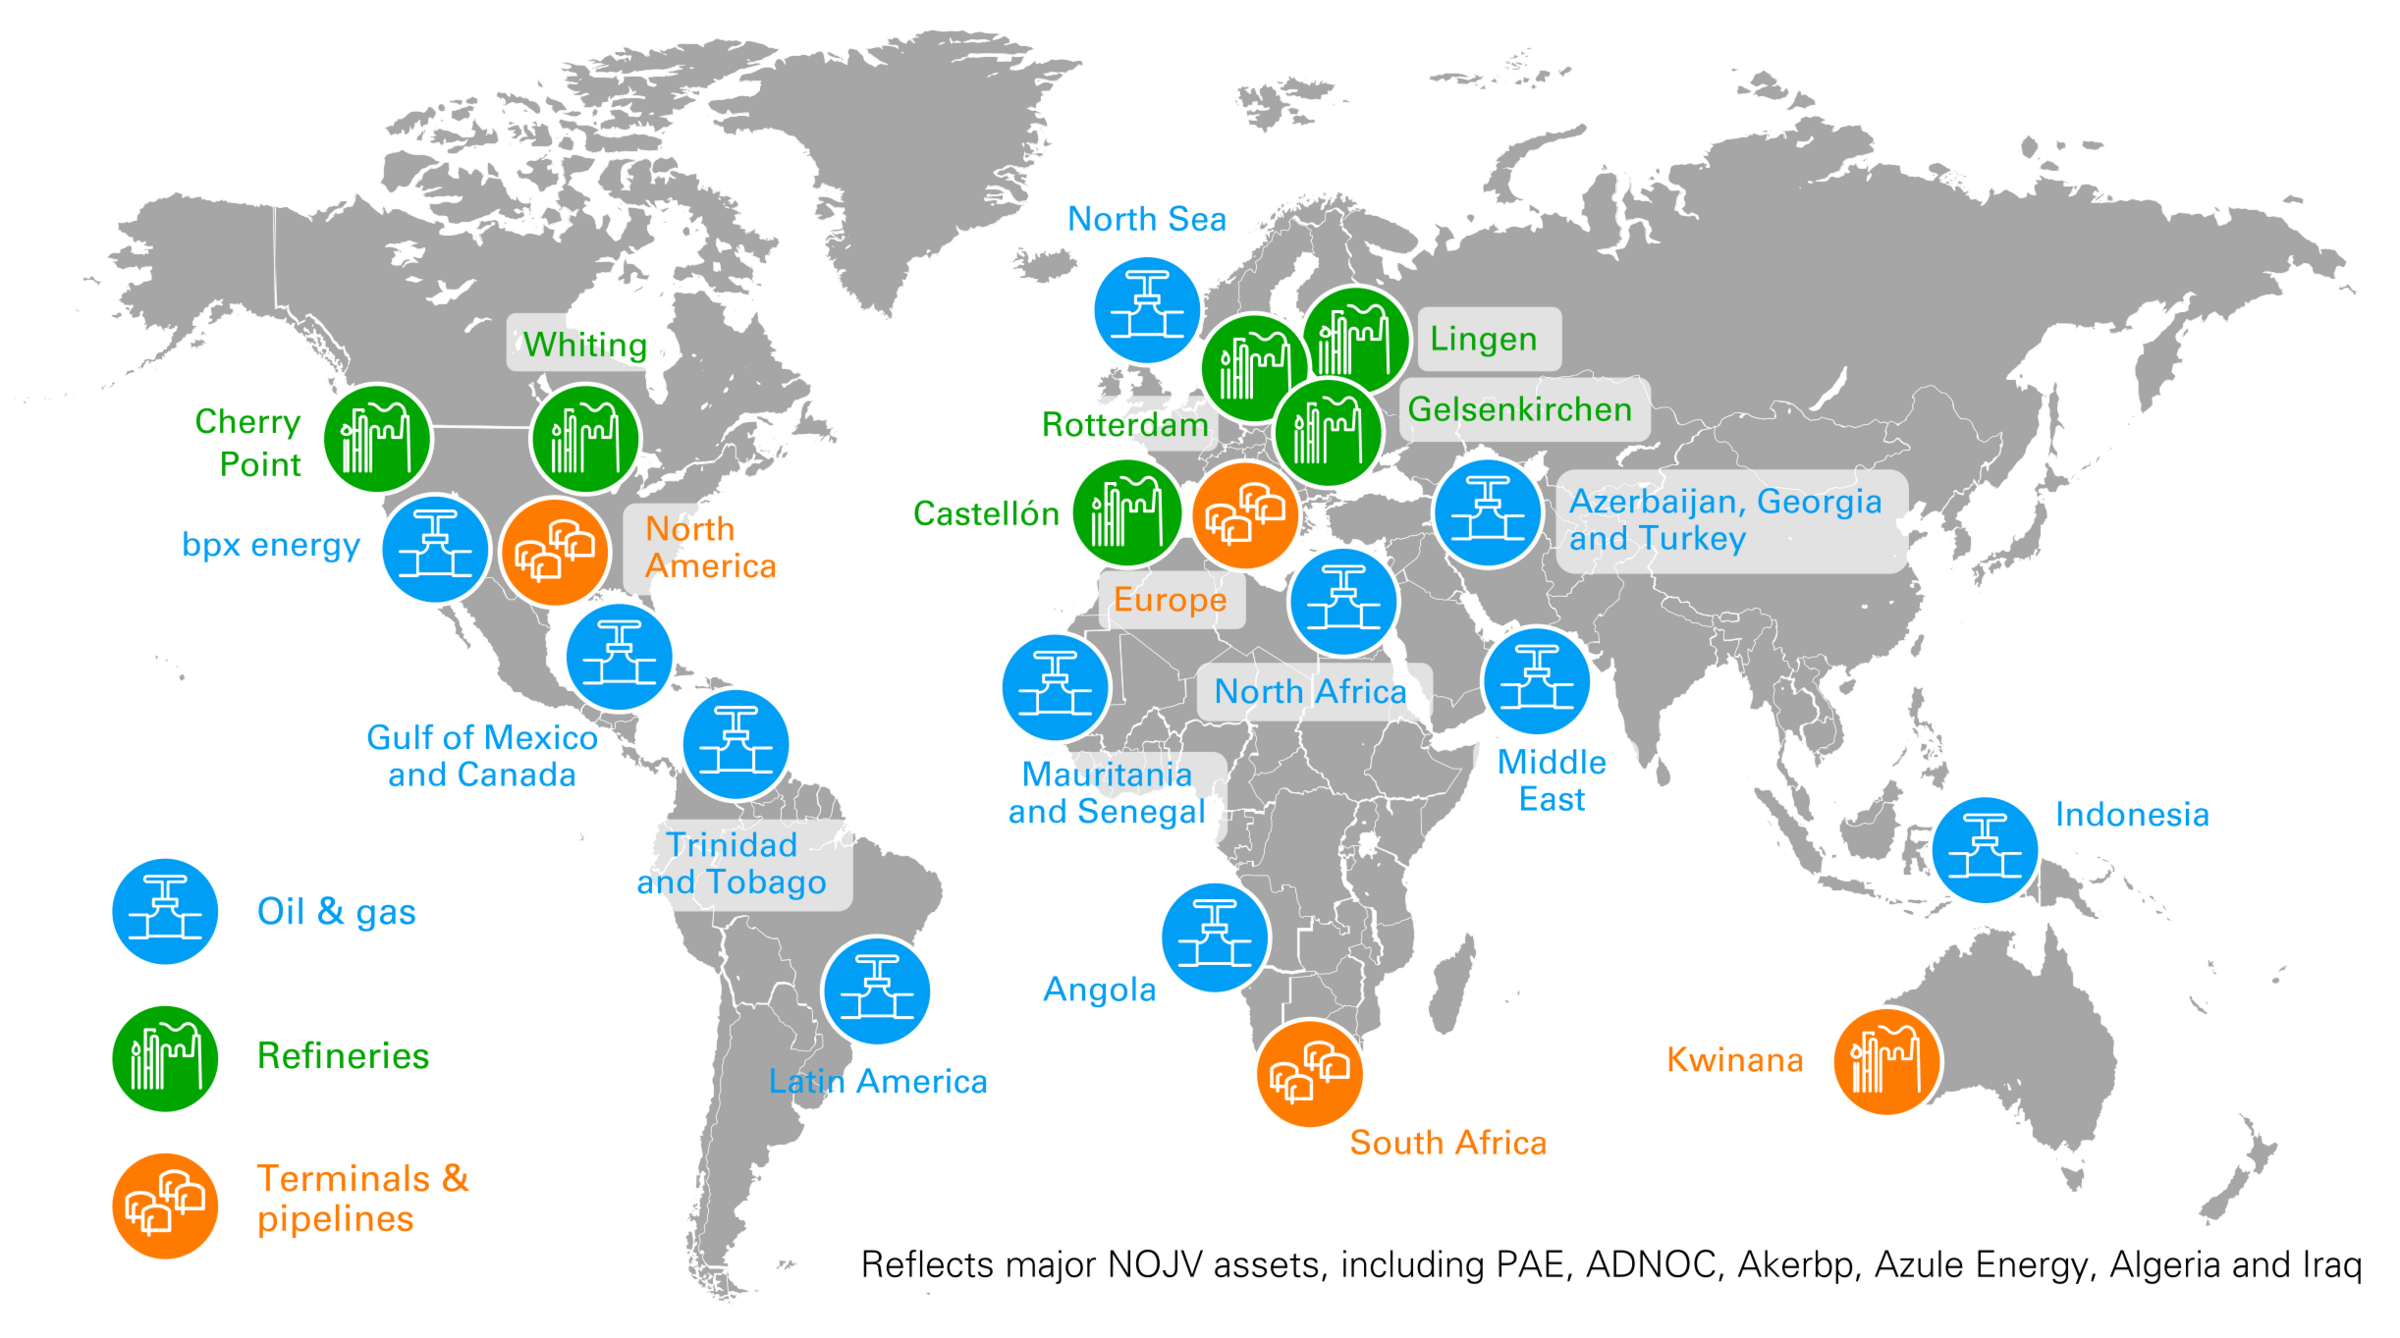
Mission: find and develop hydrocarbon resources, operate oil and gas production assets, as well as refineries, pipelines and terminals around the world.
[7][8]Products & Offerings edit edit source
Global Consumer Project edit edit source
- BP Gas/Petrol Stations
- The UK: over 1,200 bp branded service stations across the UK serving more than seven million customers each week with quality fuels, including bp Ultimate, and everyday convenience.
- Fuel Cards & Credit Cards
- Lubricants: BP and Castrol are leading manufacturer of motor oil and lubricants
- Aral(Europe): 2,500 service stations, Aral is one of the most trusted brands in Germany, Luxembourg and beyond
- ampm(USA): US retail brand ampm, with nearly a thousand stores covering the west coast of America
- other business sites
- Air bp, bp Bunge Bioenergia, Global energy trading, bp Midstream Partners, bp Pulse, bp Marine, bp Shipping, bp Solar Warranty, bp Target Neutral, bp Retail Energy
Customer Business(Product) edit edit source
- Air BP
- Leading supplier of aviation fuel products and services, fuelling more than 6,000 flights per day at 700+ locations in 50 countries. Alongside others in the industry, BP is working hard to increase the supply and demand of sustainable aviation fuel – a key route to reducing carbon emissions in aviation.
- Castrol
- World’s leading lubricant brands, serves customers/consumers in automotive, marine, industrial and energy sectors.
- Recognised for innovation and high performance, Castrol branded products and services keep things moving, whether an electric vehicle, a Formula One car, a wind turbine, a production line or the Mars rover. Castrol also operates a network of auto service workshops.
- Mobililty & convenience
- 20,500 branded retail sites worldwide are a familiar sight at the roadside.
- Offer high-quality fuels at the pump and in some countries, fast electric vehicle chargers on our forecourts.
- Inside our convenience stores, we offer hot drinks and snacks in our wild bean cafés, while also providing food for later, with retail partners such as M&S in the UK or REWE-to-go in Germany.
- BP Pulse
- Providing electric vehicle (EV) charging solutions on-the-go and for fleets. We’re rolling out fast and convenient charge points at bp retail sites, dedicated charging hubs and at key destinations. Our main markets are the UK, Germany, China and the US, with more to come including Spain and Australia. The bp pulse fleet team is delivering software-based solutions to our global partners, supporting fleets’ transition to EVs.
- Fuel supply & midstream
- "Moving the products that keep our customers moving" – by pipeline or truck, rail or ship. We safely deliver energy to where it is needed, while developing low carbon biofuels for the future.
[9]Recent Projects edit edit source
- 2021 Green hydrogen project in Teesside, UK: This project will produce green hydrogen from renewable energy sources, such as wind and solar. The hydrogen will be used to power buses, trucks, and other vehicles.
- 2021-22 Offshore wind projects in the US East Coast: BP is partnering with Equinor to develop four offshore wind assets in two leases off the US East Coast. These projects have the potential to power 2 million homes.
- 2022 Northern Endurance Partnership (NEP): This project will transport CO2 from the Humber and Teesside regions of the UK to a storage site in the North Sea. The project is expected to reduce CO2 emissions by 10 million tonnes per year.
- 2022 Partnership with Indian digital services leader: BP has partnered with the Indian digital services leader to drive integrated energy offers to reduce emissions at campuses and cities. The partnership will focus on developing digital solutions to improve energy efficiency and reduce emissions.
- 2023 Agreement to increase renewable power supply to Amazon in Europe: BP has agreed to increase the renewable power it will supply Amazon in Europe. The agreement will help Amazon meet its goal of being net-zero carbon by 2040.
In addition to these projects, BP is also investing in research and development of new technologies, such as carbon capture and storage. The company is also working to improve its safety culture and reduce its environmental impact.
Leadership Team [10] edit edit source
Ownership Structure edit edit source
| Name | Equities | % | Valuation |
|---|---|---|---|
| SSgA fund management | 22,729,410 | 0.78% | £ 107.46 M |
| Arrowstreet Capital LP | 22,601,056 | 0.77& | £ 106.86 M |
| Fisher Asset Management | 16,988,964 | 0.58% | £ 80.32 M |
| Acadian Asset Management | 13,121,799 | 0.45% | £ 62.04 M |
| Dimensional Fund Advisors LP | 11,042,101 | 0.38% | £ 52.21 M |
| Boston Partners Global Investors | 9,243,957 | 0.32% | £ 43.71 M |
| Wellington Management Co. LLP | 9,149,979 | 0.31% | £ 43.26 M |
| Goldman Sachs Asset Management LP | 7,165,086 | 0.25% | £ 33.88 M |
| Two Sigma Advisers LP | 7,044,126 | 0.24% | £ 33.30 M |
| Morgan Stanley Smith Barney | 7,021,946 | 0.24% | £ 33.20 M |
Financials edit edit source
Historical Financials edit edit source
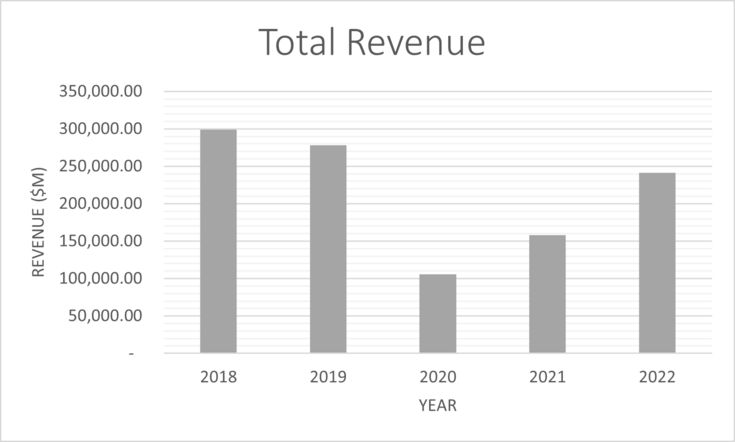
The table below shows revenue, EBIT and other financials for the previous 5 years. Revenue has shown an overall decline over the previous five years. The steep decline in 2020 was due to the global coronavirus pandemic. The jump in earnings from 2020 to 2021 and 2022 is due to the global volatility in oil prices as a result of the conflict in Ukraine. NCWC is non-cash working capital, and is calculated to be used in the DCF valuation below.
| Units ($m) | 2018 | 2019 | 2020 | 2021 | 2022 |
| Total Revenue | 298,756.00 | 278,397.00 | 105,944.00 | 157,739.00 | 241,392.00 |
| Purchases | 229,878.00 | 209,672.00 | 57,682.00 | 92,923.00 | 141,043.00 |
| P&M Expenses | 23,005.00 | 21,815.00 | 22,494.00 | 25,843.00 | 28,610.00 |
| D&A Expenses | 12,179.00 | 11,057.00 | 10,397.00 | 11,931.00 | 13,449.00 |
| EBIT | 18,237.00 | 18,073.00 | 482.00 | 12,237.00 | 43,972.00 |
| Depreciation | 15,457.00 | 17,780.00 | 14,889.00 | 14,805.00 | 14,318.00 |
| CapEx | - 16,707.00 | - 15,418.00 | - 12,306.00 | - 10,887.00 | - 12,069.00 |
| Current Assets | 71,310.00 | 82,059.00 | 72,982.00 | 92,590.00 | 107,688.00 |
| Cash | 21,340.00 | 20,965.00 | 29,527.00 | 26,221.00 | 23,907.00 |
| Current Liabilities | 68,237.00 | 73,595.00 | 59,799.00 | 80,287.00 | 99,018.00 |
| NCWC | - 18,267.00 | - 12,501.00 | - 16,344.00 | - 13,918.00 | - 15,237.00 |
| NCWC (inc/dec) | \ | - 5,766.00 | 3,843.00 | - 2,426.00 | 1,319.00 |
Notes - P&M = Production and Manufacturing, D&A = Distribution and Administration.
Revenue by Segment[11] edit edit source
The following table shows revenue by each respective segment, units are $ millions.
| Segment | 2022 | 2021 | 2020 |
| Oil | 33,193 | 24,519 | 17,234 |
| Gas and low carbon | 56,255 | 30,840 | 16,275 |
Oil revenue has increased at an average of 38.8% over the previous 3 years, whereas gas and low carbon revenue has increased at a much greater rate of 86% over the last three years.
Forecasts edit edit source
The following table shows how the financials have been forecast for a period of 10 years.
| Units ($m) | 2023 | 2024 | 2025 | 2026 | 2027 | 2028 | 2029 | 2030 | 2031 | 2032 |
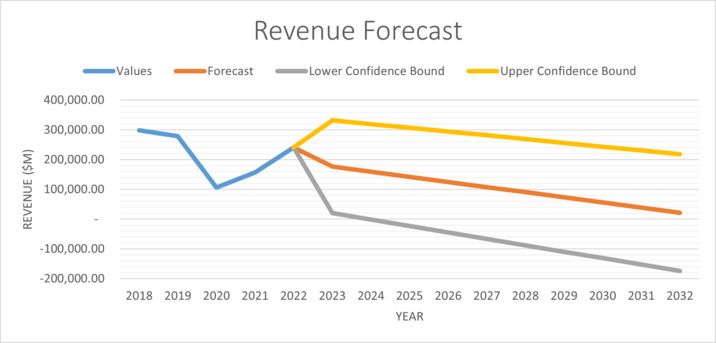
| Total Revenue | 331,884.34 | 319,540.81 | 307,093.20 | 294,550.32 | 281,919.91 | 269,208.77 | 256,422.93 | 243,567.76 | 230,648.06 | 217,668.16 |
| Purchases | 215,089.73 | 207,090.06 | 199,022.93 | 190,894.06 | 182,708.46 | 174,470.55 | 166,184.22 | 157,852.96 | 149,479.88 | 141,067.78 |
| P&M Expenses | 43,147.39 | 41,542.64 | 39,924.36 | 38,293.69 | 36,651.65 | 34,999.11 | 33,336.85 | 31,665.59 | 29,985.93 | 28,298.45 |
| D&A Expenses | 20,574.91 | 19,809.68 | 19,038.00 | 18,260.42 | 17,477.40 | 16,689.39 | 15,896.74 | 15,099.79 | 14,298.85 | 13,494.17 |
| EBIT | 39,104.56 | 40,274.04 | 36,820.05 | 37,957.65 | 34,474.42 | 35,585.12 | 32,077.04 | 33,164.70 | 29,635.21 | 30,702.93 |
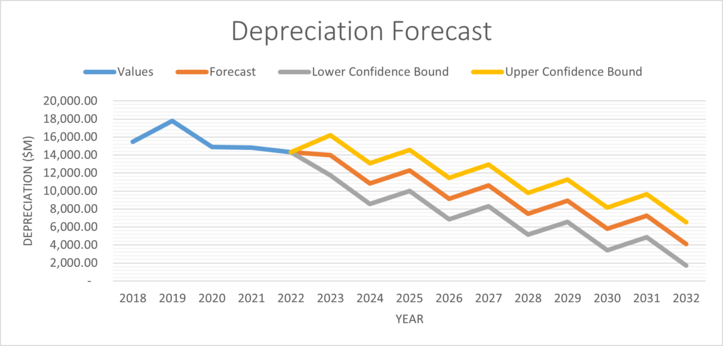
| Depreciation | 13,967.75 | 10,824.39 | 12,287.86 | 9,144.50 | 10,607.97 | 7,464.61 | 8,928.08 | 5,784.72 | 7,248.20 | 4,104.83 |
| CapEx | -16,095.57 | -15,017.62 | -13,971.98 | -12,959.48 | -11,980.90 | -11,036.89 | -10,128.07 | -9,254.97 | -8,418.08 | -7,617.84 |
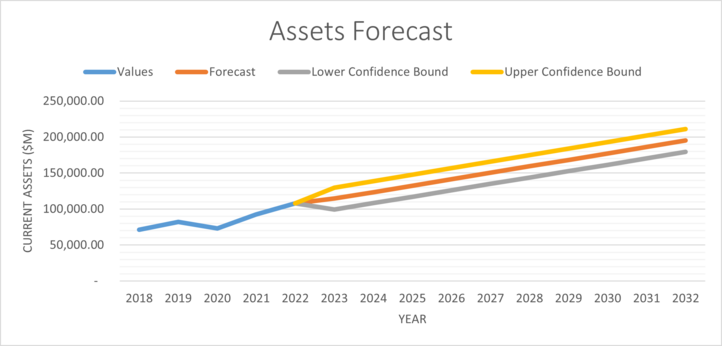
| Current Assets | 114,484.58 | 123,441.44 | 132,398.29 | 141,355.15 | 150,312.00 | 159,268.86 | 168,225.71 | 177,182.57 | 186,139.43 | 195,096.28 |
| Cash | 34,184.42 | 32,913.03 | 31,630.91 | 30,338.98 | 29,038.03 | 27,728.77 | 26,411.82 | 25,087.72 | 23,756.98 | 22,420.04 |
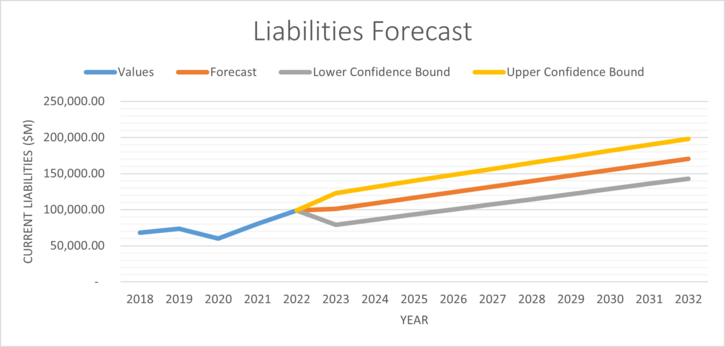
| Current Liabilities | 101,117.57 | 108,833.19 | 116,548.82 | 124,264.45 | 131,980.07 | 139,695.70 | 147,411.33 | 155,126.95 | 162,842.58 | 170,558.21 |
| NCWC | -20,817.41 | -18,304.78 | -15,781.44 | -13,248.28 | -10,706.10 | -8,155.62 | -5,597.43 | -3,032.11 | -460.14 | 2,118.03 |
| NCWC (inc/dec) | 5,580.41 | -2,512.63 | -2,523.35 | -2,533.16 | -2,542.17 | -2,550.49 | -2,558.18 | -2,565.32 | -2,571.97 | -2,578.17 |
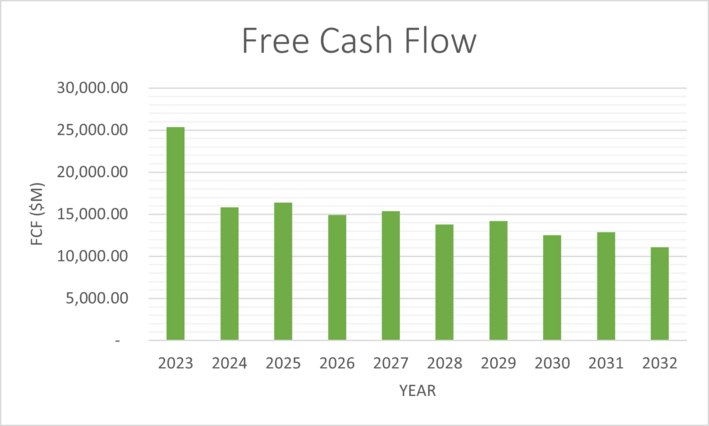
| FCF | 25,351.15 | 15,847.60 | 16,411.76 | 14,908.14 | 15,390.58 | 13,804.90 | 14,204.97 | 12,536.66 | 12,853.86 | 11,102.46 |
The following table and graphs show the assumptions used to forecast financials for the DCF valuation.
| Assumptions | 2018 | 2019 | 2020 | 2021 | 2022 | 2023 | 2024 | 2025 | 2026 | 2027 | 2028 | 2029 | 2030 | 2031 | 2032 |
| Purchases % of revenue | 76.9% | 75.3% | 54.4% | 58.9% | 58.4% | 64.8% | 64.8% | 64.8% | 64.8% | 64.8% | 64.8% | 64.8% | 64.8% | 64.8% | 64.8% |
| P&M % of revenue | 7.7% | 7.8% | 21.2% | 16.4% | 11.9% | 13.0% | 13.0% | 13.0% | 13.0% | 13.0% | 13.0% | 13.0% | 13.0% | 13.0% | 13.0% |
| D&A Expenses % of revenue | 4.1% | 4.0% | 9.8% | 7.6% | 5.6% | 6.2% | 6.2% | 6.2% | 6.2% | 6.2% | 6.2% | 6.2% | 6.2% | 6.2% | 6.2% |
| CapEx % of revenue | 5.6% | 5.5% | 11.6% | 6.9% | 5.0% | 4.8% | 4.7% | 4.5% | 4.4% | 4.2% | 4.1% | 3.9% | 3.8% | 3.6% | 3.5% |
| Cash % of revenue | 7.1% | 7.5% | 27.9% | 16.6% | 9.9% | 10.3% | 10.3% | 10.3% | 10.3% | 10.3% | 10.3% | 10.3% | 10.3% | 10.3% | 10.3% |
The purchases forecast was averaged over the previous years, and this average was applied going forwards. The same was done for P&M expenses, D&A expenses and Cash. CapEx displayed a declining pattern, and this is also in-line with bp's targets of reducing CapEx to 2030.
The following shows graphs for other variables that were forecast.
Valuations edit edit source
WACC edit edit source
| Risk Free Rate of Return | 4.5%[12] |
| Beta | 1.17[13] |
| Market Rate of Return | 7.4%[14] |
| Cost of Equity | 7.9% |
| Credit Spread | 1.42%[15] |
| Cost of Debt | 3.3% |
| Shares Outstanding | 17,270.00[11] |
| Share Price | $ 6.13[13] |
| Equity | 105,865.10 |
| Total Debt | 60,699.00 |
| Weighted Average Maturity | 14.00[11] |
| Interest Expense | 1,632.00[11] |
| Debt | 56,422.10 |
| E/D+E | 65.2% |
| D/D+E | 34.8% |
| WACC | 5.8% |
The WACC for bp used in the DCF valuation was 5.8%, note the share price is of bp on it's primary listing, the London stock exchange. The share price used was at market close on 11/08/2023. The price has been converted from GBP to USD for ease of calculation.
DCF edit edit source
Units are in $ millions.
| Units ($m) | 2023 | 2024 | 2025 | 2026 | 2027 | 2028 | 2029 | 2030 | 2031 | 2032 |
| FCF | 25,351.15 | 15,847.60 | 16,411.76 | 14,908.14 | 15,390.58 | 13,804.90 | 14,204.97 | 12,536.66 | 12,853.86 | 11,102.46 |
| Discount Factor | 0.9783 | 0.9248 | 0.8741 | 0.8262 | 0.7810 | 0.7382 | 0.6978 | 0.6596 | 0.6234 | 0.5893 |
| Present Value of FCF | 24,801.88 | 14,655.09 | 14,345.57 | 12,317.54 | 12,019.69 | 10,190.83 | 9,911.85 | 8,268.64 | 8,013.52 | 6,542.55 |
The effective tax rate used in all calculations was set at 44%, the terminal growth rate was set at 2.3%, equivalent to the annual FTSE 100 rate of return. The following table shows the result of the 10 year DCF valuation of bp.
| Growth Rate | 2.3% |
| Terminal Value | 325,041.40 |
| Present Value of Terminal Value | 191,543.05 |
| Enterprise Value | 312,610.21 |
| Equity Value | 281,496.21 |
| Share Price | $ 16.30 |
The DCF calculation results in an implied share price of $16.30, indicating that the company and stock is undervalued. There is a potential upside of 103%, or an annualised share price gain of 10.3%.
The following table shows a sensitivity analysis carried out to show share price behaviour in a range of WACC and growth rate environments.
| $ 16.30 | WACC | |||||||||
| Growth Rate | 4.0% | 4.5% | 5.0% | 5.5% | 6.0% | 6.5% | 7.0% | 7.5% | 8.0% | |
| 1.0% | $ 20.67 | $ 17.83 | $ 15.68 | $ 14.01 | $ 12.67 | $ 11.57 | $ 10.65 | $ 9.86 | $ 9.19 | |
| 1.5% | $ 23.76 | $ 19.94 | $ 17.21 | $ 15.15 | $ 13.55 | $ 12.26 | $ 11.20 | $ 10.31 | $ 9.56 | |
| 2.0% | $ 28.38 | $ 22.90 | $ 19.24 | $ 16.62 | $ 14.64 | $ 13.10 | $ 11.86 | $ 10.84 | $ 9.99 | |
| 2.5% | $ 36.09 | $ 27.35 | $ 22.09 | $ 18.57 | $ 16.05 | $ 14.15 | $ 12.67 | $ 11.48 | $ 10.50 | |
| 3.0% | $ 51.51 | $ 34.75 | $ 26.36 | $ 21.31 | $ 17.93 | $ 15.51 | $ 13.68 | $ 12.26 | $ 11.11 | |
| 3.5% | $ 97.78 | $ 49.57 | $ 33.47 | $ 25.41 | $ 20.56 | $ 17.31 | $ 14.98 | $ 13.23 | $ 11.86 | |
| 4.0% | - | $ 94.01 | $ 47.70 | $ 32.25 | $ 24.50 | $ 19.84 | $ 16.72 | $ 14.48 | $ 12.80 | |
Relative Valuation edit edit source
The following table compares bp to it's major competitors in the oil and gas industry globally.
| Company | P/E | EPS | Dividend | Dividend Yield | Dividend Growth | ROE | ROA | ROI |
| bp | x4.04 | $0.15 | $0.24 | 0.08% | -9.55% | 29.92% | 7.44% | 12.08% |
| Shell | x5.29 | $5.71 | $1.04 | 0.06% | -11.21% | 15.22% | 6.78% | 9.10% |
| Exxon | x8.38 | $13.25 | $3.55 | 5.40% | 3.02% | 27.47% | 14.56% | 18.54% |
| Chevron | x8.97 | $18.28 | $5.68 | 4.37% | 5.63% | 19.35% | 11.86% | 13.78% |
| Total | x7.84 | $7.85 | $4.08 | 7.06% | 6.51% | 16.70% | 6.50% | 10.29% |
| China Pet. Corp. | x10.63 | $0.08 | $0.05 | 7.72% | -6.62% | 7.97% | 3.58% | 6.19% |
| Petrobras | x2.12 | $2.91 | $3.36 | 18.99% | - | 40.03% | 15.74% | 18.82% |
| Equinor | x3.38 | $9.03 | $2.9 | 0.52% | 26.64% | 52.93% | 16.48% | 22.71% |
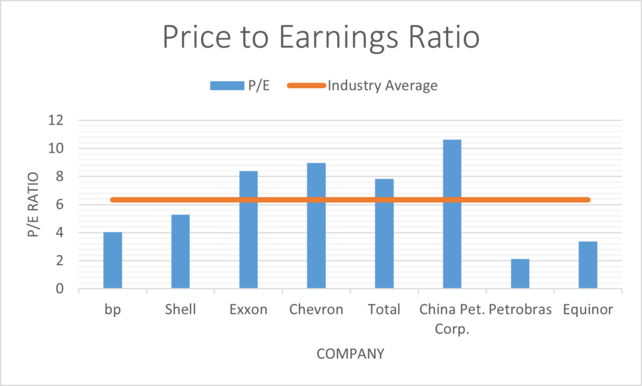
Compared to the industry average of x6.33, bp has a lower price to earnings ratio of x4.04, indicating that the stock is undervalued.
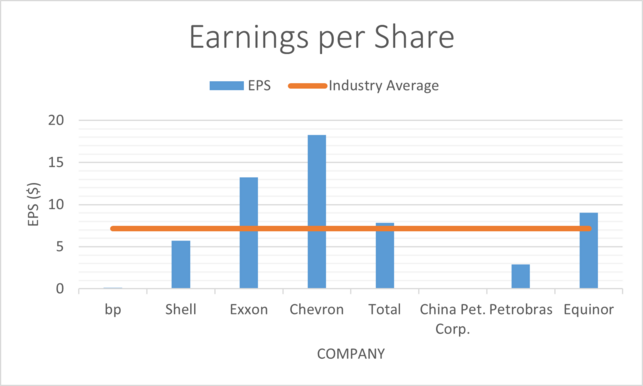
Compared to the industry average earnings per share of $7.16, bp has significantly lower earnings at $0.15 per share. This indicates that the company is not as profitable as some of it's peers.
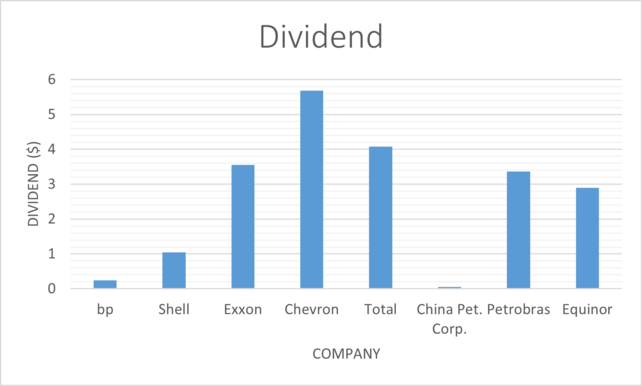
The dividend paid out by bp over the previous 5 years is $0.24, which is again lower than most of it's competitors, this indicates that bp stock does not have good prospects for income.
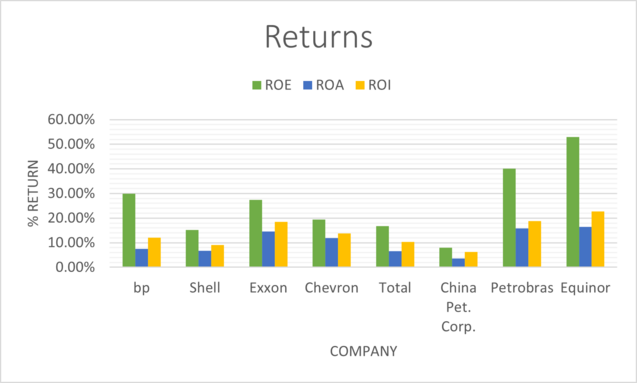
Comparing the returns on equity, assets and investment, we can see that bp is about average, performing better than Shell, Total and China Petroleum Corporation overall.
The relative valuation indicates that bp stock is undervalued compared to it's competitors, but this may be due to the fact that the company is not as profitable as others in the oil and gas industry.
Risks edit edit source
Each risk is scored according to the risk matrix below edit edit source
| Impact | ||||
|---|---|---|---|---|
| Low | Medium | High | ||
| Likelihood | Low | A1 | B1 | C1 |
| Medium | A2 | B2 | C2 | |
| High | A3 | B3 | C3 | |
Growth of the Business edit edit source
- B3 Declining oil prices: The oil and gas industry is cyclical, and oil prices have been declining in recent years. This could impact BP's ability to grow its business and generate profits.
- C1 Shifting demand: The demand for oil is declining in some parts of the world, as countries transition to cleaner energy sources. This could also impact BP's growth prospects.
- European Union has committed to reducing its reliance on fossil fuels by 55% by 2030. This could impact BP's demand for oil in the future.
- B2 New entrants: New entrants to the oil and gas industry could pose a challenge to BP's market share.
- B3 Technology: BP is facing increasing competition from new technologies, such as electric vehicles and renewable energy. If these technologies become more widely adopted, they could displace BP's traditional oil and gas businesses.
Company's Operations edit edit source
- C2 Safety incidents: BP has been involved in several safety incidents in recent years, including the Deepwater Horizon oil spill in 2010. These incidents could damage BP's reputation and make it more difficult to attract new customers and investors.
- C1 Environmental: BP's operations could also cause environmental damage, which could lead to lawsuits and regulatory fines.
- C2 Cybersecurity attacks: BP's operations are increasingly reliant on technology, which makes them vulnerable to cyberattacks. These attacks could disrupt BP's business and damage its reputation.
- 2017, BP was the victim of a cyberattack that resulted in the theft of customer data.
- C3 Geopolitical risks: BP operates in a number of countries around the world, and political instability in any of these countries could disrupt its operations.
- The war in Ukraine has had a significant impact on BP's business, as it has been forced to exit operations in Russia.
- Operations in Iraq were disrupted by the war in 2003.
Governmental Laws and Regulations edit edit source
- C2 Changes in government policies: Changes in government policies, such as stricter environmental regulations, could make it more difficult for BP to operate and could impact its profitability. For example, the European Union has recently proposed a ban on the sale of new gasoline and diesel cars by 2035. This could impact BP's demand for oil in the future.
Ownership of the Company's Common Stock edit edit source
- B1 Shareholder activism: BP's shareholders could become more active and demand changes to the company's strategy or operations. Yet despite the fall in earnings, which missed analysts’ expectations by almost $1bn, BP surprised investors by increasing the dividend by 10 per cent to $0.70 per share. This will, in some extent, boost shareholder's confidence
- In 2020, a group of BP shareholders filed a lawsuit demanding that the company reduce its carbon emissions.
- A1 Takeover threats: BP could be the target of a takeover by another company.
ESG Factors edit edit source
Environmental[16] edit edit source
This aspect focuses on BP's impact on the environment, including its carbon emissions, energy efficiency, and efforts to transition to cleaner energy sources. BP has announced ambitious plans to become a net-zero emissions company by 2050 or sooner. This involves reducing its carbon footprint across its operations, investing in renewable energy sources like wind and solar, and developing technologies for carbon capture and storage.
BP is resolutely committed to achieving net-zero carbon emissions by 2050, or even earlier, encompassing Scope 1, 2, and 3 emissions, supported by ambitious targets for 2025 and further aspirations for 2030. Guided by five primary objectives aimed at facilitating global net-zero aspirations, BP has undertaken a stance of refraining from exploration in new nations. The company's capital expenditure dedicated to transition efforts is projected to exceed 40% of total spending by 2025, progressively increasing to approximately 50% by 2030.
Social[16] edit edit source
BP's social initiatives involve its interactions with local communities, employees, and other stakeholders. This can include measures to ensure workplace safety, diversity and inclusion in the workforce, and contributing positively to the communities where they operate. Social responsibility also extends to issues like human rights, labor practices, and community development.
In 2022, BP achieved a reduction in combined tier 1 and tier 2 process safety incidents compared to the previous year. The company is dedicated to attaining a net positive impact on biodiversity within its new projects. Annual bonuses for the year were tied to safety (15%) and emissions reduction (15%) metrics, reinforcing these key priorities. Notably, BP's leadership team consists of six women out of eleven members, with a significant rise in female representation within the extended leadership team (41%). The company is actively spearheading efforts to drive the advancement and expansion of natural climate solutions, while also asserting its commitment to a just transition, encompassing the development of skills pertinent to the future energy landscape. Transparent practices are upheld through various disclosures, including TCFD, SASB, tax transparency, and updates on trade associations. BP places a strong emphasis on mental health and well-being within its workforce agenda. The company's overarching objectives include five initiatives to enhance people's lives and an additional five goals aimed at fostering a caring ethos.
Governance[16] edit edit source
BP's framework for investment governance aims to ensure that the company's investments are in alignment with its strategic objectives, feasible within its existing financial framework, and capable of generating value for shareholders. The framework establishes a systematic approach to evaluating investments based on a variety of criteria that are pertinent to the company's strategy, including considerations related to environmental sustainability and other relevant factors.
Under this framework, investments undergo a structured stage-gate process that is integrated throughout the company's operations. This process empowers BP's various business units to select and cultivate the most promising investment propositions. The criteria for evaluating investments are comprehensive and balanced. This approach enables BP to effectively compare and prioritize investments across an expanding array of business models that the company engages with.
Integral to the governance framework is the requirement that proposed investments undergo evaluation based on pertinent assumptions. This evaluation encompasses factors such as projected operational emissions and the impact of carbon prices, when applicable. Additionally, the framework mandates that independent functions within the organization conduct thorough assessments to provide assurance before making a final investment decision (FID). This ensures a robust and well-informed decision-making process for BP's investments, bolstering the company's commitment to both financial success and sustainable practices.
- ↑ 1.0 1.1 https://www.precedenceresearch.com/power-generation-market#:~:text=The%20global%20power%20generation%20market%20size%20was%20accounted%20at%20USD,8.04%25%20from%202023%20to%202032.
- ↑ https://www.bicmagazine.com/departments/operations/global-oil-refinery-market-is-projected-to-grow/
- ↑ https://www.youtube.com/watch?v=o_m0a1JZdco&ab_channel=bp
- ↑ https://www.bp.com/en/global/corporate/what-we-do/our-business-model.html
- ↑ https://www.bp.com/en/global/corporate/what-we-do/our-strategy.html
- ↑ https://www.bp.com/en/global/corporate/what-we-do/production-and-operations.html
- ↑ https://www.bp.com/en/global/corporate/products-and-services.html
- ↑ https://www.bp.com/en/global/corporate/what-we-do/customers-and-products.html
- ↑ https://www.bp.com/en/global/corporate/who-we-are/our-transformation.html
- ↑ https://www.bp.com/en/global/corporate/who-we-are/board-and-executive-management/leadership-team.html
- ↑ 11.0 11.1 11.2 11.3 11.4 bp annual report 2022 - https://www.bp.com/content/dam/bp/business-sites/en/global/corporate/pdfs/investors/bp-annual-report-and-form-20f-2022.pdf
- ↑ UK 10 Year Gilt Yield - https://markets.ft.com/data/bonds/tearsheet/summary?s=UK10YG (as of 11th August 2023).
- ↑ 13.0 13.1 https://markets.ft.com/data/equities/tearsheet/summary?s=BP.:LSE
- ↑ https://www.ig.com/uk/trading-strategies/what-are-the-average-returns-of-the-ftse-100--230511
- ↑ https://www.bp.com/en/global/corporate/investors/debt-investors-information.html
- ↑ 16.0 16.1 16.2 https://www.bp.com/en/global/corporate/investors/results-reporting-and-presentations/annual-report.html
