| Type | Publicly traded partnership |
|---|---|
| NYSE: BEP NYSE: BEPC TSX: BEP.UN | |
| Industry | Renewable power |
| Founded | 2011 |
| Headquarters | , Canada |
Key people | Connor Teskey (CEO) Richard Legault (Chairman) |
| Services | Independent Power Producer |
| Total assets | US$30.9 billion (2017) [1] |
| Parent | Brookfield Asset Management |
| Subsidiaries | Great Lakes Power and Isagen S.A., among others |
| Website |
|
| Footnotes / references [2] | |
Overview
Brookfield Renewable Partners L.P. (BRP), stock ticker BEP, is a publicly traded limited partnership that owns a diversified portfolio of renewable power and sustainable solutions assets. Headquartered are in Hamilton, Bermuda, the BEP stock is listed on the New York Stock Exchange (NYSE). Brookfield Renewable Partners was founded in 1999 as Brookfield Renewable Power Inc., a subsidiary of Brookfield Asset Management, and rebranded in 2013.
Brookfield Renewable's portfolio includes hydroelectric, wind, solar, distributed energy and sustainable solutions across five continents, 98% of the business is made up of renewable power assets. The company's largest market is the United States, which accounts for approximately 40% of its total capacity. Brookfield Renewable's business model is to acquire and develop high quality renewable power below intrinsic value, finance on a long term low risk basis and optimise cash flows by applying their operating expertise and knowledge to enhance value.
Currently, Brookfield Renewable has an estimated operating capacity of 25,400 MW, and an estimated 110,000 MW of future operating capacity. 1 MW can power around 1,000 homes in the US, it is currently one of the largest decarbonisation businesses globally.
The company's stock is classified as a "dividend aristocrat" by S&P Global, meaning that it has increased its dividend for 25 consecutive years.
Products
Management Team
Risks
Financial Risks
Electricity Price - Exposure to movements in the market price of energy.
Foreign Currency - Exposed to foreign currency risk including the Canadian dollar, Brazilian real, Euro, British pound sterling, Colombian peso, Indian rupee, Chinese yuan, and Malaysian ringgit. The risk is related to operations, anticipated transactions and certain foreign currency debt.
Interest Rate - Exposed to interest rate risk on the interest rates for variable rate debt.
Credit - Exposed to credit risk from operating activities and certain financing activities. The risk is due to counterparties not being able to meet their obligations on energy contracts, interest rate swaps, forward foreign exchange contracts, physical electricity and gas transactions as well as trade receivables.
Liquidity - Exposed to liquidity risk for financial liabilities. Also subject to internal liquidity risk as they conduct business activities through separate legal entities, and are dependent on receipt of cash from those entities to pay off corporate expenses and make dividend payments to shareholders.
Industry and Operational Risks
Natural resource availability - Revenues generated by renewable power facilities are correlated to the amount of electricity produced, which are dependent on available water flows, wind and irradiance. The generation facilities are susceptible to damage during extreme weather events, climate change may increase the frequency of extreme weather events, as well as cause a shift in the existing weather patterns.
Contract Expiration - Certain power purchasing agreements in the portfolio will be subject to re-contracting in the future, if the price of electricity in power markets is declining at the time of re-contracting, it will impact the ability of the company to be able to re-negotiate at favourable terms.
Concession renewal - The company holds concessions and has rights to operate facilities, e.g. for hydroelectric facilities, the concessions include the rights to the land and water required for power generation. If renewal rights are not granted or an additional cost is imposed on the concession, it could significantly impact operational capacity and profitability.
Dam failures - Occurrence of dam failures at any hydroelectric generation stations would result in loss of generating capacity until the failure has been repaired, harm to third parties or the environment could expose the company to liability costs.
Other Risks
Cyber Attacks - The business may be subject to cyber security risks or other breaches of information intended to obtain unauthorised access to proprietary information and that of business partners, destroy data or disable systems through cyber attacks. Any breach of information could go undetected for some time.
Development Failures - The company has a large development pipeline that includes projects at different levels of advancement, there is no guarantee that all project will be successfully delivered, or delivered on time.
Employee Retention - The business depends on the skill of the professionals employed, future success will depend on the continued service of these individuals, which could impact the ability of the company to achieve its objectives.
Financials
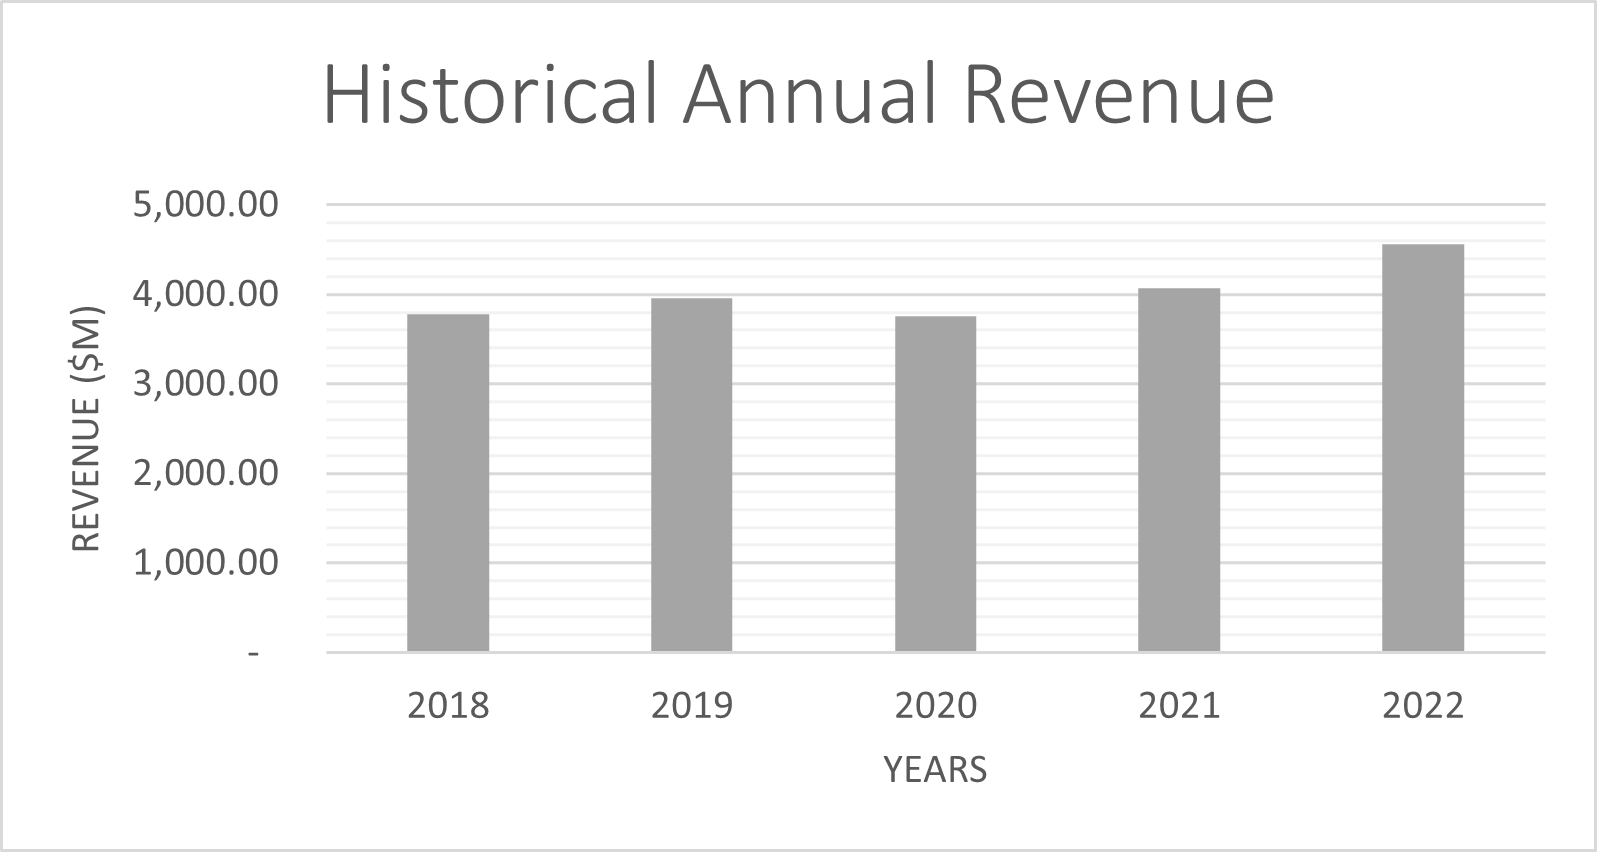
The table below shows the reported revenue of the previous 5 years for Brookfield Renewable Partners, other financial information required in the calculation of EBIT is also shown. All units are given in USD millions.
| Units ($m) | 2018 | 2019 | 2020 | 2021 | 2022 |
|---|---|---|---|---|---|
| Total Revenue | 3,784.00 | 3,962.00 | 3,755.00 | 4,071.00 | 4,565.00 |
| Cost of sales | - 457.00 | - 502.00 | - 540.00 | - 591.00 | - 605.00 |
| Selling, general and admin expenses | - 910.00 | - 896.00 | - 969.00 | - 1,062.00 | - 1,007.00 |
| Other Operating Expenses | - 153.00 | - 203.00 | - 334.00 | - 89.00 | - 108.00 |
| Depreciation | 1,151.00 | 1,271.00 | 1,367.00 | 1,501.00 | 1,583.00 |
| EBIT | 1,113.00 | 1,090.00 | 545.00 | 828.00 | 1,262.00 |
| CapEx | - 235.00 | - 195.00 | - 447.00 | - 1,967.00 | - 2,190.00 |
| Current Assets | 1,961.00 | 2,020.00 | 1,742.00 | 2,861.00 | 4,183.00 |
| Cash | 173.00 | 352.00 | 431.00 | 764.00 | 730.00 |
| Current Liabilities | 1,689.00 | 2,423.00 | 2,761.00 | 3,222.00 | 4,943.00 |
| NCWC | 99.00 | - 755.00 | - 1,450.00 | - 1,125.00 | - 1,490.00 |
| NCWC (inc/dec) | \ | 854.00 | 695.00 | - 325.00 | 365.00 |
Revenue Breakdown by Segment
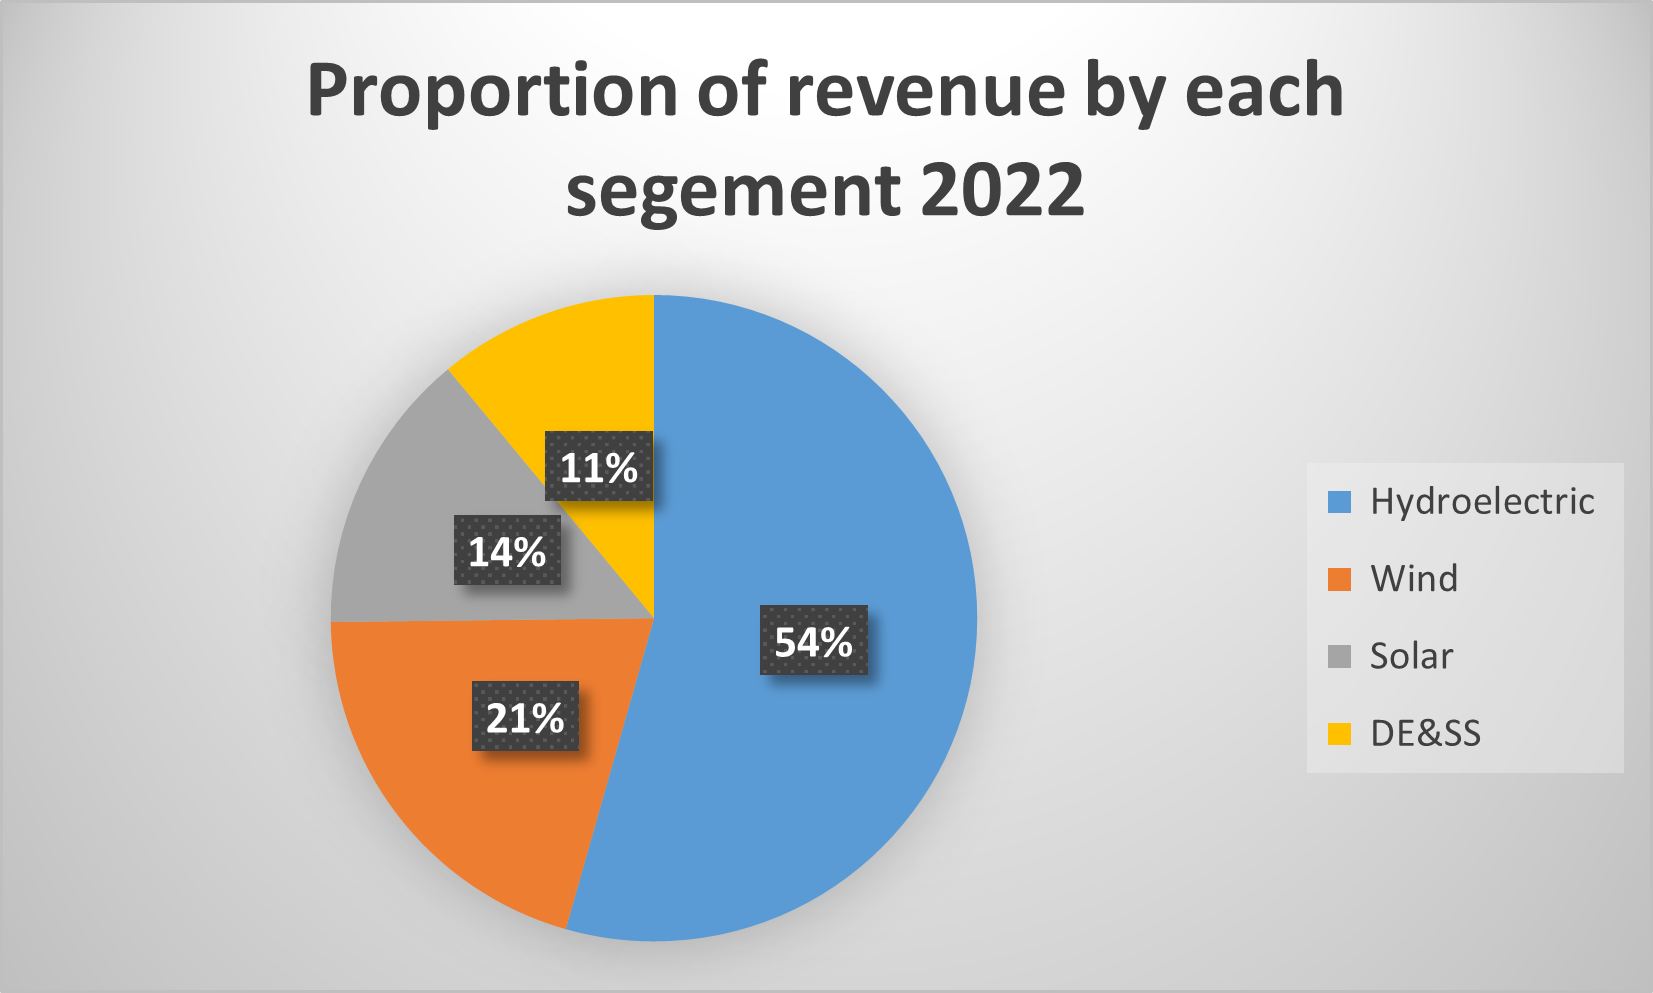
The table below outlines the revenue generated by the renewable power portfolio of Brookfield Renewable Partners.
| Units ($m) | Hydroelectric | Wind | Solar | DE&SS | ||||
| 2022 | 2021 | 2022 | 2021 | 2022 | 2021 | 2022 | 2021 | |
| North America | 964.00 | 876.00 | 332.00 | 370.00 | - | - | - | - |
| Brazil | 197.00 | 169.00 | 31.00 | 29.00 | - | - | - | - |
| Columbia | 273.00 | 224.00 | - | - | - | - | - | - |
| Europe | - | - | 134.00 | 125.00 | - | - | - | - |
| Asia | - | - | 41.00 | 32.00 | - | - | - | - |
| Total | 1,434.00 | 1,269.00 | 538.00 | 556.00 | 374.00 | 348.00 | 290.00 | 242.00 |
Forecasts
The following table shows the forecast financials for the next 10 years, and the calculation of free cash flow, which will be used in the DCF valuation of the company.
| Units ($m) | 2023 | 2024 | 2025 | 2026 | 2027 | 2028 | 2029 | 2030 | 2031 | 2032 |
|---|---|---|---|---|---|---|---|---|---|---|
| Total Revenue | 4,608.35 | 4,792.07 | 4,975.78 | 5,159.49 | 5,343.21 | 5,526.92 | 5,710.64 | 5,894.35 | 6,078.06 | 6,261.78 |
| Cost of sales | - 624.11 | - 662.89 | - 702.73 | - 743.64 | - 785.61 | - 828.65 | - 872.76 | - 917.93 | - 964.16 | - 1,011.47 |
| Selling, general and admin expenses | - 993.52 | - 1,009.17 | - 1,022.98 | - 1,034.95 | - 1,045.09 | - 1,053.38 | - 1,059.85 | - 1,064.47 | - 1,067.26 | - 1,068.21 |
| Other Operating Expenses | - 208.43 | - 216.73 | - 225.04 | - 233.35 | - 241.66 | - 249.97 | - 258.28 | - 266.59 | - 274.90 | - 283.21 |
| Depreciation | 1,633.06 | 1,734.58 | 1,838.89 | 1,946.00 | 2,055.90 | 2,168.59 | 2,284.08 | 2,402.35 | 2,523.42 | 2,647.28 |
| EBIT | 1,149.24 | 1,168.70 | 1,186.14 | 1,201.55 | 1,214.95 | 1,226.32 | 1,235.68 | 1,243.01 | 1,248.32 | 1,251.62 |
| CapEx | - 1,099.80 | - 1,143.65 | - 1,187.49 | - 1,231.34 | - 1,275.18 | - 1,319.03 | - 1,362.87 | - 1,406.71 | - 1,450.56 | - 1,494.40 |
| Current Assets | 4,390.84 | 4,967.86 | 5,544.88 | 6,121.90 | 6,698.91 | 7,275.93 | 7,852.95 | 8,429.97 | 9,006.99 | 9,584.01 |
| Cash | 1,046.50 | 1,150.44 | 1,388.07 | 1,492.01 | 1,729.64 | 1,833.57 | 2,071.20 | 2,175.14 | 2,412.77 | 2,516.71 |
| Current Liabilities | 5,388.16 | 6,143.79 | 6,899.42 | 7,655.05 | 8,410.68 | 9,166.31 | 9,921.94 | 10,677.57 | 11,433.20 | 12,188.83 |
| NCWC | - 2,043.82 | - 2,326.37 | - 2,742.61 | - 3,025.16 | - 3,441.40 | - 3,723.95 | - 4,140.19 | - 4,422.74 | - 4,838.98 | - 5,121.53 |
| NCWC (inc/dec) | 553.82 | 282.55 | 416.24 | 282.55 | 416.24 | 282.55 | 416.24 | 282.55 | 416.24 | 282.55 |
| FCF | 1,994.97 | 1,796.75 | 2,004.69 | 1,946.44 | 2,156.77 | 2,100.91 | 2,313.63 | 2,260.17 | 2,475.28 | 2,424.21 |
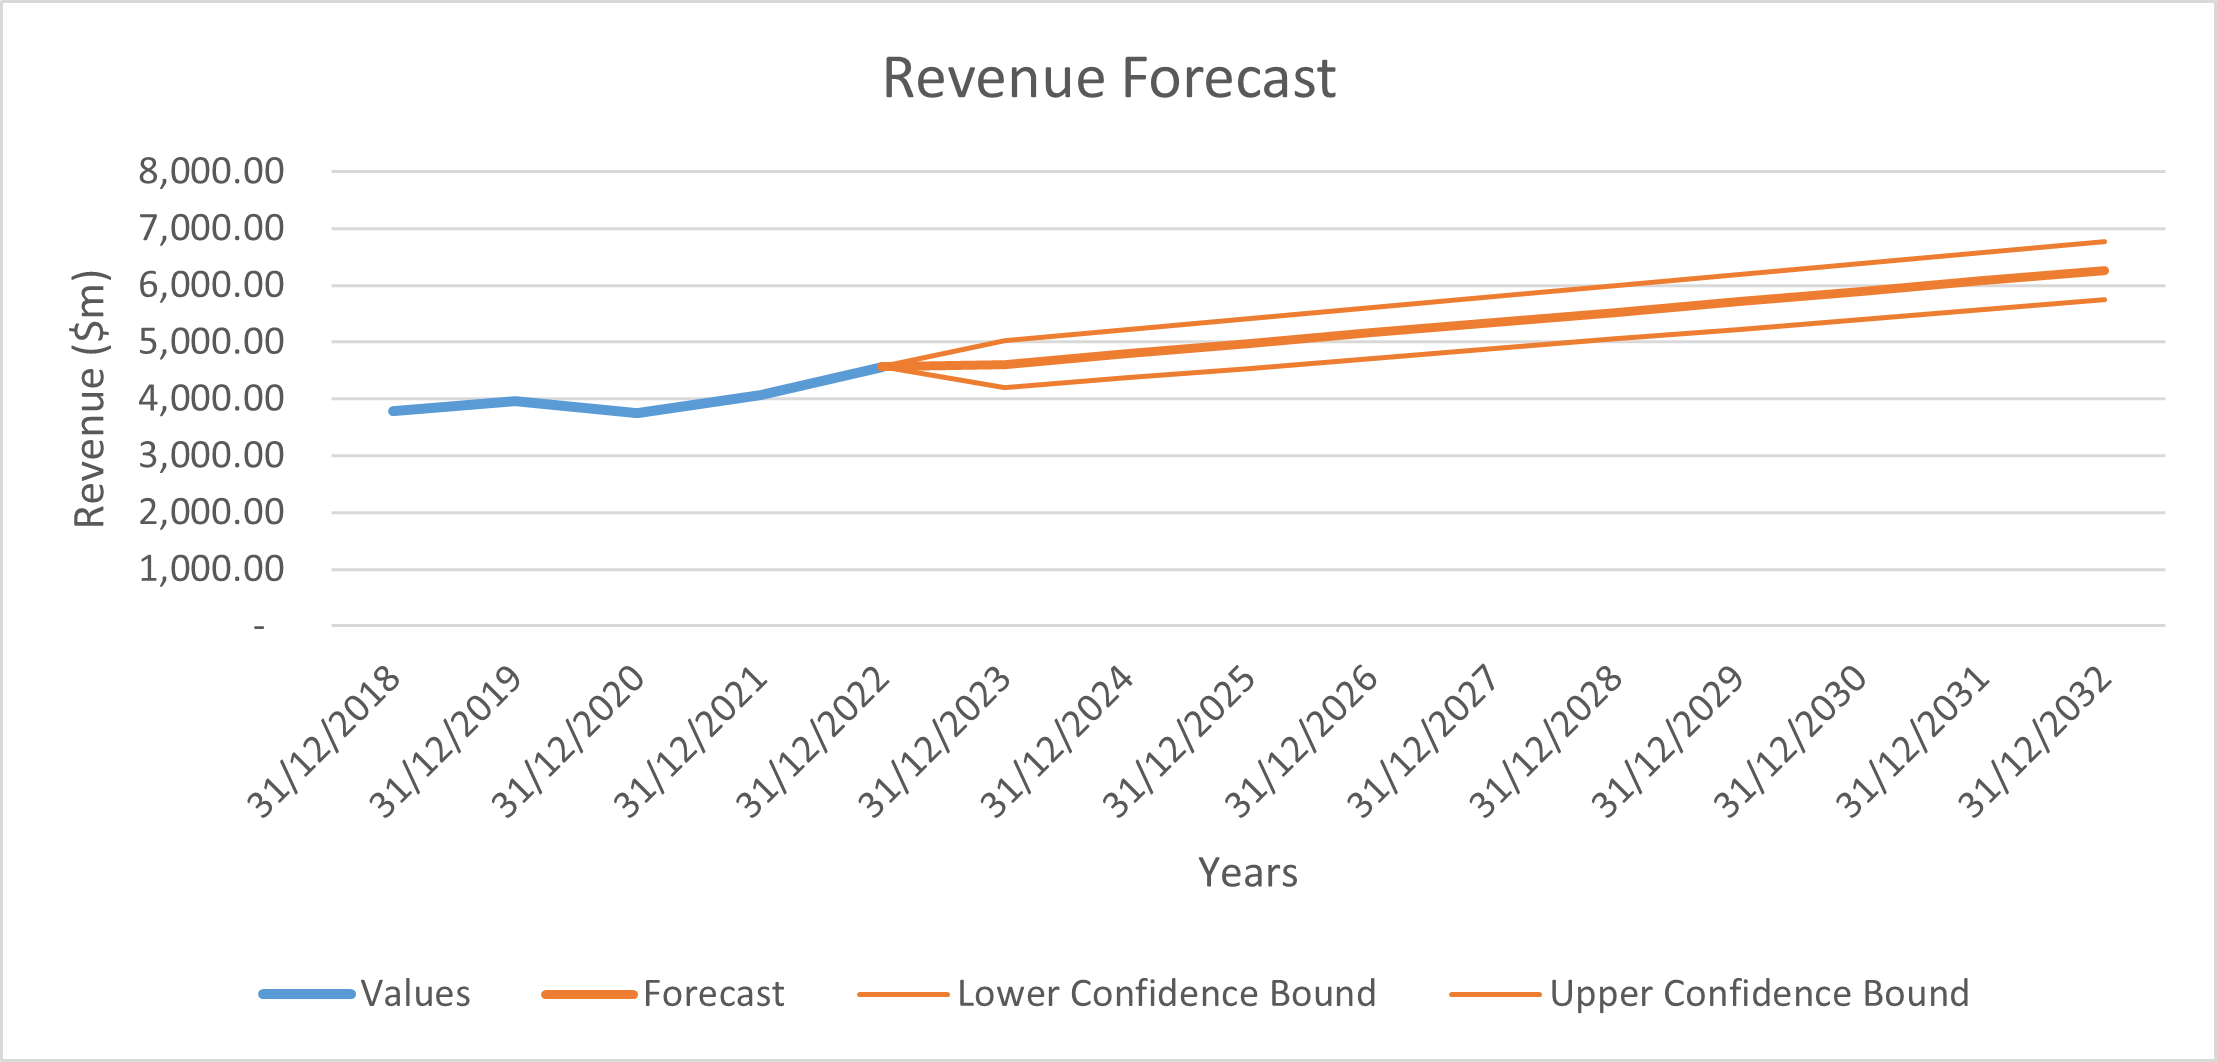
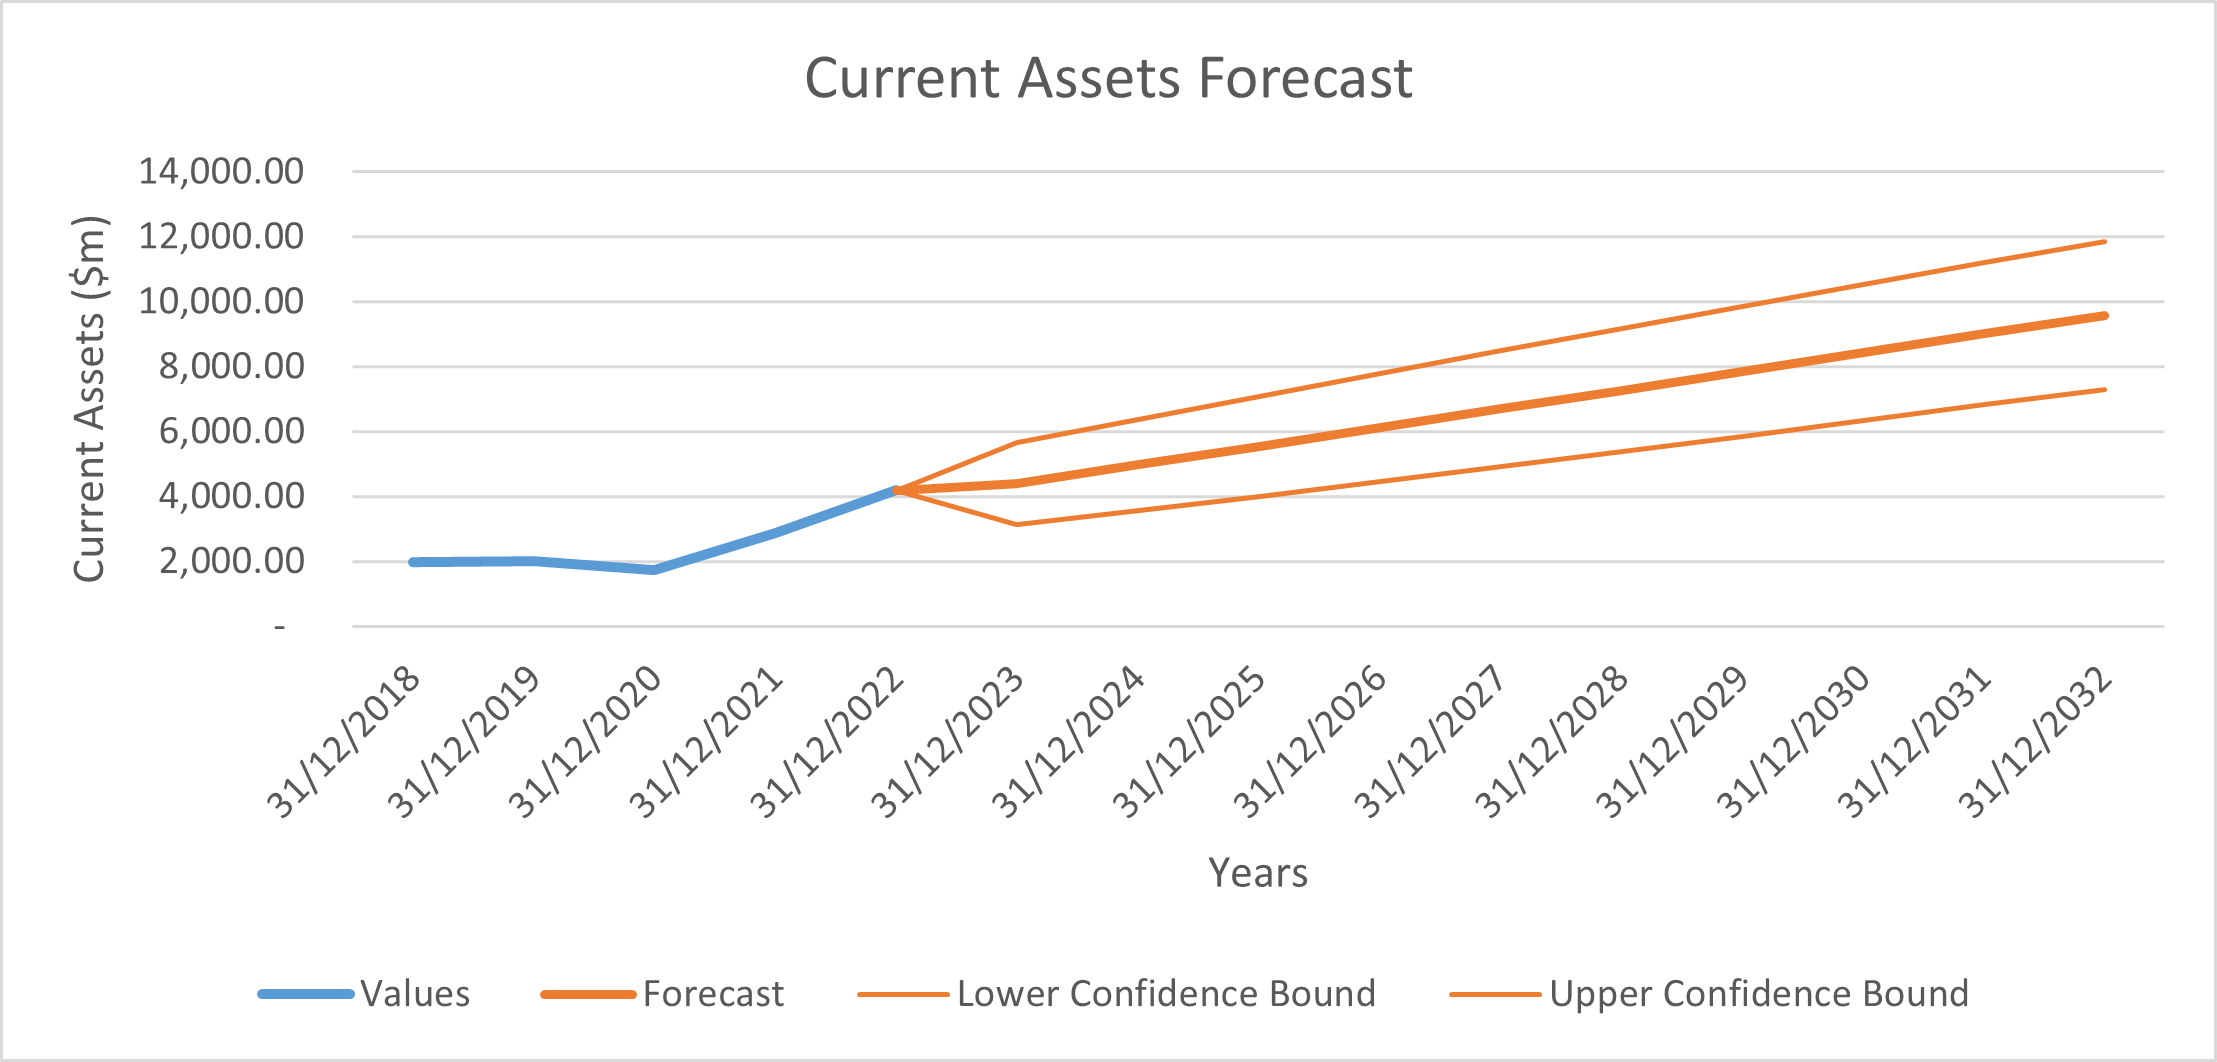
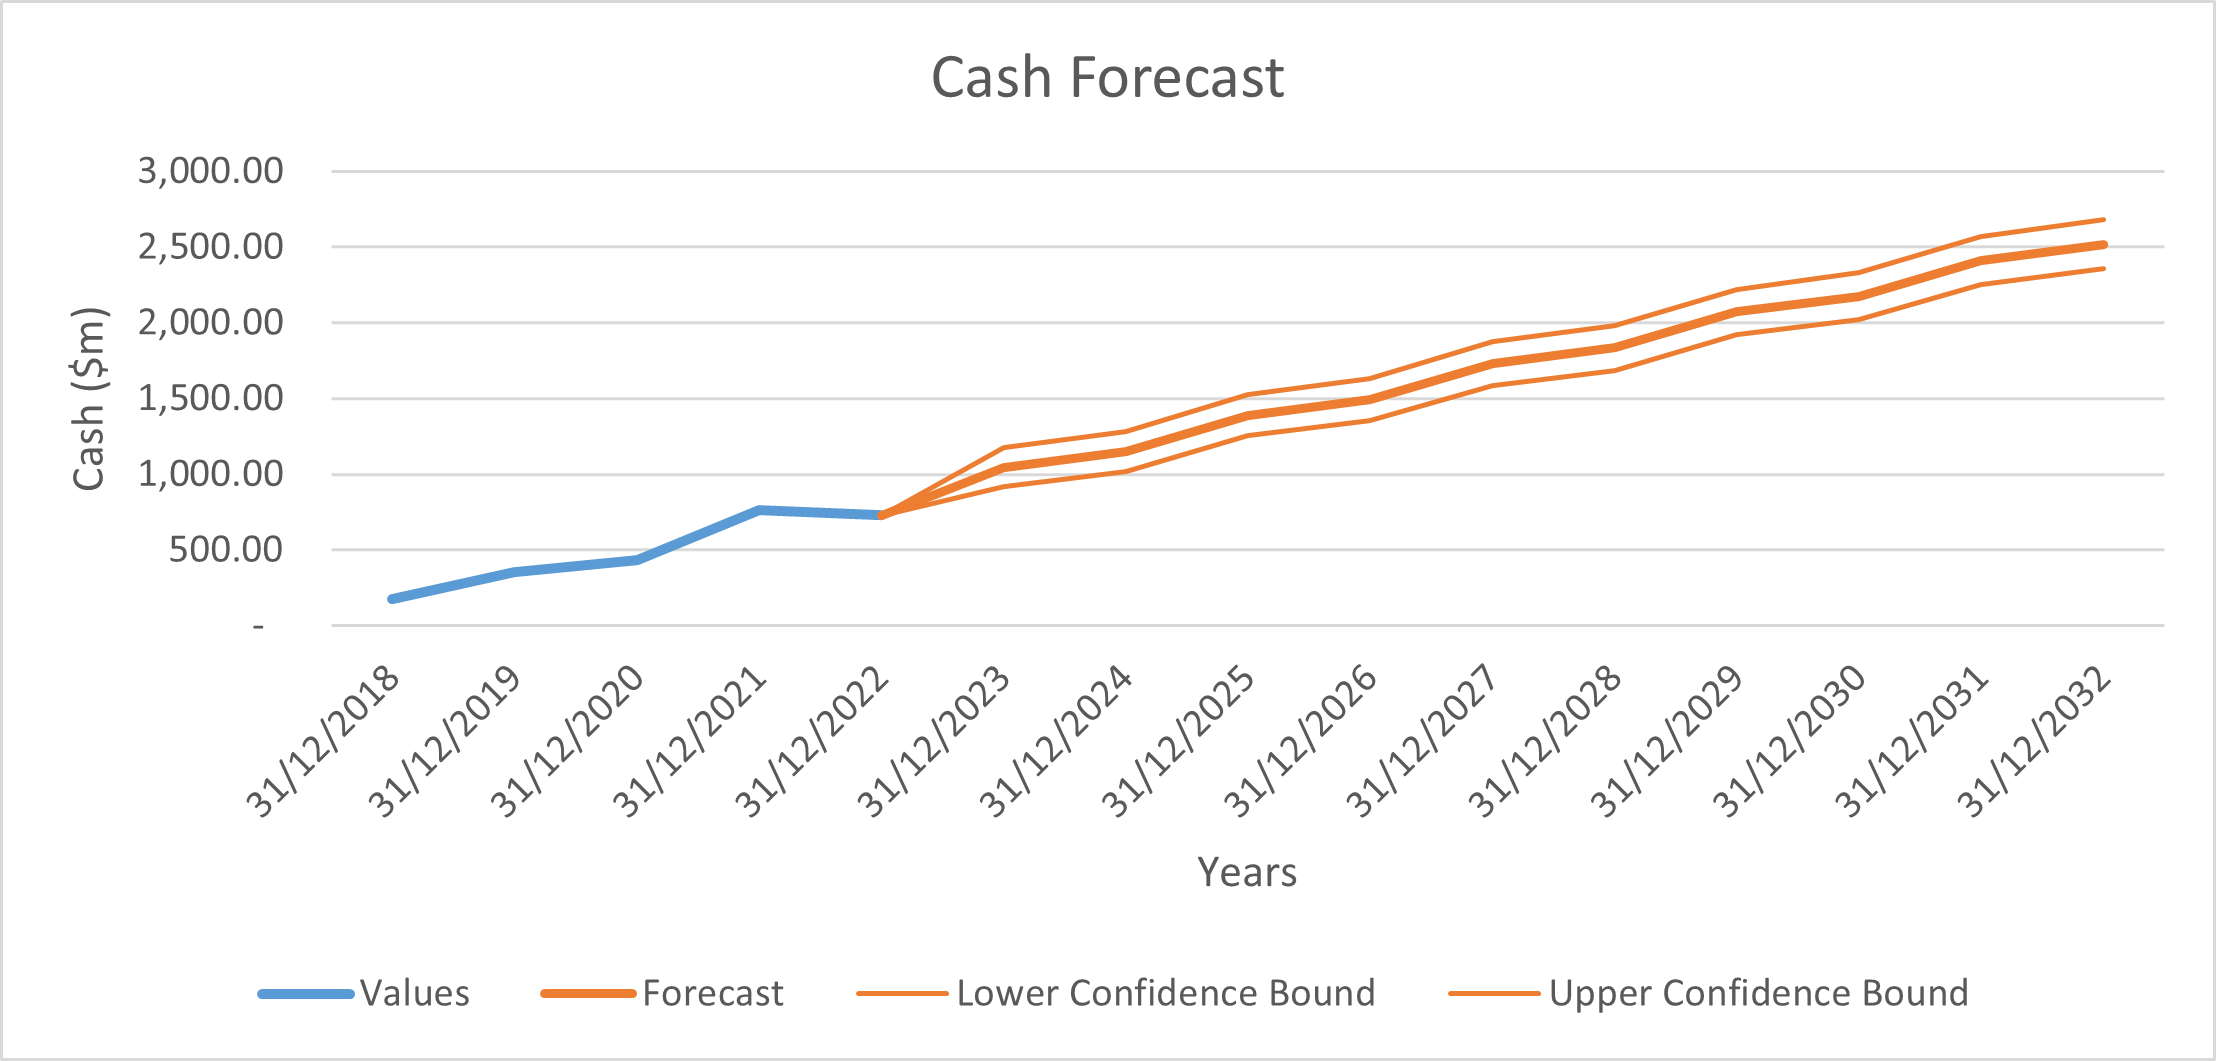
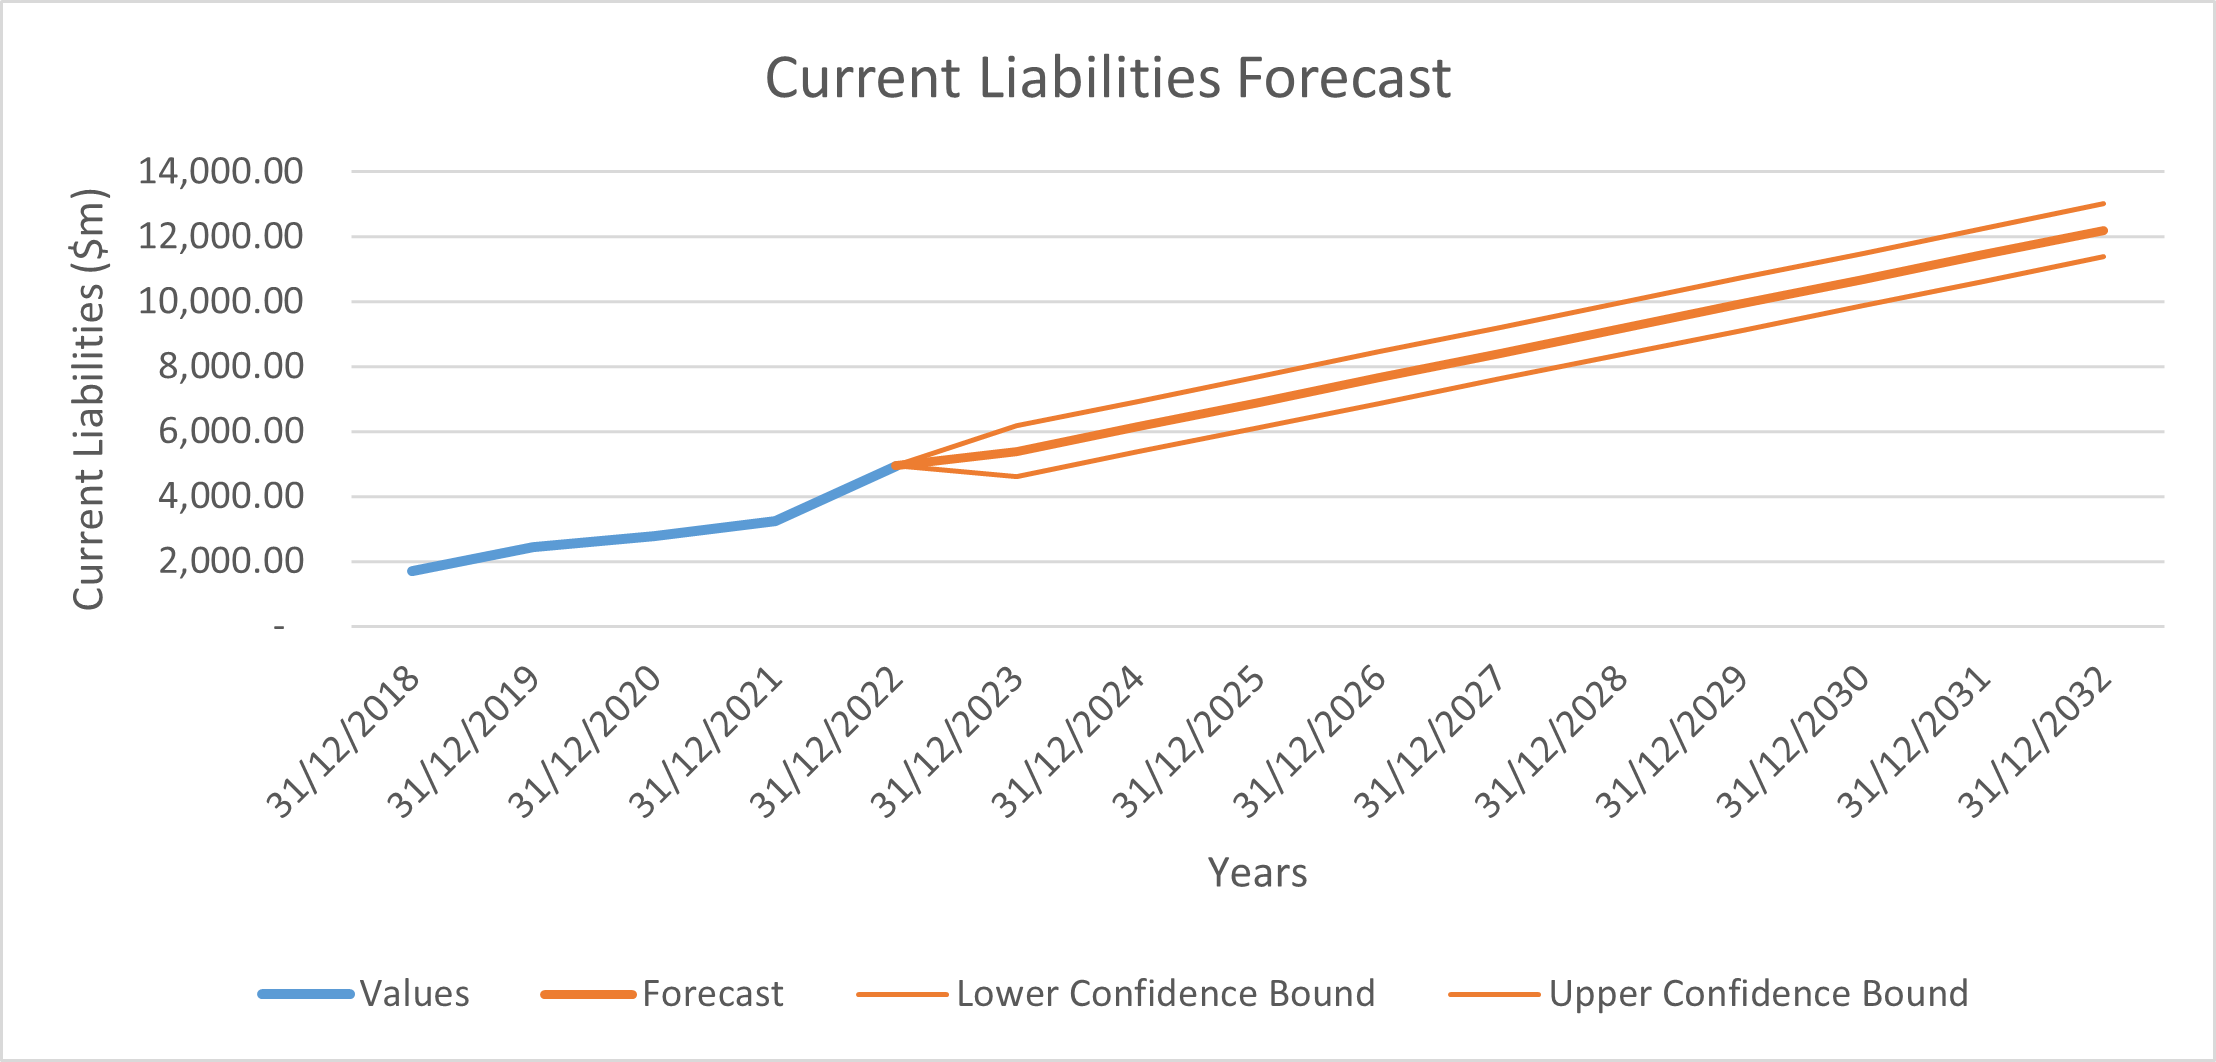
The table below shows the assumptions used to calculate the forecasts in the table above, in the case of revenue, current assets, cash and current liabilities, the built in forecast function in excel was used to provide more accurate values.
| 2018 | 2019 | 2020 | 2021 | 2022 | 2023 | 2024 | 2025 | 2026 | 2027 | 2028 | 2029 | 2030 | 2031 | 2032 | |
|---|---|---|---|---|---|---|---|---|---|---|---|---|---|---|---|
| Cost of sales % of revenue | 12.1% | 12.7% | 14.4% | 14.5% | 13.3% | 13.5% | 13.8% | 14.1% | 14.4% | 14.7% | 15.0% | 15.3% | 15.6% | 15.9% | 16.2% |
| SG&A % of revenue | 24.0% | 22.6% | 25.8% | 26.1% | 22.1% | 21.6% | 21.1% | 20.6% | 20.1% | 19.6% | 19.1% | 18.6% | 18.1% | 17.6% | 17.1% |
| Other expenses % of revenue | 4.0% | 5.1% | 8.9% | 2.2% | 2.4% | 4.5% | 4.5% | 4.5% | 4.5% | 4.5% | 4.5% | 4.5% | 4.5% | 4.5% | 4.5% |
| Depreciation % of revenue | 30.4% | 32.1% | 36.4% | 36.9% | 34.7% | 35.4% | 36.2% | 37.0% | 37.7% | 38.5% | 39.2% | 40.0% | 40.8% | 41.5% | 42.3% |
| CapEx % of revenue | 6.2% | 4.9% | 11.9% | 48.3% | 48.0% | 23.9% | 23.9% | 23.9% | 23.9% | 23.9% | 23.9% | 23.9% | 23.9% | 23.9% | 23.9% |
The graphs below show the forecast models for revenue, current assets, cash and current liabilities.
The following table shows the WACC calculation:
| Risk Free Rate of Return | 3.8% |
| Beta | 0.74 |
| Market Rate of Return | 9.8% |
| Cost of Equity | 8.3% |
| Credit Spread | 2.00% |
| Cost of Debt | 4.6% |
| Shares Outstanding | 288.78 |
| Share Price | 29.96 |
| Equity | 8,651.85 |
| Long Term Debt | 22,797.00 |
| Debt | 830.99 |
| E/D+E | 91.2% |
| D/D+E | 8.8% |
| WACC | 7.9% |
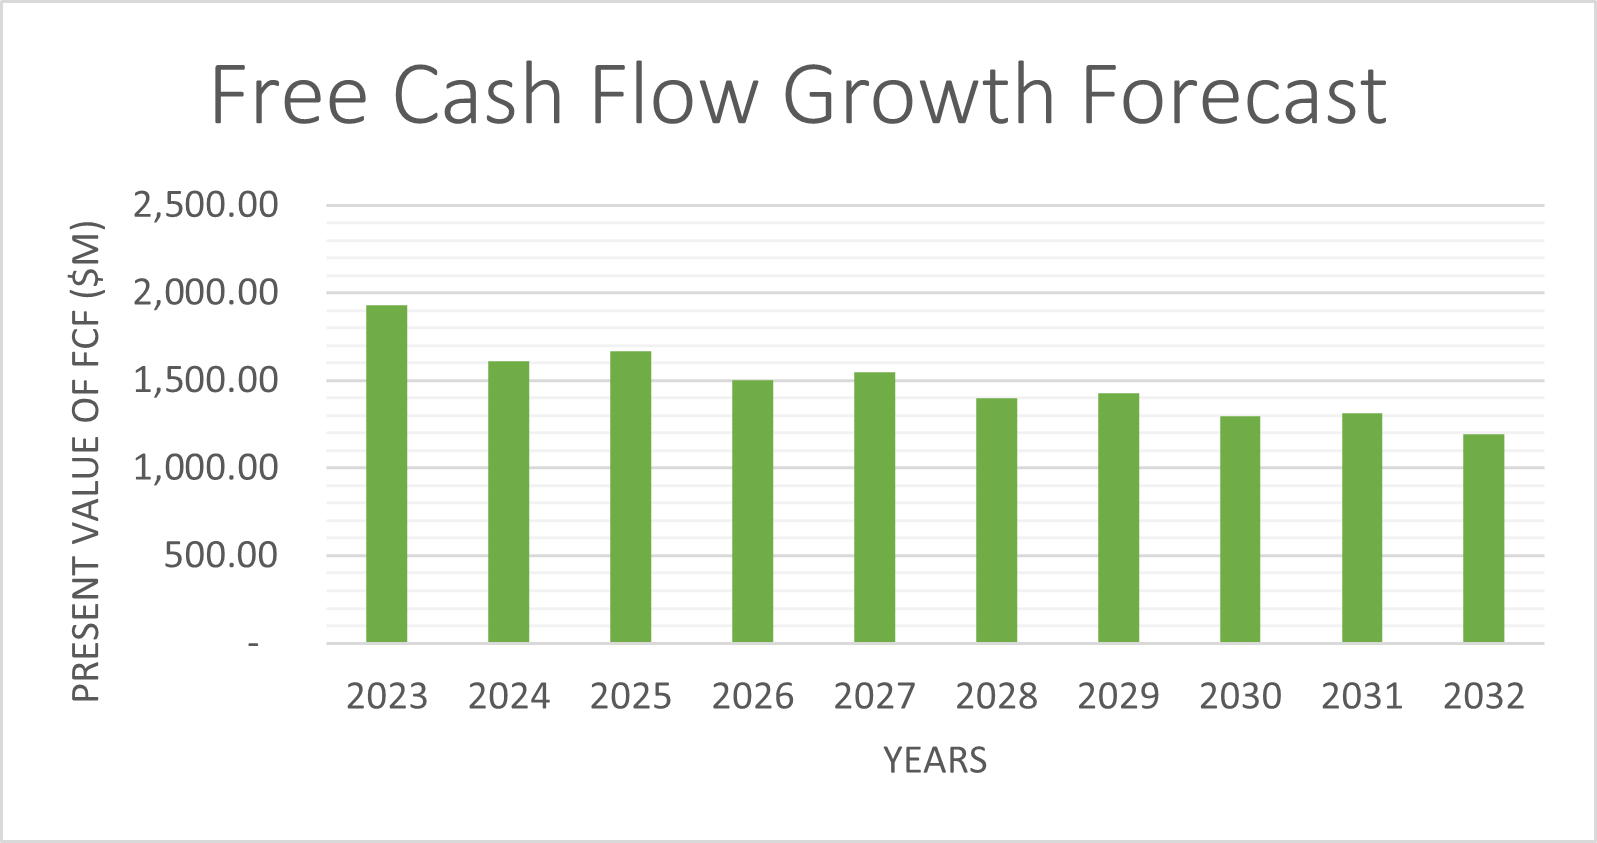
The following table shows a 10 year DCF valuation for Brookfield Renewable Partners. The effective tax rate used for the WACC calculation above and in the DCF valuation below was set at 21%. The terminal growth rate was set at 3.3%, equivalent to the annualised US GDP growth rate.
| Units ($m) | 2023 | 2024 | 2025 | 2026 | 2027 | 2028 | 2029 | 2030 | 2031 | 2032 |
|---|---|---|---|---|---|---|---|---|---|---|
| FCF | 1,994.97 | 1,796.75 | 2,004.69 | 1,946.44 | 2,156.77 | 2,100.91 | 2,313.63 | 2,260.17 | 2,475.28 | 2,424.21 |
| Growth Rate | 3.3% | |||||||||
| Terminal Value | 54,662.74 | |||||||||
| Discount Factor | 0.965507934 | 0.895146668 | 0.82991297 | 0.769433169 | 0.713360826 | 0.661374748 | 0.613177148 | 0.568491943 | 0.527063166 | 0.488653506 |
| Present Value of FCF | 1,926.16 | 1,608.35 | 1,663.72 | 1,497.65 | 1,538.56 | 1,389.49 | 1,418.67 | 1,284.89 | 1,304.63 | 1,184.60 |
| Present Value of Terminal Value | 26,711.14 | |||||||||
| Enterprise Value | 41,527.85 | |||||||||
| Equity Value | 17,210.85 | |||||||||
| Share Price | $ 59.60 |
The valuation shows that as of 14/07/2023, Brookfield Renewable Partners is undervalued. There is a potential upside of 99% over 10 years, equivalent to an annual share price rise of 9.9% from the end of 2023.
The sensitivity analysis below shows how share price varies in different growth rate environments, and for different WACC values.
| $ 59.60 | WACC | ||||||||
|---|---|---|---|---|---|---|---|---|---|
| 6.0% | 6.5% | 7.0% | 7.5% | 8.0% | 8.5% | 9.0% | 9.5% | ||
| Growth Rate | 2.0% | $ 94.76 | $ 75.06 | $ 59.31 | $ 46.42 | $ 35.68 | $ 26.60 | $ 18.82 | $ 12.08 |
| 2.5% | $ 113.07 | $ 88.75 | $ 69.83 | $ 54.70 | $ 42.32 | $ 32.00 | $ 23.27 | $ 15.79 | |
| 3.0% | $ 137.48 | $ 106.34 | $ 82.98 | $ 64.81 | $ 50.27 | $ 38.38 | $ 28.46 | $ 20.07 | |
| 3.5% | $ 171.66 | $ 129.80 | $ 99.89 | $ 77.45 | $ 60.00 | $ 46.03 | $ 34.59 | $ 25.06 | |
| 4.0% | $ 222.92 | $ 162.64 | $ 122.44 | $ 93.71 | $ 72.15 | $ 55.38 | $ 41.95 | $ 30.96 | |
| 4.5% | $ 308.36 | $ 211.90 | $ 154.00 | $ 115.38 | $ 87.78 | $ 67.07 | $ 50.95 | $ 38.04 | |
| 5.0% | $ 479.25 | $ 294.01 | $ 201.35 | $ 145.73 | $ 108.62 | $ 82.10 | $ 62.19 | $ 46.69 | |
