Brookfield Renewable Partners L.P.
| Type | Publicly traded partnership |
|---|---|
| NYSE: BEP NYSE: BEPC TSX: BEP.UN | |
| Industry | Renewable Power |
| Founded | 2013 |
| Headquarters | , Canada |
Key people | Jefferey Blidner (Chairman) Connor Teskey (CEO) Wyatt Hartley (CFO) |
| Products | Hydroelectric Power, Wind Power, Solar Power. |
| Services | Independent Power Producer |
| Revenue | US$4.57 billion (2022) |
| US$1.26 billion (2022) | |
| US-$122 million (2022) | |
| Total assets | US$64.1 billion (2022) |
Number of employees | 2880 |
| Parent | Brookfield Asset Management |
| Subsidiaries | Great Lakes Power and Isagen S.A., among others |
| Website |
|
| Footnotes / references [1] | |
Overview edit edit source
Brookfield Renewable Partners L.P. (BRP), stock ticker BEP, is a publicly traded limited partnership that owns a diversified portfolio of renewable power and sustainable solutions assets. Headquartered in Toronto, Canada, the BEP stock is listed on the New York Stock Exchange (NYSE). Brookfield Renewable Partners was founded in 1999 as Brookfield Renewable Power Inc., a subsidiary of Brookfield Asset Management, and rebranded in 2013.
Brookfield Renewable's portfolio includes hydroelectric, wind, solar, distributed energy and sustainable solutions across five continents, 98% of the business is made up of renewable power assets. The company's largest market is the United States, which accounts for approximately 40% of its total capacity. Brookfield Renewable's business model is to acquire and develop high quality renewable power below intrinsic value, finance on a long term low risk basis and optimise cash flows by applying their operating expertise and knowledge to enhance value.
Currently, Brookfield Renewable has an estimated operating capacity of 25,700 MW, and an estimated 126,000 MW of future operating capacity.[2] 1 MW can power up to 1,000 homes in the U.S.[3], Brookfield Renewable Partners is currently one of the largest decarbonisation businesses globally.
The company's stock is classified as a "dividend aristocrat" by S&P Global, meaning that it has increased its dividend for 25 consecutive years.
Mission Statement edit edit source
Brookfield Renewable use their operating capabilities, scale and global reach to develop and operate a high-quality clean energy portfolio in a responsible manner, helping accelerate the global transition to net zero
The business is underpinned by stable cash flows, with the majority of power sold to public power authorities, utilities and global businesses under long-term, inflation-linked contracts.
Brookfield Renewable's business model is to acquire and develop high quality renewable power below intrinsic value, finance on a long term low risk basis and optimise cash flows by applying their operating expertise and knowledge to enhance value.
Corporate Strategy edit edit source
Renewable energy investment - The company is committed to growing it's portfolio of renewable energy assets through a combination of organic growth and acquisitions.
Growing decarbonization solutions - The company is investing in a number of decarbonization solutions, including carbon capture and storage, renewable fuels and energy efficiency.
Transforming carbon intensive businesses - The company is working with a number of businesses that are mass producers of emissions to help them transition to a low-carbon future, including providing technical expertise, financial support and access to it's global network of partners.
Brookfield Renewable Partners corporate strategy is based on the belief that the world needs to move towards a clean energy future, the company is well-positioned to capitalize on this trend and is committed to playing a leading role in the transition to a sustainable energy future.
Products edit edit source
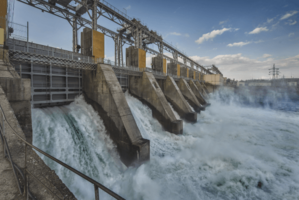
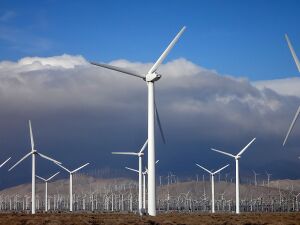
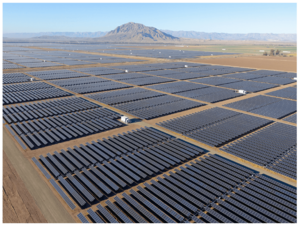
Brookfield Renewable operates 6790 facilities across 4 continents, which have a power generation capacity of 25,718 MW[2]. The facilities operated are hydroelectric power stations, wind turbines, utility scale solar power stations and distributed energy and sustainable solutions (DE&SS), which includes renewable sources of energy such as hydrogen fuel cells.
The following table outlines Brookfield Renewable's portfolio, as of 31 March 2023[2]:
| Type | Region | River Systems | Facilities | Capacity (MW) | LTA (GWh) | Storage Capacity (GWh) |
| Hydroelectric | United States | 30 | 136 | 2905 | 11963 | 2543 |
| Canada | 19 | 33 | 1361 | 5178 | 1261 | |
| Colombia | 11 | 17 | 2953 | 15891 | 3703 | |
| Brazil | 27 | 43 | 940 | 4811 | - | |
| Total | 87 | 229 | 8159 | 37843 | 7507 | |
| Wind | United States | - | 39 | 3652 | 11934 | - |
| Canada | - | 4 | 483 | 1438 | - | |
| Europe | - | 42 | 1118 | 2551 | - | |
| Brazil | - | 19 | 457 | 1950 | - | |
| Asia | - | 21 | 1225 | 3104 | - | |
| Total | - | 125 | 6935 | 20977 | - | |
| Solar | - | - | 149 | 3957 | 8476 | - |
| DE&SS | - | 2 | 6261 | 6326 | 2439 | 5220 |
| Total | - | 89 | 6764 | 25377 | 69735 | 12727 |
LTA = Long term average, 1 GWh can power up to 750,000 homes in the US.
Hydroelectric power capacity is the highest, followed by Wind and DE&SS, with Solar making up the smallest proportion of energy production.
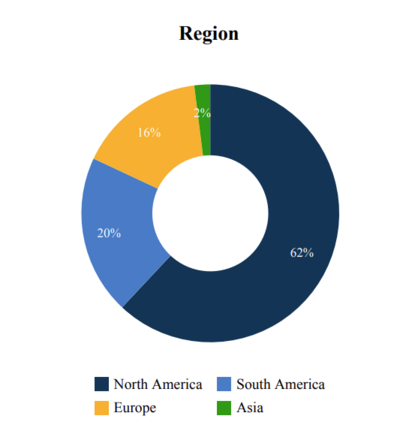
Brookfield Renewable partners are based in Toronto and traded on the NYSE and have a long history operating in North America, hence it is no surprise 62% of their portfolio is based in North America.
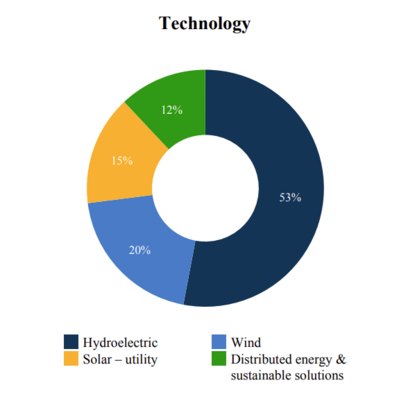
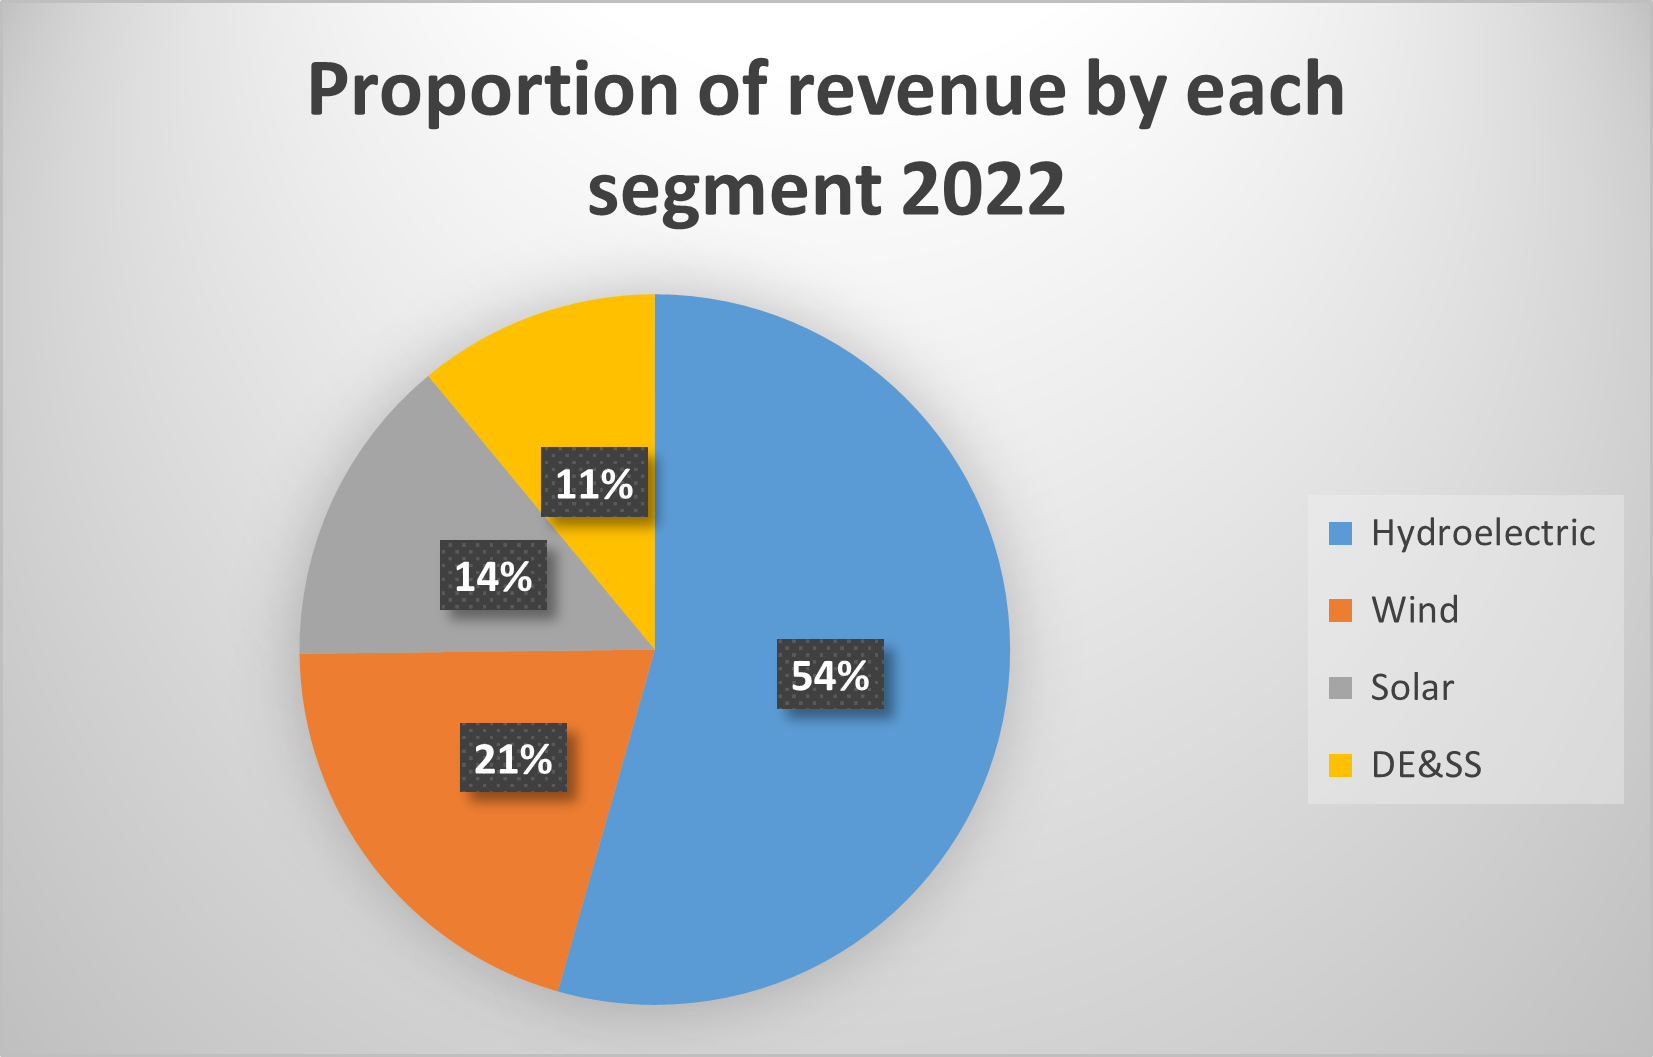
Brookfield Renewable partners' portfolio consists of 53% Hydroelectric Power, 20% Wind and 15% Solar power. The other 12% associated with Distributed energy and sustainable solutions are energy sources such as EV charging, Nuclear, and hydrogen fuel cells.
Projects [4] edit edit source
Renewable Development edit edit source
Brookfield Renewable Partners has agreed to invest up to $6.4 billion of capital to fuel growth and acquire new platforms to enhance their current offering. As such, the company has invested in 3 large renewable development businesses in the U.S.; Urban Grid, Standard Solar and Scout Clean Energy. These investments will help to expand their presence in the U.S.
Westinghouse edit edit source
Brookfield Renewable Partners formed a strategic partnership with Cameco to acquire Westinghouse, one of the world's largest nuclear services businesses. The company believes that nuclear power and hydroelectricity are the only clean forms of baseload power generation. Total equity expected to be invested is around $4.5 billion, and the company along with its partners will own a 51% interest. The transaction is expected to close in the second half of 2023.
Other Investments edit edit source
Brookfield Renewable has invested in a number of asset classes complementary to their core renewable assets, such as carbon capture and storage, recycling and renewable natural gas (RNG). This includes an investment in California Bioenergy, a leading developer, operator and owner of RNG. The company has invested an initial $150 million in a downside protected convertible structure, and have a priority right to invest an additional $350 million to support the development of new agriculture RNG assets.
Management [5] edit edit source

Chairman of the board - Jeffrey Blidner: edit edit source
On the board since 2011. Blidner is also the vice chair of Brookfield Asset Management. Prior to joining Brookfield in 2000, he was a senior partner of a Canadian law firm.

Chief Executive Officer - Connor Teskey: edit edit source
On the board since 2020. Teskey is also the president of Brookfield Asset Management. He is responsible for investments, operations and the expansion of the Renewable Power & Transition business. Teskey joined Brookfield in 2012 and held a variety of investment, financing and restructuring roles, prior to joining he worked in corporate debt origination at a Canadian bank.

Chief Financial Officer - Wyatt Hartley: edit edit source
On the board since 2018. Hartley directs all capital markets activities for the business, including accounting, financial reporting, treasury, taxation and investor relations on a global basis. He has held several senior finance positions across the organization, including Chief Financial Officer of Brookfield Infrastructure Group’s operations in the Americas and Chief Financial Officer of Acadian Timber. Prior to joining Brookfield in 2010, Hartley worked at a big-four accounting firm.

General Counsel - Jennifer Mazin: edit edit source
On the board since 2015. Mazin is responsible for transaction execution and public company matters, including corporate governance and public disclosure. Prior to joining Brookfield in 2014, Mazin was Assistant General Counsel at a large global mining company and worked at a New York-based law firm, where she focused on cross-border corporate finance transactions, mergers and acquisitions as well as governance and disclosure requirements.
Chair, Brookfield Asset Management; Head of Transition Investing - Mark Carney edit edit source
Mark Carney is the Chair of Brookfield Asset Management. He is also the Head of Transition Investing and in this role, he is focused on the development of products for investors that will combine positive social and environmental outcomes with strong risk-adjusted returns.

Mr. Carney is an economist and banker who served as the Governor of the Bank of England from 2013 to 2020, and prior to that as Governor of the Bank of Canada from 2008 until 2013. He was Chairman of the Financial Stability Board from 2011 to 2018. Prior to his governorships, Mr. Carney worked at Goldman Sachs as well as the Canadian Department of Finance. He is a long-time and well-known advocate for sustainability, specifically with regard to the management and reduction of climate risks, and is currently the United Nations Special Envoy for Climate Action and Finance and Co-Chair for the Glasgow Finance Alliance for Net Zero. Mr. Carney holds doctorate and master’s degrees from Oxford University and a bachelor’s degree in Economics from Harvard University.
Market edit edit source
Serviceable Available Market edit edit source
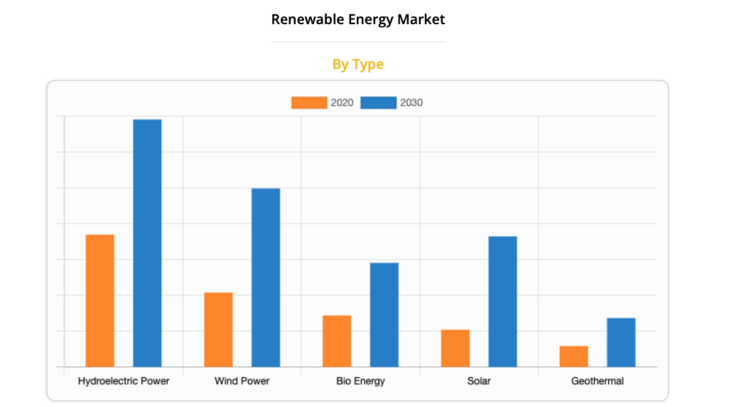
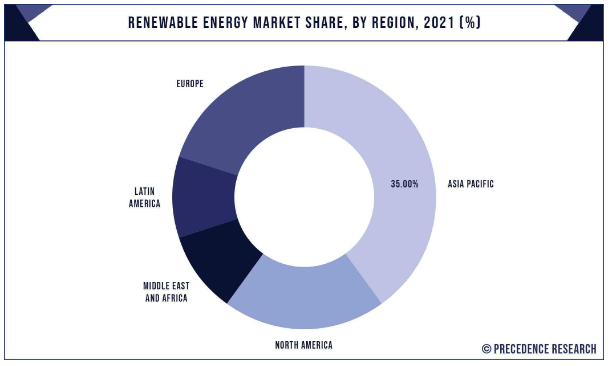
The total serviceable market is the global renewable energy market which is worth $988.6 billion. It is expected to grow with a total CAGR of 8.6% and is expected to be worth $1912 billion by 2030.
The fastest growing and largest market for renewable energy is the Asia Pacific Region with a CAGR of 9.7%. [6]
Competitors edit edit source
NextEra Energy edit edit source
NextEra Energy, Inc. (NYSE: NEE) is a leading clean energy company headquartered in Juno Beach, Florida with over $60 billion in assets under management. NextEra Energy owns a competitive clean energy business, NextEra Energy Resources, LLC, which, together with its affiliated entities, is the world’s largest generator of renewable energy from the wind and sun and a world leader in battery storage. Through its subsidiaries, NextEra Energy generates clean, emissions-free electricity from seven commercial nuclear power units in Florida, New Hampshire and Wisconsin. NextEra Energy has been recognized often by third parties for its efforts in sustainability, corporate responsibility, ethics and compliance, and diversity. NextEra Energy is ranked No. 1 in the electric and gas utilities industry on Fortune’s 2022 list of “World’s Most Admired Companies,” recognized on Fortune’s 2021 list of companies that “Change the World” and received the S&P Global Platts 2020 Energy Transition Award for leadership in environmental, social and governance.[7]
Market Cap: $152.4 billion
Enel Green Power edit edit source
Enel Green Power was founded in December 2008 inside the Enel Group to develop and manage power generated from renewable resources worldwide.
Enel Green Power manage more than 1,200 power plants on five continents. They’re present with assets in operation or under construction in 21 countries and manage development activities in a further 5 countries. Enel Green Power have over 59 GW of installed renewable capacity from a mix of renewable resources, including wind, solar, hydroelectric and geothermal. Enel Green Power are playing a key role in the energy transition as one of the world’s leading renewable energy companies. Their goal is to accompany the planet into a new era of sustainable, decarbonized energy for all.[8]
Market cap: $62.95 billion
Ownership [9] edit edit source
| Shareholder | Stake |
| Brookfield Renewable Power Inc. | 52.37% |
| Brookfield Renewable Corporation | 9.20% |
| Brookfield Corporation | 2.71% |
| 1832 Asset Management L.P. | 1.91% |
| Fidelity International | 1.60% |
| BMO Asset Management Corp. | 1.37% |
| Principal Global Investors, LLC | 1.30% |
| RBC Global Asset Management Inc. | 0.91% |
| RBC Dominion Securities Inc. | 0.87% |
| 72.24% |
The top 10 stakeholders in Brookfield Renewable Partners make up 72.2% of the entire ownership. Other notable investors include Scotiabank (0.48%) and Morgan Stanley (0.39%).
Financials edit edit source
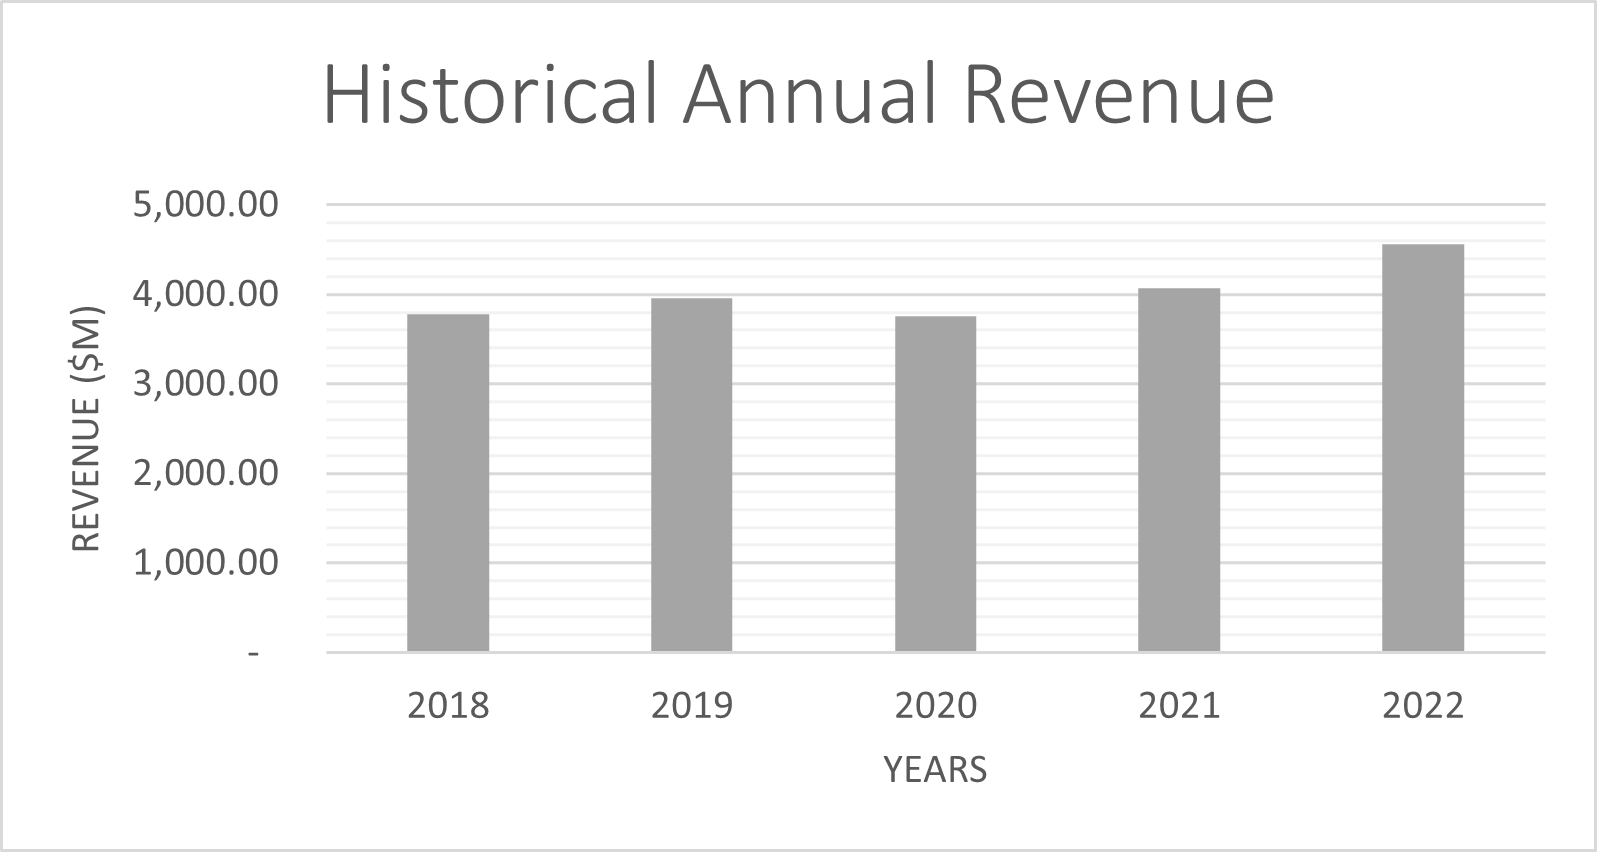
The table below shows the reported revenue of the previous 5 years for Brookfield Renewable Partners, other financial information required in the calculation of EBIT is also shown. All units are given in USD millions.
| Units ($m) | 2018 | 2019 | 2020 | 2021 | 2022 |
|---|---|---|---|---|---|
| Total Revenue | 3,784.00 | 3,962.00 | 3,755.00 | 4,071.00 | 4,565.00 |
| Cost of sales | - 457.00 | - 502.00 | - 540.00 | - 591.00 | - 605.00 |
| Selling, general and admin expenses | - 910.00 | - 896.00 | - 969.00 | - 1,062.00 | - 1,007.00 |
| Other Operating Expenses | - 153.00 | - 203.00 | - 334.00 | - 89.00 | - 108.00 |
| Depreciation | 1,151.00 | 1,271.00 | 1,367.00 | 1,501.00 | 1,583.00 |
| EBIT | 1,113.00 | 1,090.00 | 545.00 | 828.00 | 1,262.00 |
| CapEx | - 235.00 | - 195.00 | - 447.00 | - 1,967.00 | - 2,190.00 |
| Current Assets | 1,961.00 | 2,020.00 | 1,742.00 | 2,861.00 | 4,183.00 |
| Cash | 173.00 | 352.00 | 431.00 | 764.00 | 730.00 |
| Current Liabilities | 1,689.00 | 2,423.00 | 2,761.00 | 3,222.00 | 4,943.00 |
| NCWC | 99.00 | - 755.00 | - 1,450.00 | - 1,125.00 | - 1,490.00 |
| NCWC (inc/dec) | \ | 854.00 | 695.00 | - 325.00 | 365.00 |
Revenue has been increasing at 4.1% per annum since 2018, however, the business has not made a profit since 2018.
Revenue Breakdown by Segment edit edit source
The table below outlines the revenue generated by the renewable power portfolio of Brookfield Renewable Partners.
| Units ($m) | Hydroelectric | Wind | ||
|---|---|---|---|---|
| 2022 | 2021 | 2022 | 2021 | |
| North America | 964.00 | 876.00 | 332.00 | 370.00 |
| Brazil | 197.00 | 169.00 | 31.00 | 29.00 |
| Columbia | 273.00 | 224.00 | - | - |
| Europe | - | - | 134.00 | 125.00 |
| Asia | - | - | 41.00 | 32.00 |
| Total | 1,434.00 | 1,269.00 | 538.00 | 556.00 |
Total Solar revenue for 2022 - $374 million, and $348 million for 2021. Total DE&SS revenue for 2022 - $290 million, and $242 million for 2021. A breakdown by location is not possible. Hydroelectric revenue increased by 13% compared to 2021, wind declined by 3.2%, but solar and DE&SS increased by 7.5% and 19.8% respectively.
Forecasts edit edit source
The following table shows the forecast financials for the next 10 years, and the calculation of free cash flow, which will be used in the DCF valuation of the company.
| Units ($m) | 2023 | 2024 | 2025 | 2026 | 2027 | 2028 | 2029 | 2030 | 2031 | 2032 |
|---|---|---|---|---|---|---|---|---|---|---|
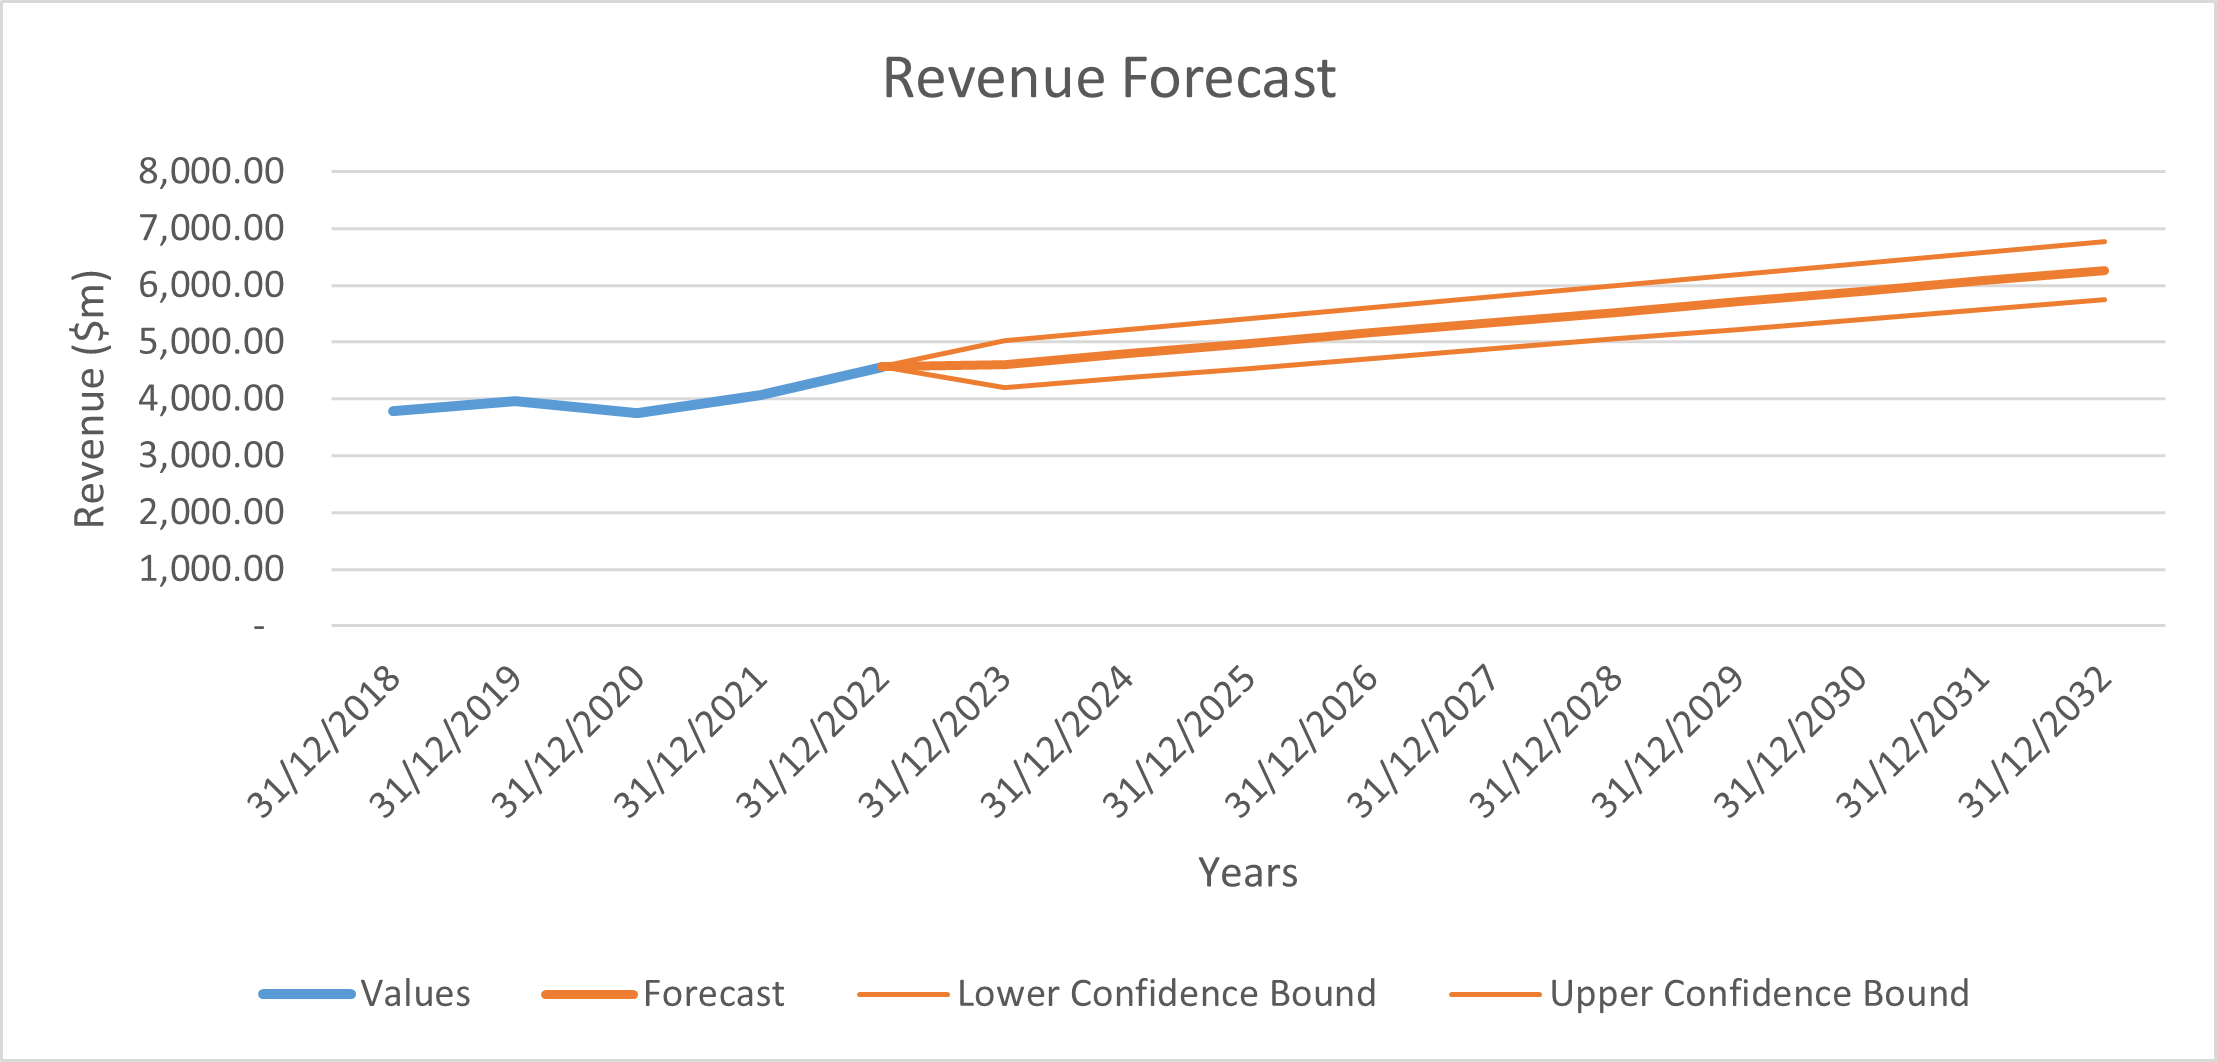
| Total Revenue | 4,608.35 | 4,792.07 | 4,975.78 | 5,159.49 | 5,343.21 | 5,526.92 | 5,710.64 | 5,894.35 | 6,078.06 | 6,261.78 |
| Cost of sales | - 624.11 | - 662.89 | - 702.73 | - 743.64 | - 785.61 | - 828.65 | - 872.76 | - 917.93 | - 964.16 | - 1,011.47 |
| Selling, general and admin expenses | - 993.52 | - 1,009.17 | - 1,022.98 | - 1,034.95 | - 1,045.09 | - 1,053.38 | - 1,059.85 | - 1,064.47 | - 1,067.26 | - 1,068.21 |
| Other Operating Expenses | - 208.43 | - 216.73 | - 225.04 | - 233.35 | - 241.66 | - 249.97 | - 258.28 | - 266.59 | - 274.90 | - 283.21 |
| Depreciation | 1,633.06 | 1,734.58 | 1,838.89 | 1,946.00 | 2,055.90 | 2,168.59 | 2,284.08 | 2,402.35 | 2,523.42 | 2,647.28 |
| EBIT | 1,149.24 | 1,168.70 | 1,186.14 | 1,201.55 | 1,214.95 | 1,226.32 | 1,235.68 | 1,243.01 | 1,248.32 | 1,251.62 |
| CapEx | - 1,099.80 | - 1,143.65 | - 1,187.49 | - 1,231.34 | - 1,275.18 | - 1,319.03 | - 1,362.87 | - 1,406.71 | - 1,450.56 | - 1,494.40 |
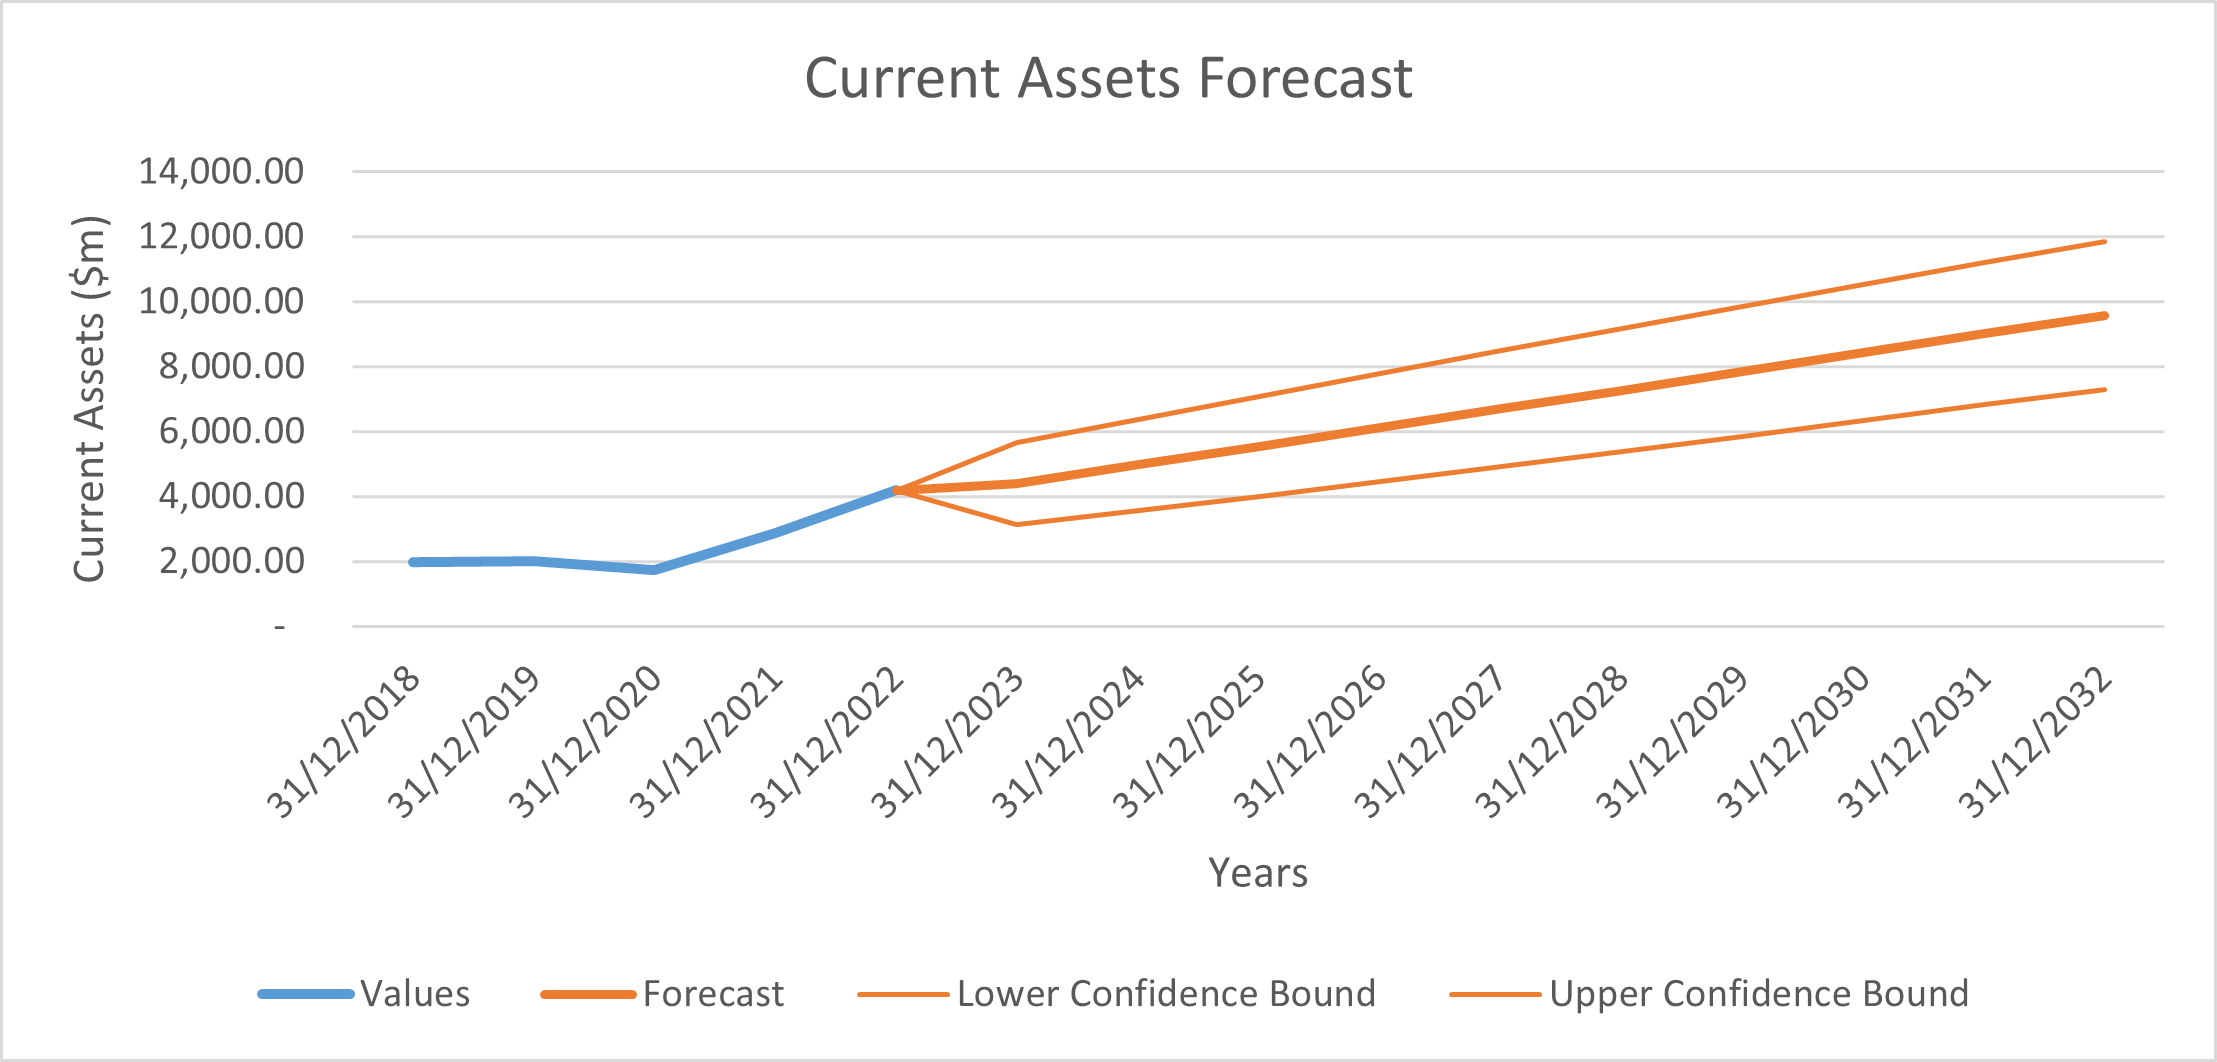
| Current Assets | 4,390.84 | 4,967.86 | 5,544.88 | 6,121.90 | 6,698.91 | 7,275.93 | 7,852.95 | 8,429.97 | 9,006.99 | 9,584.01 |
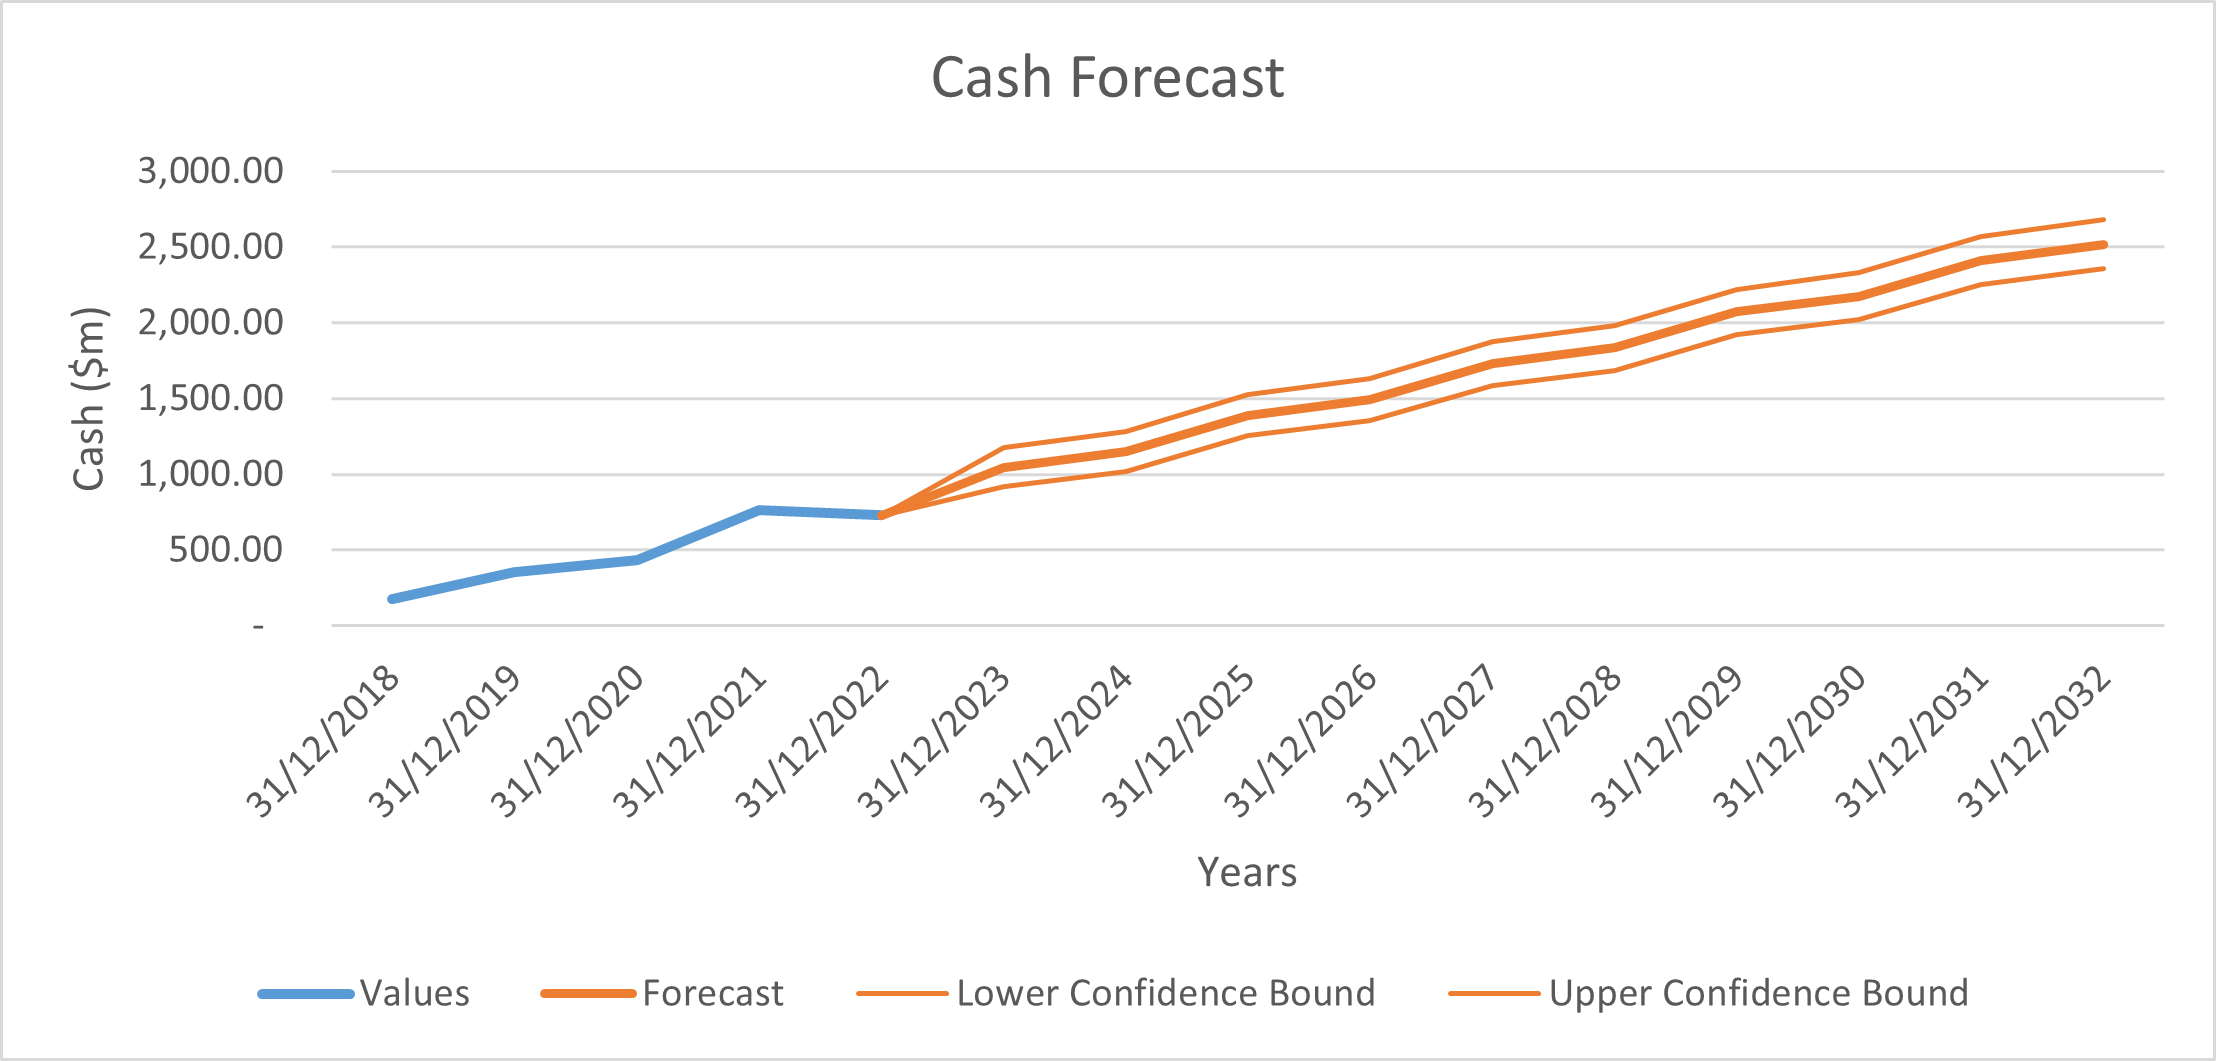
| Cash | 1,046.50 | 1,150.44 | 1,388.07 | 1,492.01 | 1,729.64 | 1,833.57 | 2,071.20 | 2,175.14 | 2,412.77 | 2,516.71 |
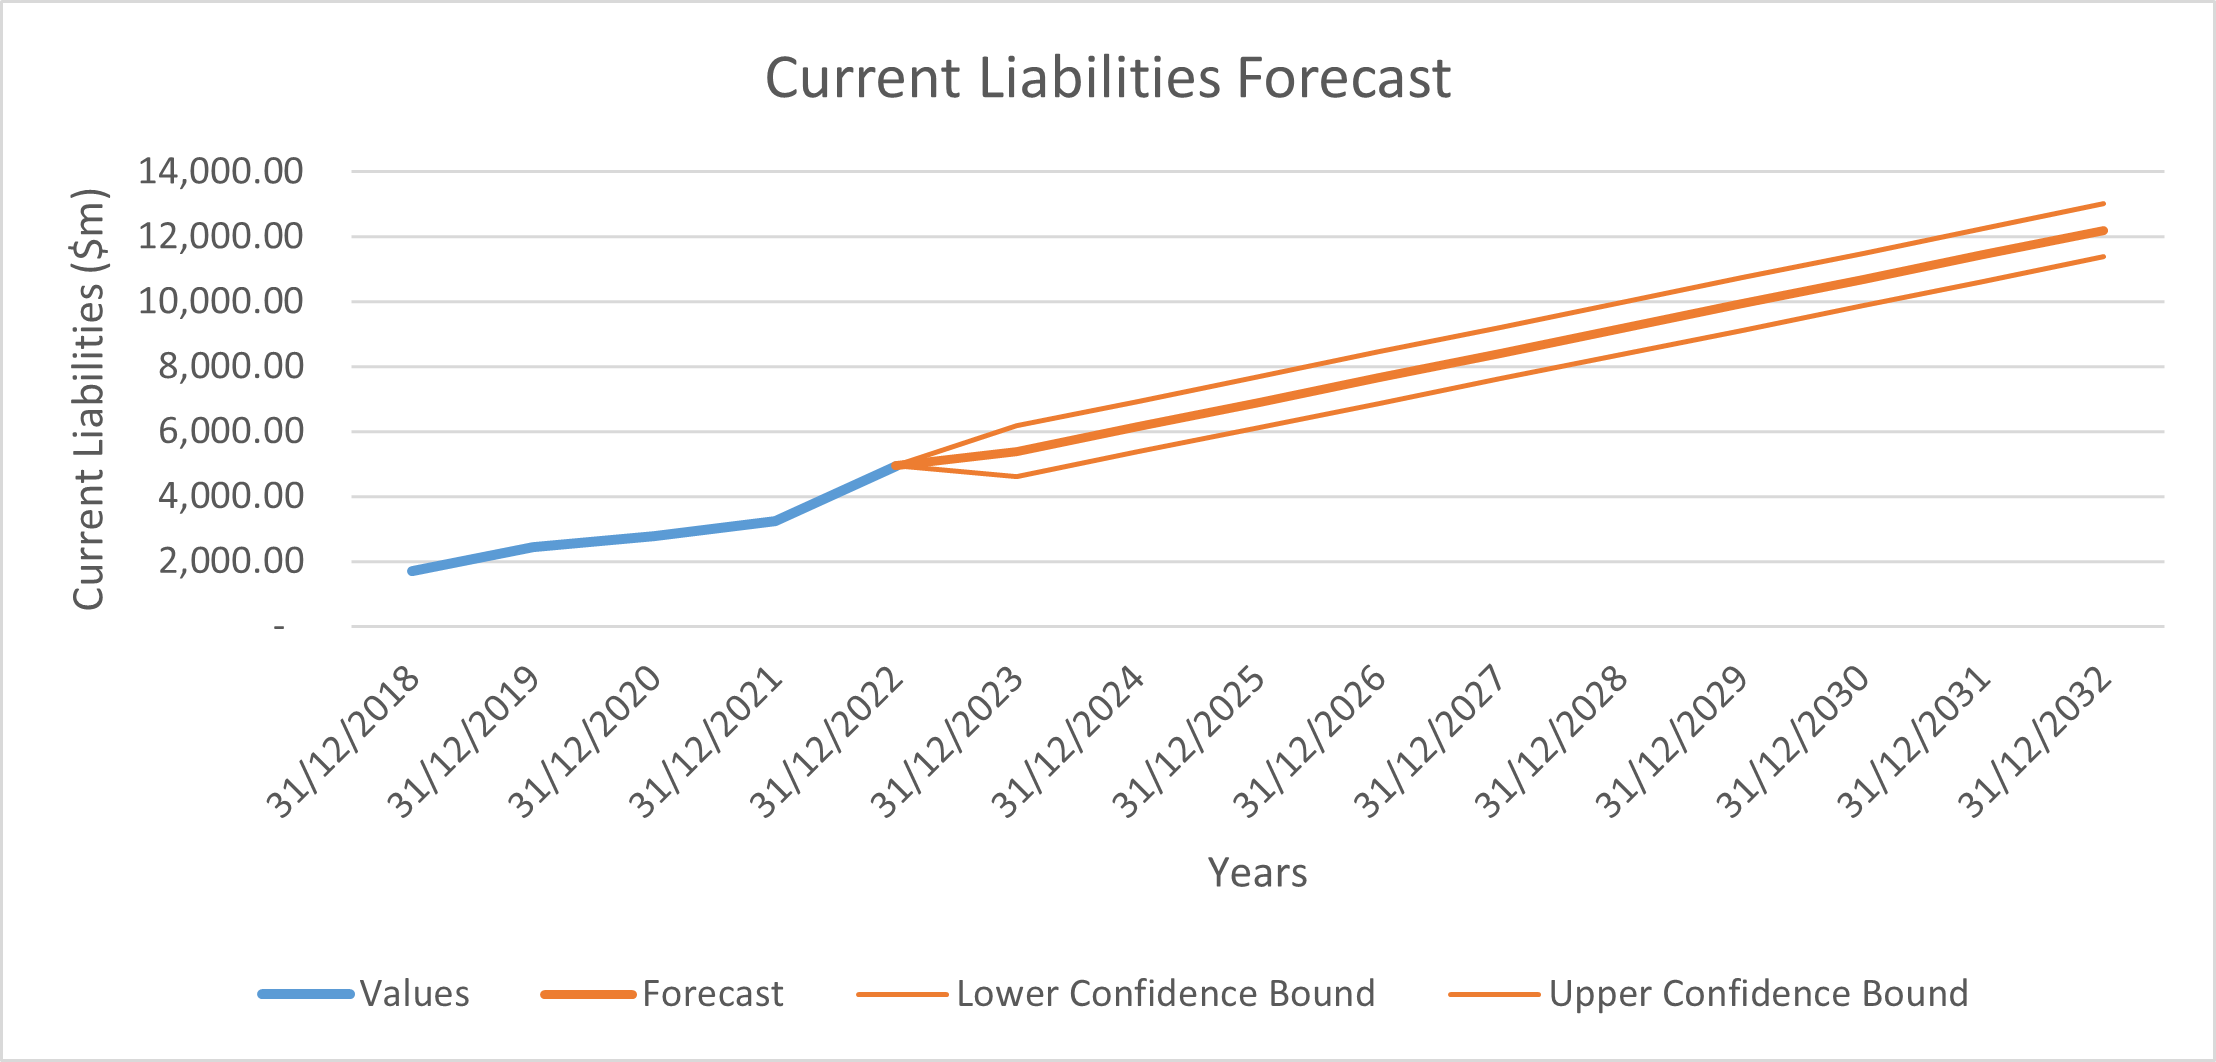
| Current Liabilities | 5,388.16 | 6,143.79 | 6,899.42 | 7,655.05 | 8,410.68 | 9,166.31 | 9,921.94 | 10,677.57 | 11,433.20 | 12,188.83 |
| NCWC | - 2,043.82 | - 2,326.37 | - 2,742.61 | - 3,025.16 | - 3,441.40 | - 3,723.95 | - 4,140.19 | - 4,422.74 | - 4,838.98 | - 5,121.53 |
| NCWC (inc/dec) | 553.82 | 282.55 | 416.24 | 282.55 | 416.24 | 282.55 | 416.24 | 282.55 | 416.24 | 282.55 |
| FCF | 1,994.97 | 1,796.75 | 2,004.69 | 1,946.44 | 2,156.77 | 2,100.91 | 2,313.63 | 2,260.17 | 2,475.28 | 2,424.21 |
The table below shows the assumptions used to calculate the forecasts in the table above, in the case of revenue, current assets, cash and current liabilities, the built in forecast function in excel was used to provide more accurate values.
| 2018 | 2019 | 2020 | 2021 | 2022 | 2023 | 2024 | 2025 | 2026 | 2027 | 2028 | 2029 | 2030 | 2031 | 2032 | |
|---|---|---|---|---|---|---|---|---|---|---|---|---|---|---|---|
| Cost of sales % of revenue | 12.1% | 12.7% | 14.4% | 14.5% | 13.3% | 13.5% | 13.8% | 14.1% | 14.4% | 14.7% | 15.0% | 15.3% | 15.6% | 15.9% | 16.2% |
| SG&A % of revenue | 24.0% | 22.6% | 25.8% | 26.1% | 22.1% | 21.6% | 21.1% | 20.6% | 20.1% | 19.6% | 19.1% | 18.6% | 18.1% | 17.6% | 17.1% |
| Other expenses % of revenue | 4.0% | 5.1% | 8.9% | 2.2% | 2.4% | 4.5% | 4.5% | 4.5% | 4.5% | 4.5% | 4.5% | 4.5% | 4.5% | 4.5% | 4.5% |
| Depreciation % of revenue | 30.4% | 32.1% | 36.4% | 36.9% | 34.7% | 35.4% | 36.2% | 37.0% | 37.7% | 38.5% | 39.2% | 40.0% | 40.8% | 41.5% | 42.3% |
| CapEx % of revenue | 6.2% | 4.9% | 11.9% | 48.3% | 48.0% | 23.9% | 23.9% | 23.9% | 23.9% | 23.9% | 23.9% | 23.9% | 23.9% | 23.9% | 23.9% |
The graphs below show the forecast models for revenue, current assets, cash and current liabilities.
DCF and WACC edit edit source
The following table shows the WACC calculation:
| Risk Free Rate of Return | 3.8%[10] |
| Beta | 0.74[11] |
| Market Rate of Return | 9.8%[12] |
| Cost of Equity | 8.3% |
| Credit Spread | 2.00%[13] |
| Cost of Debt | 4.6% |
| Shares Outstanding | 288.78[14] |
| Share Price | 29.96[15] |
| Equity | 8,651.85 |
| Long Term Debt | 22,797.00[16] |
| Debt | 830.99 |
| E/D+E | 91.2% |
| D/D+E | 8.8% |
| WACC | 7.9% |
The following table shows a 10 year DCF valuation for Brookfield Renewable Partners. The effective tax rate used for the WACC calculation above and in the DCF valuation below was set at 21%. The terminal growth rate was set at 3.3%, equivalent to the annualised US GDP growth rate.
| Units ($m) | 2023 | 2024 | 2025 | 2026 | 2027 | 2028 | 2029 | 2030 | 2031 | 2032 |
|---|---|---|---|---|---|---|---|---|---|---|
| FCF | 1,994.97 | 1,796.75 | 2,004.69 | 1,946.44 | 2,156.77 | 2,100.91 | 2,313.63 | 2,260.17 | 2,475.28 | 2,424.21 |
| Discount Factor | 0.965507934 | 0.895146668 | 0.82991297 | 0.769433169 | 0.713360826 | 0.661374748 | 0.613177148 | 0.568491943 | 0.527063166 | 0.488653506 |
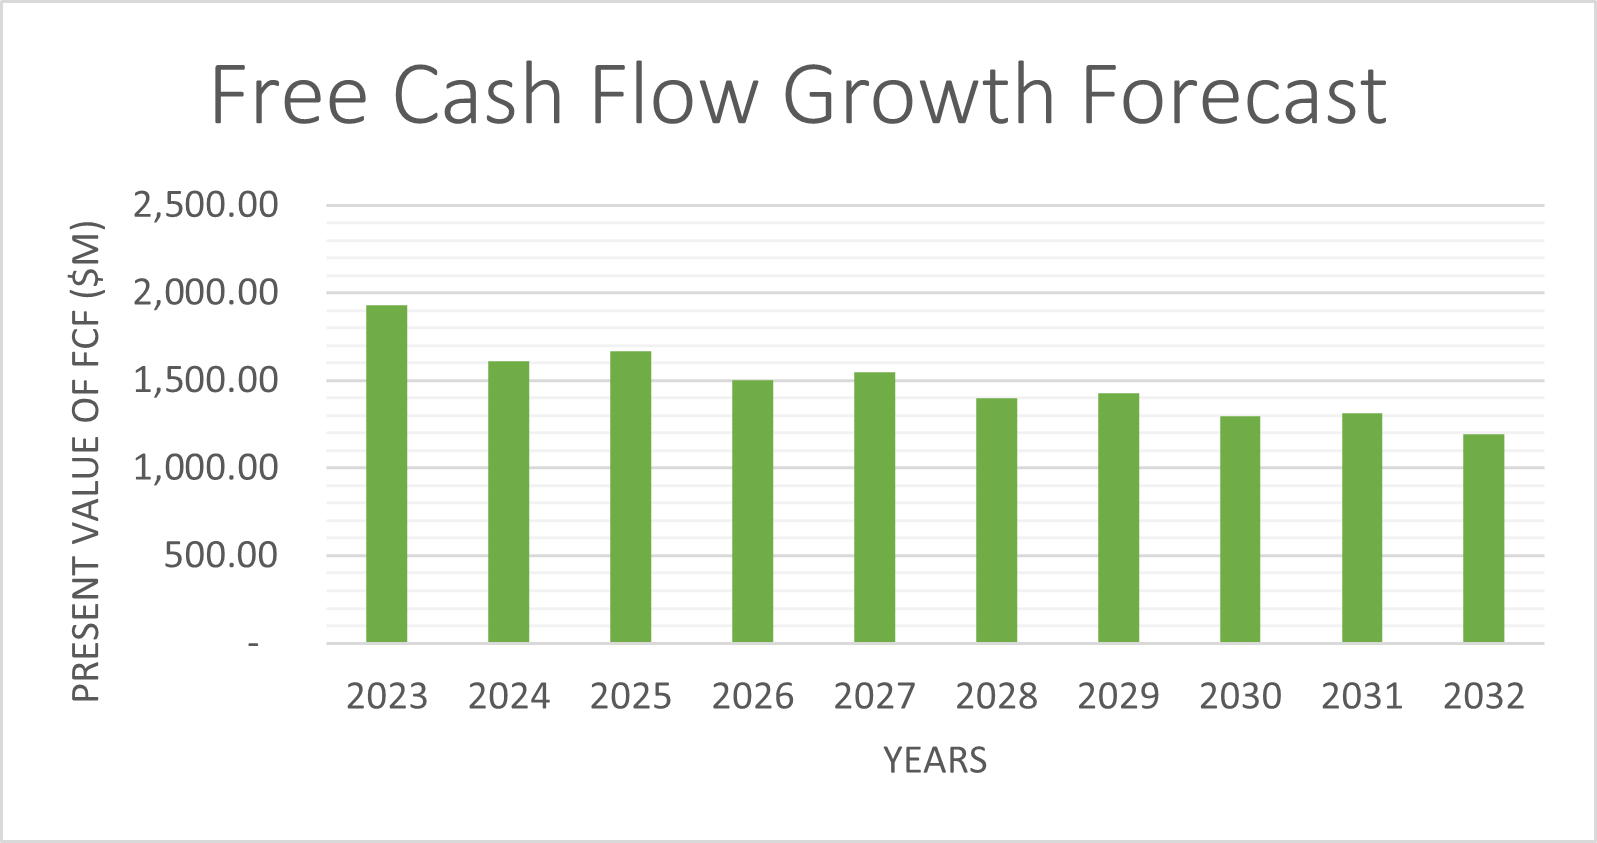
| Present Value of FCF | 1,926.16 | 1,608.35 | 1,663.72 | 1,497.65 | 1,538.56 | 1,389.49 | 1,418.67 | 1,284.89 | 1,304.63 | 1,184.60 |
| Growth Rate | 3.3% |
| Terminal Value | 54,662.74 |
| Present Value of Terminal Value | 26,711.14 |
| Enterprise Value | 41,527.85 |
| Equity Value | 17,210.85 |
| Implied Share Price | $ 59.60 |
The valuation shows that as of 14/07/2023, Brookfield Renewable Partners is undervalued. There is a potential upside of 99% over 10 years, equivalent to an annual share price rise of 9.9% from the end of 2023.
The sensitivity analysis below shows how share price varies in different growth rate environments, and for different WACC values.
| $ 59.60 | WACC | ||||||||
|---|---|---|---|---|---|---|---|---|---|
| 6.0% | 6.5% | 7.0% | 7.5% | 8.0% | 8.5% | 9.0% | 9.5% | ||
| Growth Rate | 2.0% | $ 94.76 | $ 75.06 | $ 59.31 | $ 46.42 | $ 35.68 | $ 26.60 | $ 18.82 | $ 12.08 |
| 2.5% | $ 113.07 | $ 88.75 | $ 69.83 | $ 54.70 | $ 42.32 | $ 32.00 | $ 23.27 | $ 15.79 | |
| 3.0% | $ 137.48 | $ 106.34 | $ 82.98 | $ 64.81 | $ 50.27 | $ 38.38 | $ 28.46 | $ 20.07 | |
| 3.5% | $ 171.66 | $ 129.80 | $ 99.89 | $ 77.45 | $ 60.00 | $ 46.03 | $ 34.59 | $ 25.06 | |
| 4.0% | $ 222.92 | $ 162.64 | $ 122.44 | $ 93.71 | $ 72.15 | $ 55.38 | $ 41.95 | $ 30.96 | |
| 4.5% | $ 308.36 | $ 211.90 | $ 154.00 | $ 115.38 | $ 87.78 | $ 67.07 | $ 50.95 | $ 38.04 | |
| 5.0% | $ 479.25 | $ 294.01 | $ 201.35 | $ 145.73 | $ 108.62 | $ 82.10 | $ 62.19 | $ 46.69 | |
Relative Valuation edit edit source
Brookfield Renewable Partners was compared to some of it's competitors in the renewable energy market. As the company made a loss in 2022, some multiples, such as the price to earnings ratio and earnings per share, are negative. This makes it difficult to accurately compare to competitors. The calculations are based off of a five year average.
| Stock | Price to Earnings Ratio | Return on Equity | Earnings Per Share | Dividend Yield | Annual Dividend | Return on Assets | Dividend Growth |
|---|---|---|---|---|---|---|---|
| BRP | -50.30 | -3.03% | -0.60 | 3.53% | 1.26 | 0.46% | 0.52% |
| General Electric | 208.20 | 21.22% | 0.53 | 1.56% | 0.32 | 4.42% | -47.04% |
| Iberdrola SA | 16.00 | 9.67% | 0.72 | 0.02% | N/A | 3.66% | N/A |
| NextEra Energy | 36.30 | 16.97% | 2.10 | 2.02% | 1.70 | 3.69% | 11.59% |
| Vestas Wind Systems | -16.30 | -22.98% | -1.73 | 0.09% | N/A | -3.96% | N/A |
| Canadian Solar Inc. | 11.20 | 16.27% | 3.44 | N/A | N/A | 4.13% | N/A |
| Enel Green Power | 14.40 | 10.51% | 0.43 | 5.57% | 0.44 | 2.19% | 11.04% |
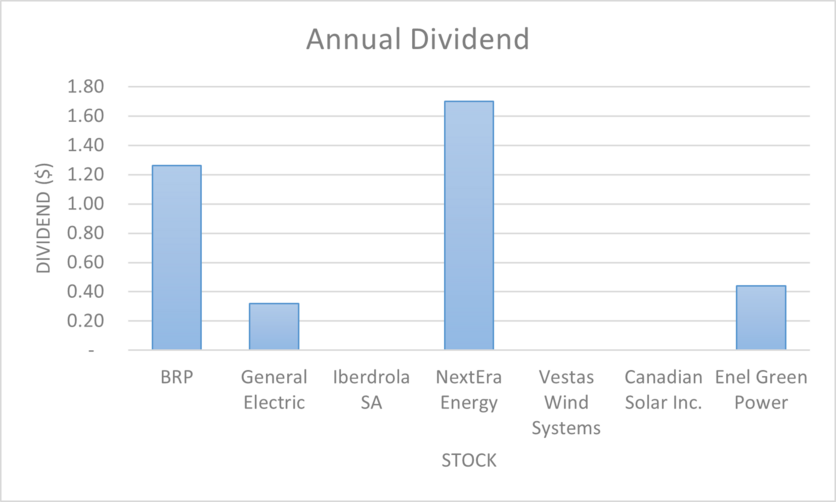
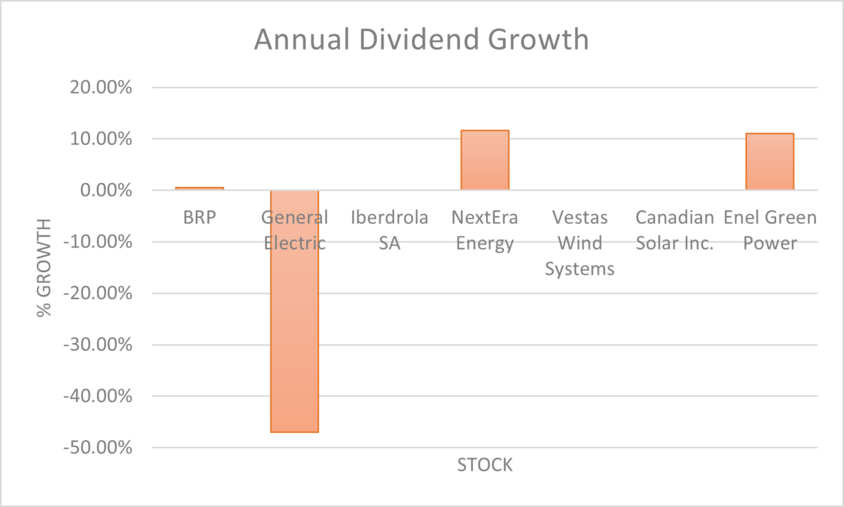
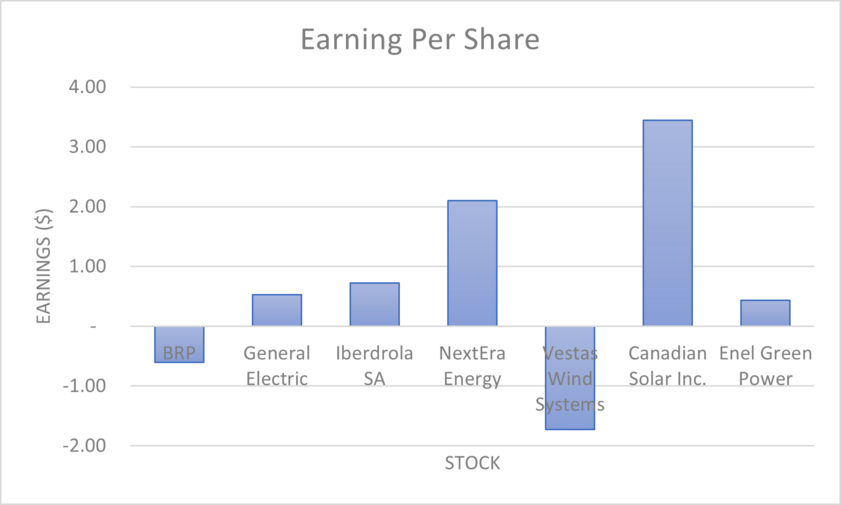
The relative valuation shows that Brookfield Renewable Partners pays out the second highest dividend amongst it's competitors, behind only General Electric. Brookfield Renewable is also top 3 for dividend growth, with General Electric having seen massive declines in dividend pay-out, meaning that Brookfield Renewable is a stock with good income prospects.
Risks[4] edit edit source
Financial Risks edit edit source
Electricity Price - Exposure to movements in the market price of energy.
Foreign Currency - Exposed to foreign currency risk including the Canadian dollar, Brazilian real, Euro, British pound sterling, Colombian peso, Indian rupee, Chinese yuan, and Malaysian ringgit. The risk is related to operations, anticipated transactions and certain foreign currency debt.
Interest Rate - Exposed to interest rate risk on the interest rates for variable rate debt.
Credit - Exposed to credit risk from operating activities and certain financing activities. The risk is due to counterparties not being able to meet their obligations on energy contracts, interest rate swaps, forward foreign exchange contracts, physical electricity and gas transactions as well as trade receivables.
Liquidity - Exposed to liquidity risk for financial liabilities. Also subject to internal liquidity risk as they conduct business activities through separate legal entities, and are dependent on receipt of cash from those entities to pay off corporate expenses and make dividend payments to shareholders.
Industry and Operational Risks edit edit source
Natural resource availability - Revenues generated by renewable power facilities are correlated to the amount of electricity produced, which are dependent on available water flows, wind and irradiance. The generation facilities are susceptible to damage during extreme weather events, climate change may increase the frequency of extreme weather events, as well as cause a shift in the existing weather patterns.
Contract Expiration - Certain power purchasing agreements in the portfolio will be subject to re-contracting in the future, if the price of electricity in power markets is declining at the time of re-contracting, it will impact the ability of the company to be able to re-negotiate at favourable terms.
Concession renewal - The company holds concessions and has rights to operate facilities, e.g. for hydroelectric facilities, the concessions include the rights to the land and water required for power generation. If renewal rights are not granted or an additional cost is imposed on the concession, it could significantly impact operational capacity and profitability.
Dam failures - Occurrence of dam failures at any hydroelectric generation stations would result in loss of generating capacity until the failure has been repaired, harm to third parties or the environment could expose the company to liability costs.
Other Risks edit edit source
Cyber Attacks - The business may be subject to cyber security risks or other breaches of information intended to obtain unauthorised access to proprietary information and that of business partners, destroy data or disable systems through cyber attacks. Any breach of information could go undetected for some time.
Development Failures - The company has a large development pipeline that includes projects at different levels of advancement, there is no guarantee that all project will be successfully delivered, or delivered on time.
Employee Retention - The business depends on the skill of the professionals employed, future success will depend on the continued service of these individuals, which could impact the ability of the company to achieve its objectives.
ESG Factors [4] edit edit source
Decarbonisation is a global goal shared by many governments, corporations and investors. Brookfield Renewable is a leading owner and developer of clean energy, their clean energy assets already support others globally to reduce emissions, and the company is committed to continuing to partner with others to drive down emissions. They have also set a target to reach net zero for their own scope 1 and 2 emissions by 2030, they will use increased renewable energy to power their assets and offices.
Brookfield Renewable is also considering wider environmental concerns such as integrating biodiversity protection and water and waste management into decision making and activities. The company is also committed to engaging and collaborating with stakeholders, including communities, indigenous peoples, local agencies and environmental NGO's. There is a green financing committee that manages sustainable financing strategy for the company.
Brookfield Renewable maintain a strong focus on health and safety, by supporting the development of employees and striving to create an open and inclusive work environment. The company aims to be an industry leader in risk management and incident prevention. When considering investing in or building a new facility, due diligence is conducted to identify local stakeholders that could potentially be affected by or interested in the operations, and lines of communication are established.
The company has a human rights program, which includes adhering to all laws and regulations that apply to operations regarding fair labour and employment conditions. Brookfield Renewable maintains high ethical standards, including implementing a code of business conduct and ethics, anti-bribery and anti-corruption policies, a whistle-blower hotline as well as supporting controls and procedures.
Progress on targets:
| Topic | Target | Target Year | Progress | Performance |
|---|---|---|---|---|
| Climate change | Achieve net-zero Scope 1 and 2 emissions in existing renewable operations by 2030. | 2030 | On track | 18% reduction in Scope 1 and 2 emissions from base year 2020. |
| Develop an additional 21,000 megawatts of new clean energy capacity by 2030, which would be equivalent to doubling our existing portfolio to 42,000 megawatts. | 2030 | On track | Added 3,475 megawatts in 2022 with a total of approximately 25,400 megawatts of installed capacity. | |
| Set emissions reduction targets and plans to align with the goals of the Paris Agreement for 100% of carbon-intensive investments. | Annual | Met | 100% of carbon-intensive investments with targets aligned with the goals of the Paris Agreement. | |
| Biodiversity | By 2024, develop biodiversity management plans for 100% of our identified sites, prioritizing sites in biodiversity sensitive areas. | 2024 | On track | Initiated and continued to make progress on developing biodiversity management plans. |
| Assess nature-related physical and transition risks and opportunities in line with the Taskforce on Naturerelated Financial Disclosures (TNFD) recommendations in 2022. | 2022 | Met | In 2022, assessed biodiversity practices against the draft TNFD recommendations. | |
| Water & waste resources | In 2022, develop plans for our major components, including wind turbine blades and solar panels, to support our goal of diverting these from landfill. | 2022 | Met | In 2022, developed major component plans for solar panels and wind turbines. |
| By 2023, develop water management plans for 100% of our operations in areas of high water stress | 2023 | On track | In 2022, developed water management plans covering 57% of regional businesses with assets in areas of high water stress prioritizing water management plans for technology with elevated water needs. Will finalize the water management plans for the remaining businesses in 2023. | |
| By 2025, increase circularity and reduce the volume of waste we send to landfill by 20%. | 2025 | On track | In 2022, expanded central tracking system to better understand regional waste streams and waste management opportunities. | |
| Diversity & inclusion | By 2025, maintain gender diversity at the executive team and increase representation at the Board and senior leadership levels. | 2025 | Monitor | In 2022, maintained gender diversity at the executive team. Female representation at the Board level remained at 33% while the percentage of females at the senior leadership levels slightly decreased. |
| Occupational health & safety | Provide on-boarding health, safety, security and environment (HSS&E) training to 100% of new employees and contractors working in our facilities. | Annual | Monitor | In 2022, provided HSS&E training to 100% of new employees working in our facilities. |
| Maintain a cumulative high-risk incident frequency rate of less than 1.5 per one million hours worked. | Annual | Met | In 2022, high-risk incident frequency rate was 1.41. | |
| Achieve 95% of planned Safe Work Observations across our businesses with mature HSS&E programs. | Annual | Met | In 2022, achieved more than 95% of the Safe Work Observation targets set across all of our businesses with mature HSS&E programs. | |
| Cybersecurity | Train 100% of employees on cybersecurity annually | Annual | Met | In 2022, all employees were trained on cybersecurity |
| Supply chain management | By 2025, target 50% of vendor spend with vendors who have an overarching sustainability policy in place. | 2025 | On track | In 2022, vendors representing over 50% of spend had a sustainability or equivalent policy in place. |
| Governance | Provide quarterly updates to the Board of Directors on our ESG approach, performance and key topics such as physical and transitional risk and opportunities, net zero and emerging standards and regulation. | Ongoing | Met | Quarterly updates have been provided to the Board. |
References edit edit source
- ↑
- ↑ 2.0 2.1 2.2 2.3 Brookfield Renewable Partners Q1 2023 report - https://bep.brookfield.com/sites/bep-brookfield-ir/files/Brookfield-BEP-IR-V2/q1-2023/BEP-Q1-2023-Interim-Report-vf.pdf
- ↑ https://www.betterhomelab.com/how-many-homes-can-1-mw-power/#:~:text=To%20first%20answer%20your%20question,a%20coal%20power%20station's%20capacity.
- ↑ 4.0 4.1 4.2 4.3 Brookfield Renewable Partners Annual Report 2022 - https://bep.brookfield.com/sites/bep-brookfield-ir/files/brookfield/bep/reports-and-filings/regulatory-filings/annual-reports/2022/bep-2022-annual-report.pdf
- ↑ https://www.brookfield.com/about-us/leadership?filter=49
- ↑ https://www.vantagemarketresearch.com/industry-report/renewable-energy-market-1886#:~:text=Global%20Renewable%20Energy%20Market%20is,meet%20their%20climate%20change%20commitments.
- ↑ https://www.nexteraenergy.com/
- ↑ https://www.enelgreenpower.com/who-we-are/our-company
- ↑ https://simplywall.st/stocks/ca/utilities/tsx-bep.un/brookfield-renewable-partners-shares/ownership
- ↑ https://markets.ft.com/data/bonds/tearsheet/summary?s=US10YT
- ↑ https://markets.ft.com/data/equities/tearsheet/summary?s=BEP.UN:TOR
- ↑ https://www.officialdata.org/us/stocks/s-p-500/1900
- ↑ S&P Global
- ↑ https://markets.ft.com/data/equities/tearsheet/summary?s=BEP:NYQ
- ↑ Share Price as of 14/07/2023 - https://markets.ft.com/data/equities/tearsheet/summary?s=BEP:NYQ
- ↑ https://markets.ft.com/data/equities/tearsheet/financials?s=BEP:NYQ&subView=BalanceSheet&periodType=q
- ↑ All financial data was taken from the financial times stock price pages.
- ↑ Brookfield Renewable Partners 2022 ESG report - https://bep.brookfield.com/sites/bep-brookfield-ir/files/Brookfield-BEP-IR-V2/2023/bep-esg-2022.pdf
