NVIDIA Corporation: Difference between revisions
(→AMD) |
mNo edit summary |
||
| Line 75: | Line 75: | ||
Nvidia's operations are marked by continuous innovation, strategic partnerships, and a commitment to delivering state-of-the-art technology solutions. Through its diverse product portfolio, Nvidia continues to shape the future of technology, gaming, AI, and autonomous vehicles, aligning itself with global trends and emerging market opportunities. | Nvidia's operations are marked by continuous innovation, strategic partnerships, and a commitment to delivering state-of-the-art technology solutions. Through its diverse product portfolio, Nvidia continues to shape the future of technology, gaming, AI, and autonomous vehicles, aligning itself with global trends and emerging market opportunities. | ||
== Macroeconomic Analysis == | == Macroeconomic Analysis == | ||
Revision as of 13:24, 9 August 2023
| File:-image of factory- -caption- | |
| Type | Public |
|---|---|
| |
| Industry |
|
| Founded | April 5, 1993 |
| Founders |
|
| Headquarters | Santa Clara, California , U.S. |
Areas served | Worldwide |
Key people | Jensen Huang (President and CEO) |
| Products |
|
| Services |
|
| Revenue | US$26.974 billion (2023) |
| US$4.224 billion (2023) | |
| US$4.368 billion (2023) | |
| Total assets | US$41.18 billion (2023) |
| Total equity | US$22.10 billion (2023) |
| Owner | Jensen Huang |
Number of employees | 26,196 (2023) |
| Website | https://www.nvidia.com/ |
| Footnotes / references 'footnotes' | |
Summary
NVIDIA Corporation provides graphics, and compute and networking solutions in the United States, Taiwan, China, and internationally. The company's Graphics segment offers GeForce GPUs for gaming and PCs, the GeForce NOW game streaming service and related infrastructure, and solutions for gaming platforms; Quadro/NVIDIA RTX GPUs for enterprise workstation graphics; vGPU software for cloud-based visual and virtual computing; automotive platforms for infotainment systems; and Omniverse software for building 3D designs and virtual worlds. Its Compute & Networking segment provides Data Center platforms and systems for AI, HPC, and accelerated computing; Mellanox networking and interconnect solutions; automotive AI Cockpit, autonomous driving development agreements, and autonomous vehicle solutions; cryptocurrency mining processors; Jetson for robotics and other embedded platforms; and NVIDIA AI Enterprise and other software. The company's products are used in gaming, professional visualization, datacenter, and automotive markets. NVIDIA Corporation sells its products to original equipment manufacturers, original device manufacturers, system builders, add-in board manufacturers, retailers/distributors, independent software vendors, Internet and cloud service providers, automotive manufacturers and tier-1 automotive suppliers, mapping companies, start-ups, and other ecosystem participants. It has a strategic collaboration with Kroger Co. NVIDIA Corporation was incorporated in 1993 and is headquartered in Santa Clara, California.
About the company
What is the mission of the company?
Nvidia mission statement is “to provide the latest NVIDIA news on products, technologies, and events. To highlight and engage with our fans.” And their goal is to create the future of computing by accelerating AI everywhere and committing to creating innovative technologies.
Company Overview
Nvidia Corporation is a leading global technology company that specializes in the design and manufacture of graphics processing units (GPUs) and system-on-a-chip units (SoCs). Founded in 1993 and headquartered in Santa Clara, California, Nvidia has transformed itself from a gaming-centric company to a diversified technology giant with a broad product portfolio.
With a focus on innovation and cutting-edge technology, Nvidia plays a significant role in various industries, including gaming, professional visualization, data centers, automotive, and artificial intelligence (AI). Its contributions to the development of GPU technology have been instrumental in driving advancements in deep learning, virtual reality (VR), and high-performance computing (HPC).
Nvidia's commitment to research and development has led to the creation of various platforms like Nvidia Drive for autonomous vehicles, Nvidia CUDA for parallel computing, and Nvidia Omniverse for collaborative 3D content creation. With a global presence and strategic partnerships with major technology firms, Nvidia continues to be at the forefront of technological advancement.
Business Operations
Nvidia operates in various segments within the technology industry, primarily focusing on GPU development, AI, and deep learning technologies. An overview of Nvidia's key operations is explained below:
GPU Development:
Nvidia's primary operation revolves around the design, development, and sale of GPUs. These processors are vital in rendering graphics for gaming, professional visualization, data center, and automotive markets. Nvidia's GPUs are known for their cutting-edge technology and high performance, positioning the company as a leader in the field.
AI and Deep Learning:
Nvidia leverages its GPU technology to enable AI and deep learning applications across various sectors, including healthcare, automotive, finance, and robotics. Its platforms provide the computational power necessary for training complex neural networks and implementing AI solutions.
Automotive and Autonomous Vehicles:
Nvidia's Drive platform powers autonomous vehicles, providing the necessary computing power for real-time processing and navigation. The company collaborates with automotive manufacturers and tech firms to create solutions for self-driving cars.
Data Centers and Cloud Computing:
Nvidia's GPUs are used in data centers and cloud computing infrastructures, facilitating high-performance computing and parallel processing tasks. The company partners with key players in the tech industry to offer optimized solutions for cloud-based applications.
Professional Visualization:
Nvidia's technology extends to professional visualization, catering to designers, artists, and scientists who require advanced graphics capabilities. The company's Quadro and Titan GPUs are tailored for high-end professional use.
Software and Services:
Nvidia also offers software and platform services that leverage its GPU technology. The CUDA programming model and the Nvidia AI Enterprise suite are examples of how the company enables developers to build and deploy AI-driven applications.
Nvidia's operations are marked by continuous innovation, strategic partnerships, and a commitment to delivering state-of-the-art technology solutions. Through its diverse product portfolio, Nvidia continues to shape the future of technology, gaming, AI, and autonomous vehicles, aligning itself with global trends and emerging market opportunities.
Macroeconomic Analysis
Macro sensitivity
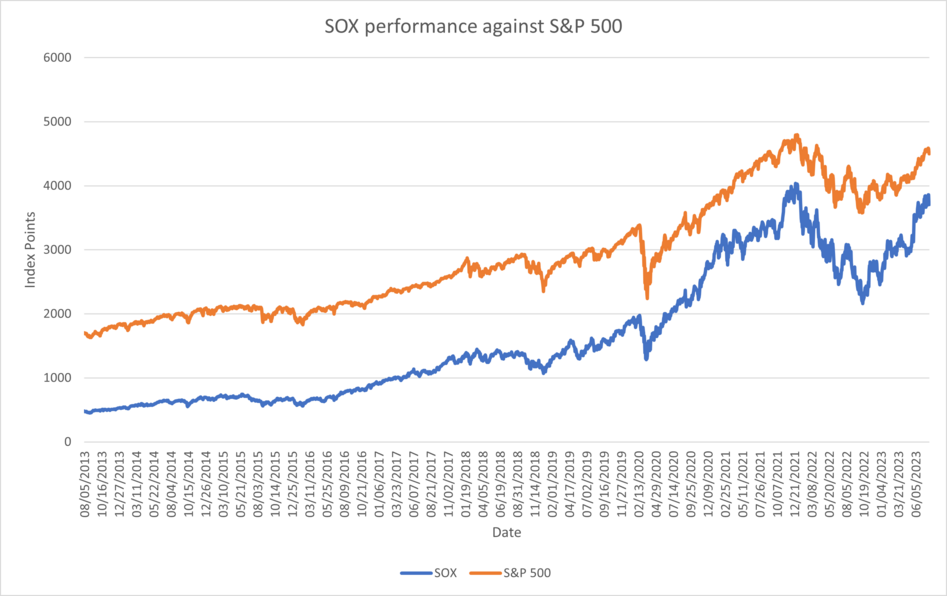
US Semiconductor companies are sensitive to economic conditions and market activities, with high beta. S&P 500 and SOX are heavily correlated. Nvidia has a high beta of 1.75[1] which measures the sensitivity to the market activity. This strong correlation indicate the performance of the semiconductor companies being heavily influenced by the general market activies, being affected by macroeconomic factors including the monetary policies, inflation rates, federal funds rate and many more.
Philadelphia Semiconductor Index (SOX)
Philadelphia Semiconductor Index (SOX) measures the performance of 30 largest United States semiconductor companies involved in the distribution, manufacturing and design of the product. Nvidia has the largest market capitalisation with $1.11T and second highest trailing price to earnings ratio of over 235.
Nvidia benefited from recent surging Artificial Intellignece demand and FOMO (fear of missing out) trades which substantially increased its valuation. Typically during recessionary period with economic hardship, growth stocks with high beta and PER suffer more than value stocks on the downside.
| Company | Ticker | Stock Price ($) (as of 04/08/2023) | Market Capitalisation ($, in billions) | Trailing Price to Earnings Ratio |
|---|---|---|---|---|
| Analog Devices, Inc. | ADI | 185.4 | 93.958 | 26.63 |
| Allegro MicroSystems, Inc | ALGM | 42.61 | 8.326 | 44.58 |
| Applied Materials, Inc. | AMAT | 146.22 | 123.626 | 19.42 |
| Advanced Micro Devices | AMD | 114.69 | 186.955 | 645.69 |
| ASML Holding N.V. | ASML | 679.81 | 273.87 | 33.04 |
| Broadcom Inc. | AVGO | 874.92 | 362.985 | 27.59 |
| Coherent Corp. | COHR | 47.47 | 6.708 | (negative) |
| Entegris, Inc. | ENTG | 101.02 | 15.209 | (negative) |
| GlobalFoundries Inc. | GFS | 58.64 | 32.818 | 21.37 |
| Intel Corporation | INTC | 34.73 | 146.035 | (negative) |
| IPG Photonics Corporation | IPGP | 110.93 | 5.226 | 51.85 |
| KLA Corporation | KLAC | 494.32 | 68.505 | 20.37 |
| Lam Research Corporation | LRCX | 689.13 | 93.092 | 19.28 |
| Lattice Semiconductor Corporation | LSCC | 90.71 | 12.673 | 68.91 |
| Microchip Technolog Incorporated | MCHP | 82.94 | 45.114 | 20.68 |
| Monolithic Power Systems, Inc. | MPWR | 522.18 | 24.99 | 54.83 |
| Marvell Technology, Inc. | MRVL | 62.01 | 53.974 | (negative) |
| Micron Technology, Inc. | MU | 69.27 | 76.167 | (negative) |
| Novanta Inc. | NOVT | 173.06 | 6.265 | 87.04 |
| NVIDIA Corporation | NVDA | 445.83 | 1110 | 235.39 |
| NXP Semiconductors N.V. | NXPI | 209.91 | 55.015 | 20.31 |
| ON Semiconductor Corporation | ON | 101.04 | 44.323 | 25.24 |
| QUALCOMM Incorporated | QCOM | 119.4 | 113.725 | 12.8 |
| Qorvo, Inc. | QRVO | 106.12 | 10.506 | 108.15 |
| Skyworks Solutions, Inc. | SWKS | 108.58 | 17.399 | 15.78 |
| Synaptics Incorporated | SYNA | 87.75 | 3.498 | 19.33 |
| Teradyne, Inc. | TER | 106.53 | 16.702 | 28.35 |
| Taiwan Semiconductor Manufacturing Company (TSMC) | TSM | 95.47 | 500.277 | 15.71 |
| Texas Instruments Incorporated | TXN | 167.52 | 152.998 | 18.91 |
| Wolfspeed, Inc. | WOLF | 58.71 | 7.404 | (negative) |
Recession
US Semiconductor stocks suffer brutally during economic recessions with more than 30% downside on the SOX index during the COVID outburst. NVIDIA however, remained resilient on artificial intelligence forecast and increasing demand. However, from the start of the US Federal Reserve's attempt to bring long term inflation rate to 2% with quantitative tightening and interest rate hikes, the stock fell for more than 65% from November 2021 to September 2022 before increasing more than 300% with increased artificial intelligence demand and FOMO trades.
Numerous potential recession signals are evident which need to be cautiously considered. These include the worst inverted US treasury yield curve since 1981 stagflation and oil crisis[5], two consecutive negative quarterly growth on US Gross Domestic Income (GDI)[6], the debt crisis (explained below), commercial real estate crisis, and many more. Although the labour market remains tighter than expected with resilient economic strength, deteriorating economy will likely to negatively impact the perfomance of NVIDIA based on historical performance of semiconductor companies.
Credit Ratings
Credit ratings of the United States is a major catalyst for market activites. On 1st of August, Fitch downgraded the credit rating of the United States from the highest rating of AAA, to AA+. Fiscal deterioration and growing government deficit burden were the reasons behind this downgrade.[7] Previously, the credit rating downgrade of the US only occured once in 2011, following the aftermath of 2008 Financial Crisis and the Federal Reserve's attempt to revive the economy with vast amount of quantitative easing and increased balance sheet.
This downgrade is significant as investors began to question the economic strength of the US. With high macroeconomic sensitivity, the SOX index plummeted by 6% after the announcement.
Debt Crisis
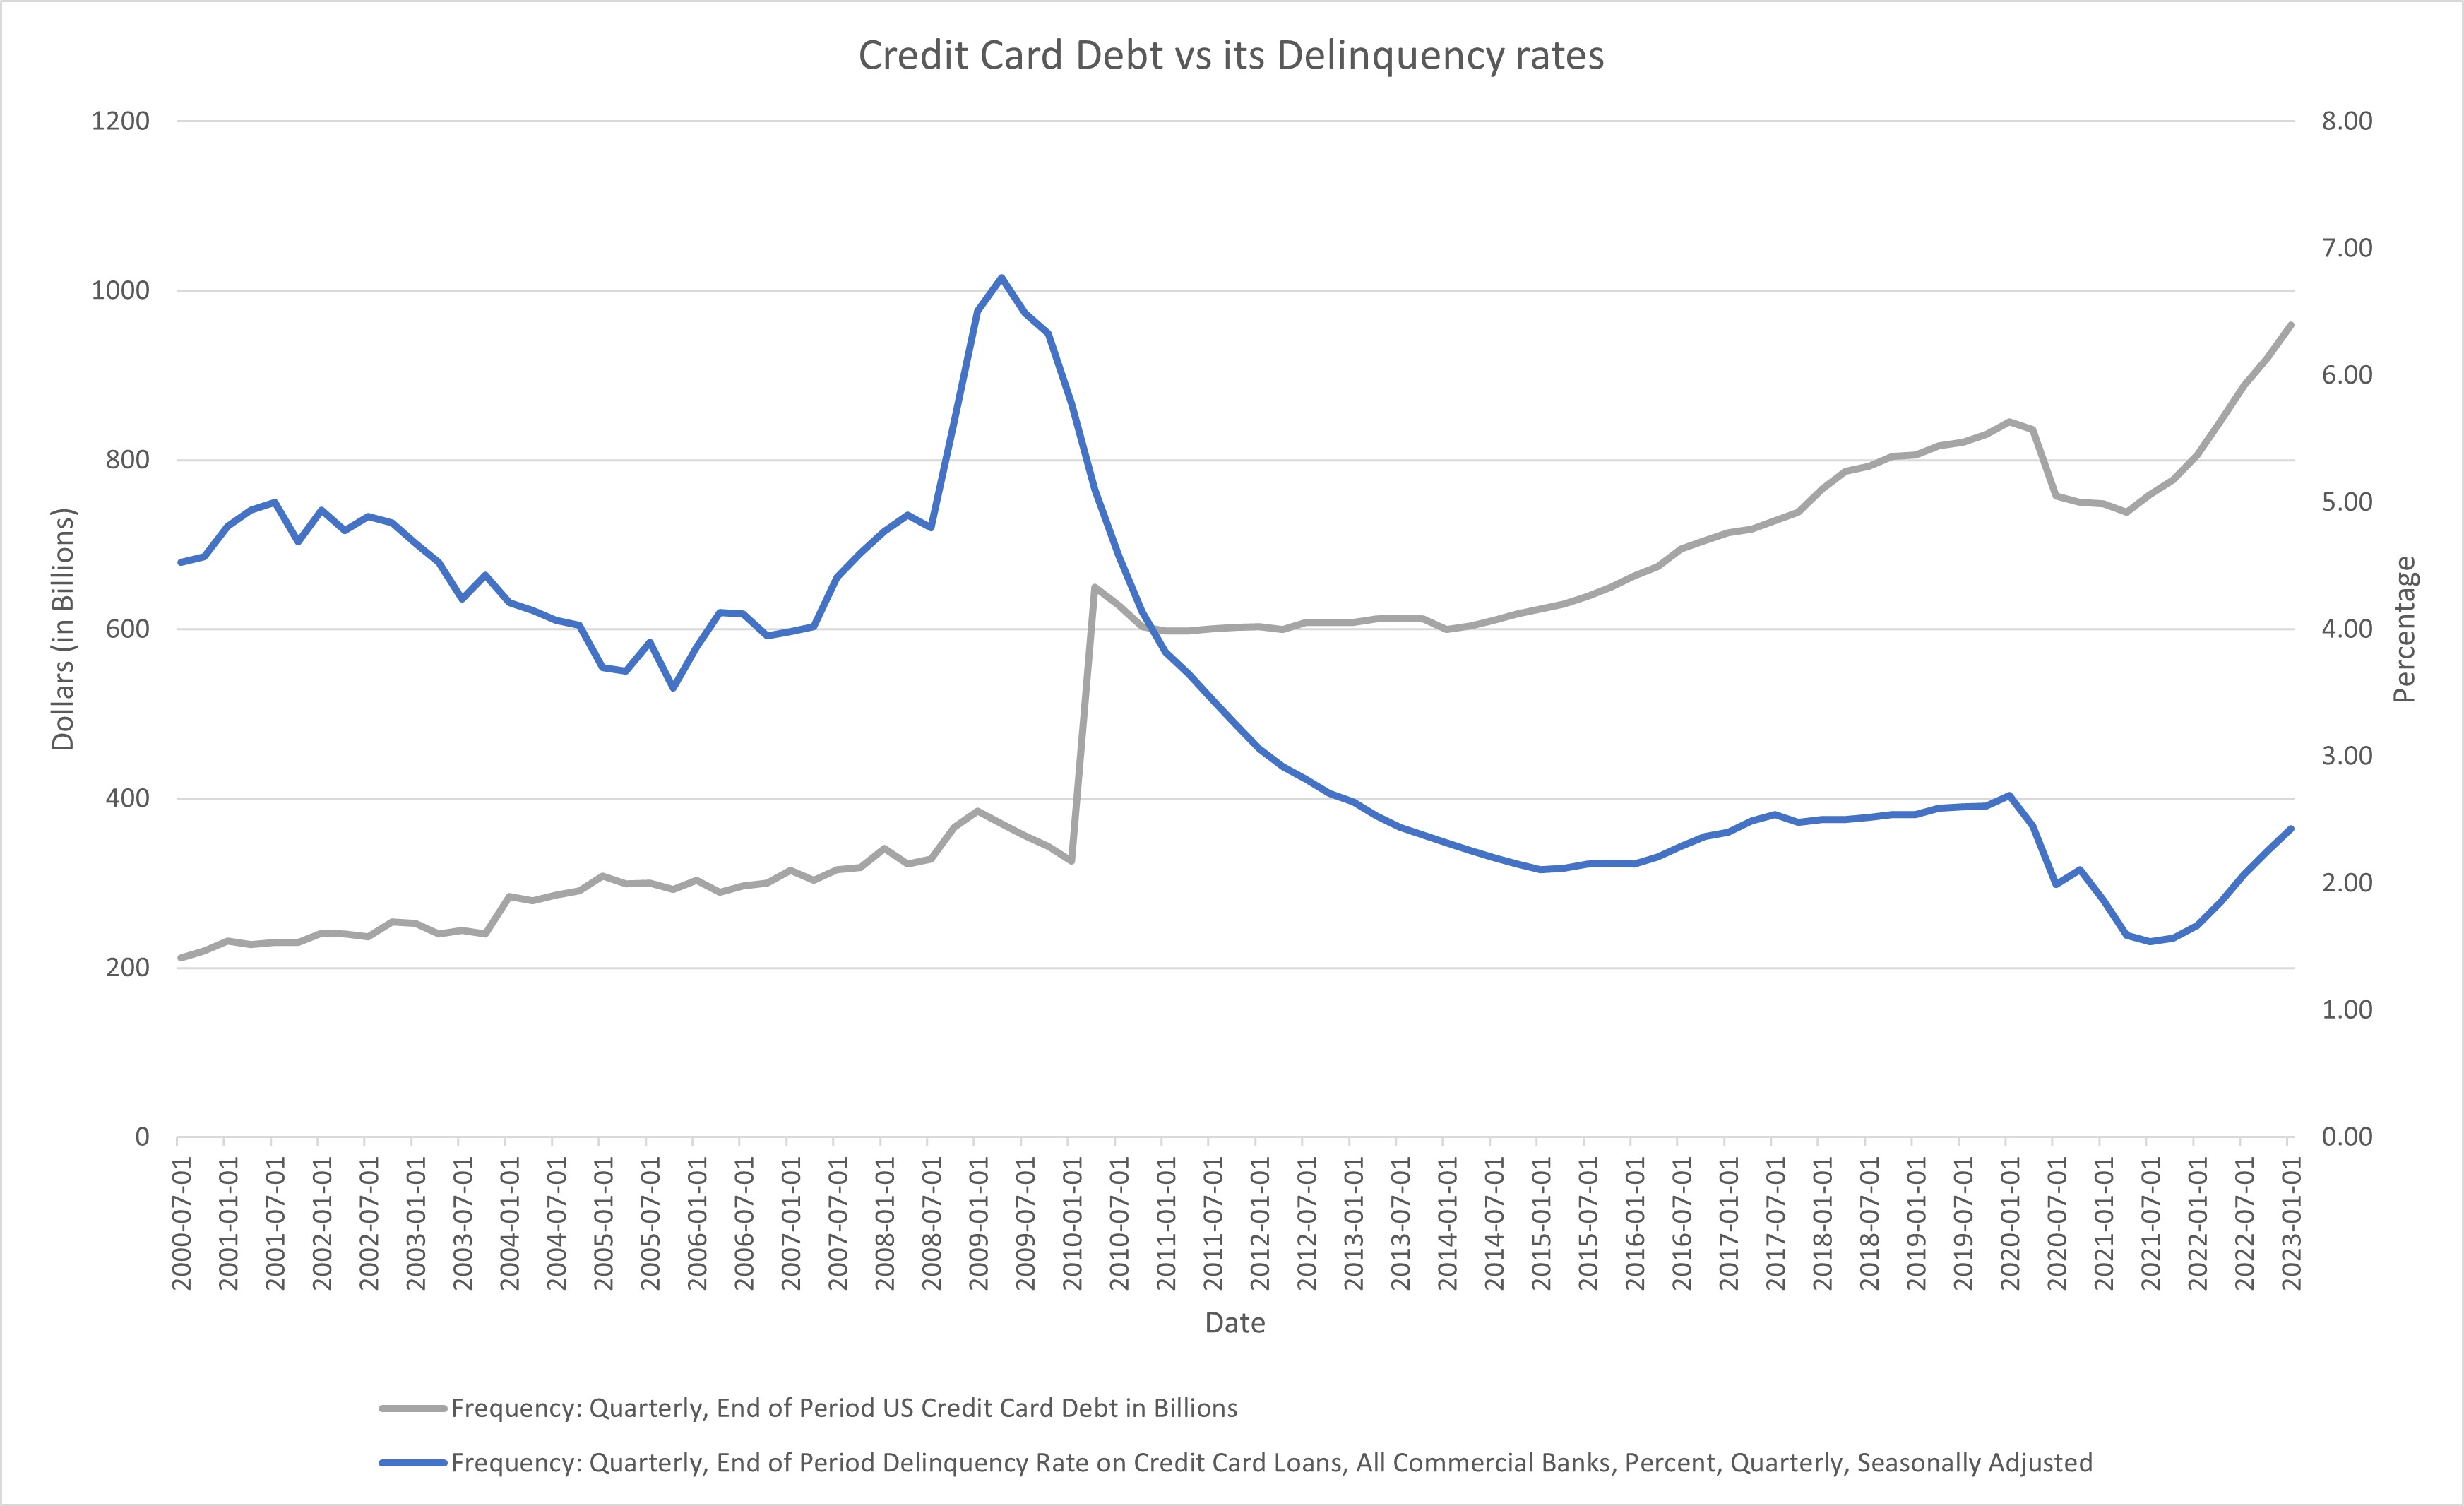
Credit ratings downgrade of the US was mainly due to potential defaults on current governmental and individual debt levels amid economic uncertainty and tightened credit conditions. In terms of consumer loans, often refered as the credit card debt, has reached an all time high near $1 trillion, and delinquency rates on those debt has been increasing for the last two years. Upward trends on both data are a reliable leading indicator of an economic recession, as evident on 2000 dot-com crash, 2008 financial crisis and 2020 Covid. These set of data indicate a deteriorating credit conditions which typically contribute to underperformance of SOX and NVIDIA.
Competition
AMD
AMD is the largest direct competitor to Nvidia. It is an American semiconductor company that is mainly specialised in CPUs and is the largest competitor to intel. AMD ventured into the GPU market after acquiring ATI in 2006 and since then it has produced a line of products including gaming GPUs. It is known for its Accelerated processing units (APUs) which fuse both CPUs and GPUs onto a single chip. Additionally its gaming GPUs are known for being more cost effective that a Nvidia GPUs whilst having comparable performance.
The long standing rivalry between AMD and Nvidia is the primary driving force for GPU innovation in the gaming GPU market space.
AMD boasted a revenue of 5.35 billion USD last quarter with yearly revenues of around 20 billion USD with around 25% of AMD's revenue coming from GPU sales.
Moore Threads
Moore Threads is a Chinese technology company specialising in graphics processing unit (GPU) design, established in October 2020 by, Zhang Jianzhong (张建中), the former global vice-president of Nvidia and general manager of Nvidia China. The company claims to be the first Chinese company to introduce a domestic, "fully-featured" GPU solution. Whilst Moore threads seems to still be in the start up stage of development, the company has a large market to sell to and its 1st line of GPUs was shown to be promising by reviewers. Additionally, the firm will be able to exploit the deterioration of US-China trade relations because as of 2023 no established GPU manufacturers are based in China. As a result, the trade embargoes placed by the US government on US chip manufacturers selling to China has a left a shortfall of supply and in an market with a high demand for GPUs. Therefore, it will only be a matter of time before a Chinese GPU manufacturer rises.
Although the firm is currently still in its start-up phase and does not have published financials, it has raised over 531 million USD in funding from private investors including institutions such as Tencent and ByteDance (creator of Tiktok).
Innosilicon
Innosilicon is another Chinese GPU manufacturer. It unveiled its 1st line-up of the fantasy one series GPUs in 2021 which were fully domestically produced in China. Like Moore threads it is still in the start-up stage of it life-cycle so time will need to be given to see if Innosilicon will be a competitor to Nvidia.
Intel
Like AMD, Intel is better known for its CPUs, but its graphics cards have also gained popularity in the low end performance requirement market. Intel is known for integrated HD/UHD GPUs embedded with the CPUs on a single chip. Intel’s graphics have not been the go-to option for gaming in the past, but things have changed after the release of Intel Xe. This recent release of Intel graphics have finally been recognised as somewhat gaming ready by reviews. Therefore, whilst it is not a direct competitor to Nvidia, it may compete with Nvidia in the integrated CPU-GPU markets.
Intel is getting more ambitious with the release its own discrete high performance GPUs ,the ARC series.
It will take some time before Intel can get a foothold in the gaming and high-computing GPU market, but joining in the competition could prove vexing for Nvidia down the road.
Apple
Apple is also considering a boost to its GPU chips to match Nvidia’s high computing graphics cards. Apple’s power-efficient M1 Pro and M1 Max chips are behind the impressive graphics of MacBook Pro 14 and 16.
It seems that the two chips are just a start for Apple’s venture in gaming GPU. Recently, the company released M1 Ultra, which has massive improvements over the previous chips and is available in the new Mac Studio. As Apple claims, M1 Ultra has two M1 chips with 64 GPU cores, “faster performance than even the highest-end PC GPU available while using 200 fewer watts of power”. This claim compares M1 Ultra with Nvidia’s RTX 3090, the most powerful GPU before the release of RTX 3090 Ti.
However, currently Apple's GPUs appear to be integrated into Apple product only (for now) therefore Apple is not currently a direct competitor to Nvidia's discrete GPU focus.
Financials
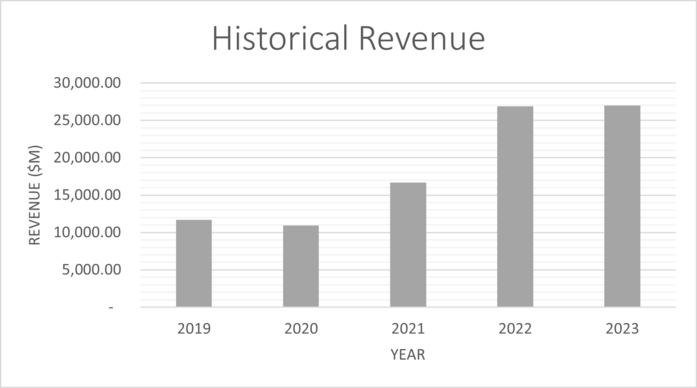
The table below shows historical revenue for Nvidia from 2019 to 2023. Nvidia presents it's financial statements on the 31st of January of every year, in contrast to most other companies that report results on the 31st of December.
| Units ($m) | 2019 | 2020 | 2021 | 2022 | 2023 |
| Total Revenue | 11,716.00 | 10,918.00 | 16,675.00 | 26,914.00 | 26,974.00 |
| Cost of revenue | - 4,545.00 | - 4,150.00 | - 6,279.00 | - 9,439.00 | - 11,618.00 |
| SG&A expenses | - 991.00 | - 1,093.00 | - 1,940.00 | - 2,166.00 | - 2,440.00 |
| R&D Expenses | - 2,376.00 | - 2,829.00 | - 3,924.00 | - 5,268.00 | - 7,339.00 |
| EBIT | 3,804.00 | 2,846.00 | 4,532.00 | 10,041.00 | 5,577.00 |
| Depreciation | 262.00 | 381.00 | 1,098.00 | 1,174.00 | 1,544.00 |
| CapEx | - 600.00 | - 489.00 | - 1,128.00 | - 976.00 | - 1,833.00 |
| Current Assets | 10,557.00 | 13,690.00 | 16,055.00 | 28,829.00 | 23,073.00 |
| Cash | 782.00 | 10,896.00 | 847.00 | 1,990.00 | 3,389.00 |
| Current Liabilities | 1,329.00 | 1,784.00 | 3,925.00 | 4,335.00 | 6,563.00 |
| NCWC | 8,446.00 | 1,010.00 | 11,283.00 | 22,504.00 | 13,121.00 |
| NCWC (inc/dec) | \ | 7,436.00 | - 10,273.00 | - 11,221.00 | 9,383.00 |
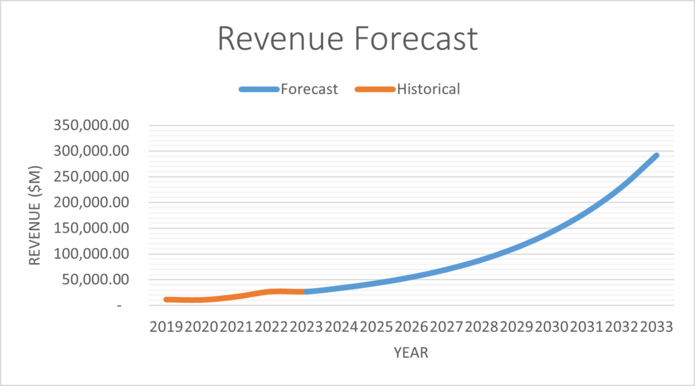
Revenue has been increasing at an average rate of 27% per year for the last five years, this percentage is used to forecast future revenue growth per year for the DCF valuation carried out below. SG&A stands for selling, general and admin, and R&D is research and development. NCWC is non-cash working capital, this is used in the calculation of free cash flows.
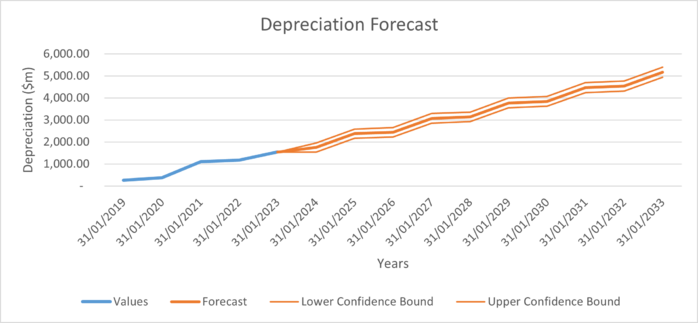
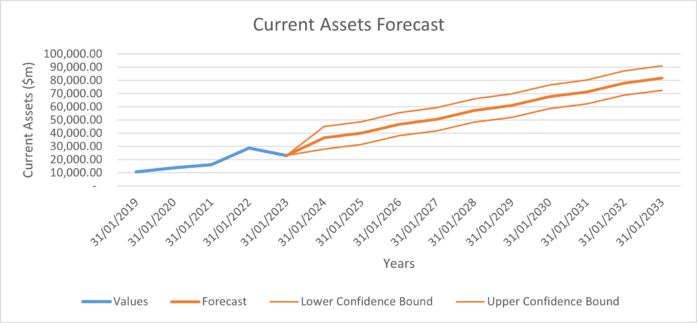
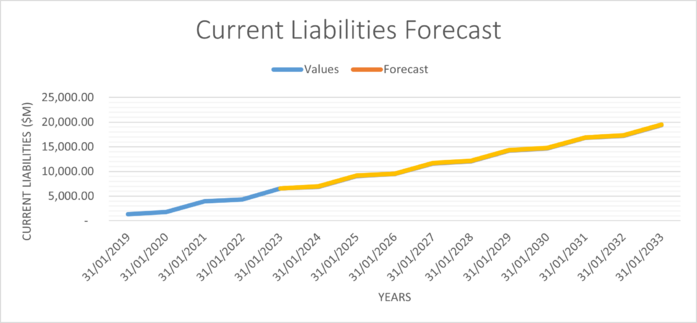
The table below shows the assumptions used to forecast the financials for the next 10 years, used for performing the DCF valuation. Graphs further down show forecasts used for any variables that are not listed in the table.
| Financial Variable | Value Forecasted | Notes |
| Revenue Growth Per Year | 26.89% | Average applied going forward |
| Cost of Revenue | 38.52% | Average applied going forward |
| SG&A Expenses | 9.44% | Average applied going forward |
| R&D Expenses | 23% | Average applied going forward |
| CapEX | 5% | Average applied going forward |
| Cash Growth per Year | 1.50% | 1.5% increase is added on to the percentage used for the previous year |
| Depreciation, Assets and Liabilities are forecast using the excel forecast function | ||
The following table shows the forecasted financials for Nvidia for the next 10 years.
| Units ($m) | 2024 | 2025 | 2026 | 2027 | 2028 | 2029 | 2030 | 2031 | 2032 | 2033 |
| Total Revenue | 34,227.31 | 43,431.03 | 55,109.64 | 69,928.62 | 88,732.42 | 112,592.57 | 142,868.71 | 181,286.11 | 230,033.95 | 291,890.07 |
| Cost of revenue | -13,184.43 | -16,729.72 | -21,228.34 | -26,936.64 | -34,179.90 | -43,370.88 | -55,033.31 | -69,831.76 | -88,609.52 | -112,436.62 |
| SG&A expenses | -3,230.87 | -4,099.65 | -5,202.05 | -6,600.88 | -8,375.86 | -10,628.13 | -13,486.03 | -17,112.43 | -21,713.96 | -27,552.84 |
| R&D Expenses | -7,975.28 | -10,119.84 | -12,841.06 | -16,294.02 | -20,675.48 | -26,235.12 | -33,289.74 | -42,241.36 | -53,600.06 | -68,013.11 |
| EBIT | 9,836.73 | 12,481.82 | 15,838.19 | 20,097.07 | 25,501.18 | 32,358.44 | 41,059.63 | 52,100.56 | 66,110.40 | 83,887.49 |
| Depreciation | 1,746.14 | 2,374.92 | 2,444.09 | 3,072.87 | 3,142.03 | 3,770.81 | 3,839.98 | 4,468.76 | 4,537.93 | 5,166.71 |
| CapEx | -1,833.66 | -2,326.73 | -2,952.38 | -3,746.28 | -4,753.65 | -6,031.91 | -7,653.89 | -9,712.03 | -12,323.59 | -15,637.40 |
| Current Assets | 36,407.25 | 40,106.78 | 46,815.86 | 50,515.40 | 57,224.48 | 60,924.01 | 67,633.09 | 71,332.63 | 78,041.71 | 81,741.25 |
| Cash | 4,813.71 | 6,759.58 | 9,403.88 | 12,981.51 | 17,803.23 | 24,279.41 | 32,951.17 | 44,531.03 | 59,955.93 | 80,456.44 |
| Current Liabilities | 6,945.85 | 9,100.97 | 9,533.81 | 11,688.94 | 12,121.77 | 14,276.90 | 14,709.73 | 16,864.86 | 17,297.69 | 19,452.82 |
| NCWC | 24,647.69 | 24,246.22 | 27,878.18 | 25,844.95 | 27,299.48 | 22,367.71 | 19,972.20 | 9,936.74 | 788.09 | -18,168.01 |
| NCWC (inc/dec) | -11,526.69 | 401.47 | -3,631.95 | 2,033.23 | -1,454.54 | 4,931.77 | 2,395.51 | 10,035.46 | 9,148.65 | 18,956.10 |
| FCF | -3,843.19 | 10,310.30 | 8,371.92 | 17,236.50 | 17,079.77 | 28,233.84 | 31,018.71 | 45,951.64 | 53,590.21 | 74,756.52 |
| Discount Factor | 0.9356 | 0.8208 | 0.7201 | 0.6317 | 0.5542 | 0.4862 | 0.4265 | 0.3742 | 0.3283 | 0.2880 |
| Present Value of FCF | -3,595.75 | 8,462.74 | 6,028.47 | 10,888.65 | 9,465.63 | 13,727.13 | 13,230.49 | 17,194.74 | 17,592.30 | 21,529.24 |
The following are graphs illustrating the assumptions calculated above.
Risks
Nvidia is one of the largest semiconductor companies in the world, ranking 1st in market cap and 9th in terms of revenue (Q1 2023) and is currently one of the most hyped investments.[9] Nvidia's stock has tripled in six months and this is mostly due to high hopes for its role in the artificial intelligence revolution. However, as with all investments, NVIDIA carries a certain level of risk.
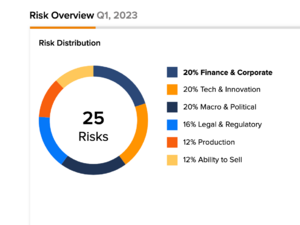
According to TipRanks' Risk Factors tool, Nvidia's primary areas of risk are Finance & Corporate, Technology & Innovation, and Macro & Political factors, each contributing 20% to the overall 25 risks identified for the stock, for Q1, 2023.[10]
Finance and Corporate
Nvidia's valuation is exceptionally high, while companies like AMD, Microsoft, Alphabet, and Apple, known for their innovation, have notably lower valuations. Consequently, Nvidia's present valuation significantly surpasses its earnings in contrast to these industry peers. The company is experiencing rapid growth, particularly due to the expanding use of artificial intelligence (AI), although uncertainties remain regarding its future profit growth and market outlook.
Another crucial consideration regarding Nvidia's investment potential relates to its dividend approach. Nvidia allocates a minor portion of its profits as dividends to shareholders, a markedly lower proportion compared to other firms within the S&P 500 stock index. Moreover, Nvidia does not engage extensively in stock buybacks, a practice aimed at boosting share value, opting instead to reinvest funds into the business, primarily for research and development efforts to create improved and advanced products.
Technology and Innovation
The semiconductor sector, which constitutes the primary field of Nvidia's operations, is a fiercely competitive domain driven by rapid technological advancement. Success in this sector hinges on the ability to swiftly adapt to changes.
Interestingly, many of Nvidia's rivals also happen to be its current clients. These include well-known companies like Microsoft, Apple, and Tesla. Additionally, there's a growing concern that the tech industry's focus on AI might lead to the emergence of more affordable and specialised alternatives. This could potentially weaken the appeal of Nvidia's premium offerings.
Nvidia encounters a notable challenge from emerging local chip manufacturers such as Amazon's AWS, Microsoft, and Alphabet. These companies are exploring AI chip development, adding to the competitive landscape. Although the AI market is expanding overall, this heightened competition could potentially affect Nvidia's established dominance in the industry.
Macroeconomic and Political Factors
The amalgamation of increasing interest rates, elevated inflation, and geopolitical uncertainties has the potential to influence both NVIDIA's revenue and the earnings of its manufacturing partners.
Furthermore, the introduction of new regulations on export restrictions could present a notable danger to Nvidia and its shareholders. These regulations might necessitate licenses for chips related to artificial intelligence (AI), resulting in negative effects on Nvidia's financial performance as outlined in its official 10-K submission. Should the U.S. government impose export controls on AI chips, it could impede the growth of the AI sector, potentially leading to decreased risk-taking across the entire U.S. technology landscape. Consequently, investment funds might decrease their exposure and engage in profit-taking, ultimately impacting both Nvidia and the broader technology sector.
Valuations
DCF and WACC
The following table shows the values used to calculate the WACC for NVIDIA, which was found to be 14%. Units are in USD millions. The share price used in the table was the share price at market close on 28/07/2023.
| Risk Free Rate of Return | 4.2%[11] |
| Beta | 1.75[12] |
| Market Rate of Return | 9.8%[13] |
| Cost of Equity | 14.1% |
| Credit Spread | 1.23%[14] |
| Cost of Debt | 4.3% |
| Shares Outstanding | 2,470.00[12] |
| Share Price | 467.50[12] |
| Equity | 1,154,725.00 |
| Total Debt | 11,000.00[8] |
| Weighted Average Maturity | 10.99 |
| Interest Expense | 262.00[8] |
| Debt | 9,224.86 |
| E/D+E | 99.2% |
| D/D+E | 0.8% |
| WACC | 14.0% |
The following table shows the DCF valuation result.
| Terminal Value | 721,064.28 |
| Present Value of Terminal Value | 207,660.36 |
| Enterprise Value | 322,184.00 |
| Equity Value | 326,504.00 |
| Share Price | $132.19 |
The DCF calculation shows that as of 28/07/2023, Nvidia is overvalued. The stock is significantly overpriced compared to the intrinsic value of the company. This could indicate that in the future, the stock price may decline. The beta for Nvidia is also extremely high, meaning that the stock is very volatile compared to the S&P 500. This is a stock that can have very large short term fluctuations in share price, as we have seen over the previous few months in 2023. The effective tax rate used in the calculations was set at 21%, and the terminal growth rate was set at 3.3%, equal to the annualised average GDP growth rate.
The following is a sensitivity analysis showing implied share price values in different growth rate and WACC environments.
| $132.19 | WACC | |||||||||
| Growth Rate | 12.0% | 12.5% | 13.0% | 13.5% | 14.0% | 14.5% | 15.0% | 15.5% | 16.0% | |
| 2.0% | $158.93 | $148.25 | $138.65 | $129.97 | $122.09 | $114.93 | $108.38 | $102.39 | $96.88 | |
| 2.5% | $165.00 | $153.54 | $143.28 | $134.04 | $125.69 | $118.11 | $111.22 | $104.92 | $99.15 | |
| 3.0% | $171.75 | $159.39 | $148.37 | $138.50 | $129.61 | $121.58 | $114.29 | $107.65 | $101.59 | |
| 3.5% | $179.29 | $165.89 | $154.00 | $143.41 | $133.91 | $125.36 | $117.63 | $110.61 | $104.22 | |
| 4.0% | $187.78 | $173.15 | $160.26 | $148.83 | $138.64 | $129.50 | $121.27 | $113.83 | $107.08 | |
| 4.5% | $197.39 | $181.32 | $167.25 | $154.86 | $143.86 | $134.05 | $125.26 | $117.34 | $110.18 | |
| 5.0% | $208.38 | $190.58 | $175.12 | $161.59 | $149.67 | $139.09 | $129.65 | $121.19 | $113.56 | |
Relative Valuation
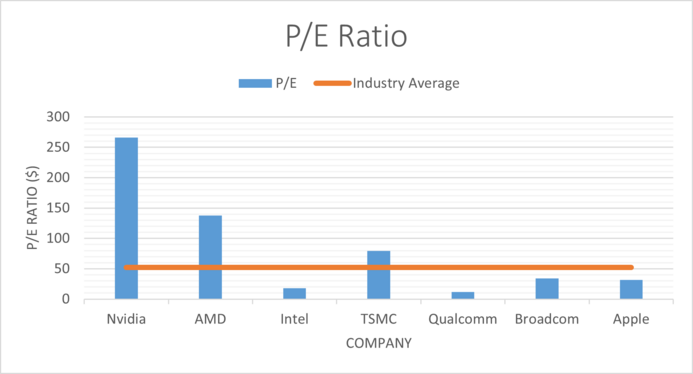
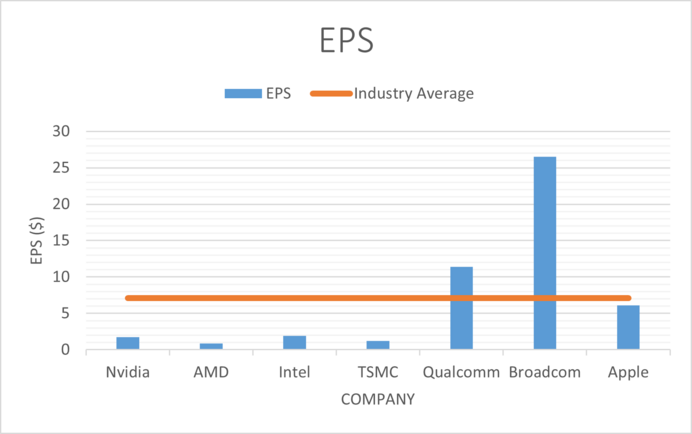
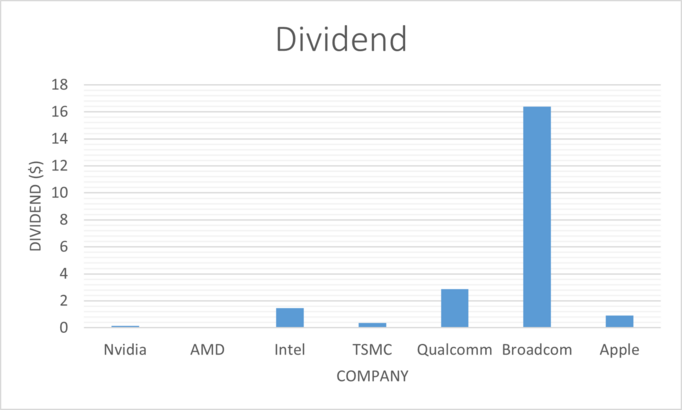
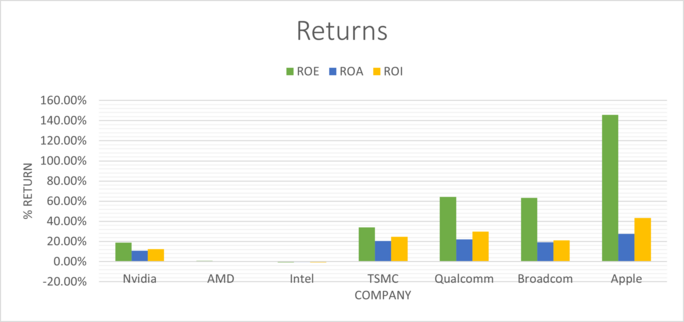
The following table shows a comparison of NVIDIA to it's competitors in the computing hardware and semiconductor manufacturing industries. All ratios are calculated based on a 5 year annualised average.
| Company | P/E | EPS | Dividend | Dividend Yield | Dividend Growth | ROE | ROA | ROI |
| Nvidia | x266.26 | $1.74 | $0.16 | 0.18% | 2.34% | 18.86% | 10.69% | 12.47% |
| AMD | x137.89 | $0.84 | 0 | 0 | 0 | 0.72% | 0.57% | 0.63% |
| Intel | x18.27 | $1.94 | $1.46 | 3.14% | 6.26% | -0.91% | -0.53% | -0.63% |
| TSMC | x79.5 | $1.24 | $0.35 | 71.11% | 6.58% | 33.97% | 20.34% | 24.73% |
| Qualcomm | x11.49 | $11.42 | $2.86 | 2.64% | 5.39% | 64.36% | 22.14% | 29.78% |
| Broadcom | x34.23 | $26.53 | $16.4 | 3.33% | 32.08% | 63.14% | 19.09% | 21.23% |
| Apple | x31.67 | $6.11 | $0.9 | 0.89% | 8.45% | 145.61% | 27.63% | 43.34% |
The price to earning ratio for Nvidia is at x266, indicating that the stock is hugely overvalued. When compared to the industry average of x52, we can see that the stock is overpriced.
Earnings per share for Nvidia are $1.74, below the industry average of $7, this indicates that the company is not as profitable as some of it's peers. Taking into account both P/E and EPS gives us strong evidence that Nvidia stock is overvalued.
The dividend paid out by Nvidia over the previous 5 years, as well as the dividend yield is significantly below all of it's competitors. The dividend growth also lacks behind it's industry peers. This indicates that the income prospects for this stock are not as good as some of it's competitors, who are also undervalued. Note AMD does not pay out a dividend.
The returns on Equity, Assets and Investment for Nvidia are lower than all of it's competitors, indicating that the company is not as efficient at generating profits as others in the same industry.
The relative valuation indicates that Nvidia is overpriced, does not have brilliant income prospects, and is not as efficient at generating profits as some of it's industry competitors, such as Qualcomm, Broadcom and Apple. This could mean that in the future, share price for Nvidia is likely to fall or remain stagnant. However, investor sentiment and the volatility of the stock means that we may not see a translation of the value of the stock to the behaviour of it's share price.
- ↑ https://finance.yahoo.com/quote/NVDA?p=NVDA
- ↑ https://www.nasdaq.com/market-activity/index/sox/historical
- ↑ https://www.wsj.com/market-data/quotes/index/SPX/historical-prices
- ↑ https://www.tradingview.com/symbols/NASDAQ-SOX/components/
- ↑ https://fred.stlouisfed.org/series/T10Y2Y
- ↑ https://mishtalk.com/economics/gross-domestic-income-gdi-suggests-the-us-is-in-recession-right-now/
- ↑ https://www.bbc.com/news/business-66379366
- ↑ 8.0 8.1 8.2 https://investor.nvidia.com/financial-info/annual-reports-and-proxies/default.aspx
- ↑ https://companiesmarketcap.com/semiconductors/largest-semiconductor-companies-by-revenue/
- ↑ https://www.tipranks.com/stocks/nvda/risk-factors
- ↑ https://markets.ft.com/data/bonds/tearsheet/summary?s=US10YT
- ↑ 12.0 12.1 12.2 12.3 https://markets.ft.com/data/equities/tearsheet/summary?s=NVDA:NSQ
- ↑ https://www.officialdata.org/us/stocks/s-p-500/1900?amount=100&endYear=2023
- ↑ https://cbonds.com/news/2353618/#:~:text=S%26P%20Global%20Ratings%20upgraded%20to,NVIDIA%20on%20June%205%2C%202023.
