Adobe Inc.
Summary edit edit source
Adobe Inc. operates as a diversified software company worldwide. It operates through three segments: Digital Media, Digital Experience, and Publishing and Advertising. The Digital Media segment offers products, services, and solutions that enable individuals, teams, and enterprises to create, publish, and promote content; and Document Cloud, a unified cloud-based document services platform. Its flagship product is Creative Cloud, a subscription service that allows members to access its creative products. This segment serves content creators, workers, marketers, educators, enthusiasts, communicators, and consumers. The Digital Experience segment provides an integrated platform and set of applications and services that enable brands and businesses to create, manage, execute, measure, monetize, and optimize customer experiences from analytics to commerce. This segment serves marketers, advertisers, agencies, publishers, merchandisers, merchants, web analysts, data scientists, developers, and executives across the C-suite. The Publishing and Advertising segment offers products and services, such as e-learning solutions, technical document publishing, web conferencing, document and forms platform, web application development, and high-end printing, as well as Advertising Cloud offerings. The company offers its products and services directly to enterprise customers through its sales force and local field offices, as well as to end users through app stores and through its website at adobe.com. It also distributes products and services through a network of distributors, value-added resellers, systems integrators, software vendors and developers, retailers, and original equipment manufacturers. The company was formerly known as Adobe Systems Incorporated and changed its name to Adobe Inc. in October 2018. Adobe Inc. was founded in 1982 and is headquartered in San Jose, California.
Mission edit edit source
“Changing the world through digital experiences.” [1]
Adobe’s statement reflects how it wants to inspire, transform and move the world forward through technology. Adobe will continue to simplify and ease the life of people using concise and productive applications.
Vision edit edit source
Adobe in the future wants to be the leading provider of digital media and marketing solutions, giving people tools to powerful cutting edge technology which will enable them to create and deliver engaging content.
Main Offerings edit edit source
Adobe offers a multitude of products including: [2]
- Acrobat Pro
- Photoshop
- Premiere Pro
- Illustrator
- Adobe Stock
- After Effects
- Animate

Breakdown of Segments edit edit source
Adobe's business is divided into three main segments: Digital Media, Digital Experience, and Publishing and Advertising. The company's focus is on two growth opportunities:
Digital Media: edit edit source
- Opportunity: In today's digital world, creativity and content are crucial. Adobe sees a significant market in providing tools and services for people to create and share content on various platforms.
- Strategy: Adobe's flagship product in this segment is Adobe Creative Cloud, a subscription service that offers creative tools integrated with cloud services. The company aims to democratise creativity and enhance collaboration. They provide tools for content creation, photo editing, design, video production, and more.
- Innovation: Adobe is continuously innovating, focusing on expanding content creation across devices, improving collaboration, and empowering the creative community. They're also advancing 3D and immersive content creation.
Digital Experience: edit edit source
- Opportunity: Businesses are undergoing digital transformation, seeking to provide personalised and engaging experiences to customers across various platforms.
- Strategy: Adobe Experience Cloud offers solutions for managing customer journeys, personalisation, marketing workflows, and content and commerce. The goal is to help businesses transform digitally and deliver exceptional experiences to their customers.
- AI and Innovation: Adobe Sensei, their AI and machine learning technology, enhances digital experiences by providing insights and automating processes. Adobe is also building an open ecosystem through the Adobe Experience Platform.
Publishing and Advertising: edit edit source
- Legacy Products: This segment includes legacy products like eLearning solutions, technical document publishing, web conferencing, web application development, high-end printing, and Adobe Advertising Cloud for managing digital advertising.
- Market Position: Adobe provides technologies like Adobe PostScript and Adobe PDF for high-quality printing and advanced printing workflows. Adobe Advertising Cloud simplifies digital advertising management across different channels.
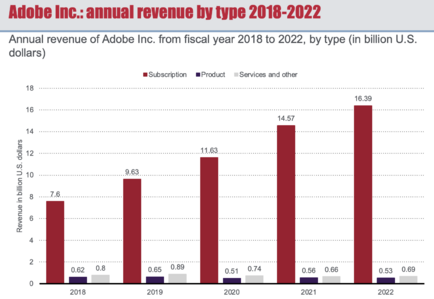
Breakdown of Sector Revenues edit edit source
Subscription Revenue edit edit source
- Subscription revenue includes fees for services like Creative Cloud and Adobe Experience Cloud.
- Revenue is recognised over the term of agreements, with some usage-based exceptions.
Product Revenue edit edit source
- Product revenue includes software licenses purchased on a perpetual basis or for fixed periods.
- Revenue is recognised when the software is available to the customer.
Services and other Revenue edit edit source
- This includes fees for consulting, training, maintenance, support, and advertising offerings.
- Consulting and training revenues are recognised as services are performed.
- Maintenance and support revenues are recognised notably over the arrangement's term.
- Transaction-based advertising revenue is recognised based on usage.
Segment Categorisation edit edit source
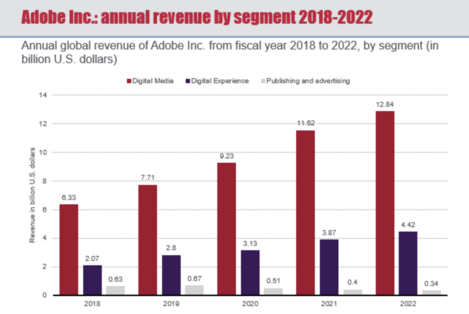
Adobe's reported segments include:
- Digital Media: Products for content creation, publishing, and promotion.
- Digital Experience: Integrated platform for customer experiences from analytics to commerce.
- Publishing and Advertising: Legacy products, eLearning, technical publishing, web development, and Adobe Advertising Cloud.
1. Digital Media Segment edit edit source
- Revenue increased by $1.32 billion in fiscal 2022 due to demand for Creative and Document Cloud subscription offerings, customer acquisition, and engagement.
- Foreign currency exchange rate fluctuations partially offset the growth.
2. Digital Experience Segment edit edit source
- Revenue increased by $555 million in fiscal 2022 primarily due to net new additions in subscription offerings.
- Impact of foreign currency exchange rate fluctuations partially affected the growth.
Geographical Categorisation edit edit source
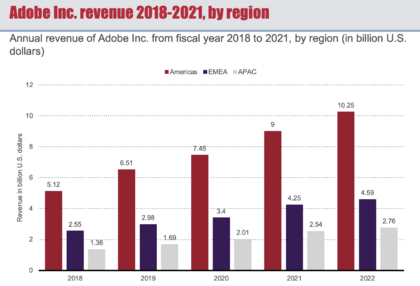
Revenue increased in all geographic regions in fiscal 2022, driven by Digital Media and, to a lesser extent, Digital Experience. Fluctuations in revenue by segment were influenced by regional factors. Foreign currency impacts were partially mitigated by a hedging program. The U.S. Dollar strengthened against EMEA and APAC currencies, affecting revenue in U.S. Dollar equivalents.
Competitors edit edit source
Adobe offers a range of services, and therefore has a number of competitors for its services.
Creative software
For photoshop, some of the main competing softwares are GIMP, a free alternative, Affinity Photo, and Canva, which offers similar services with competitive prices.
Digital Marketing and Analytics
The main competitors are Salesforce, Oracle, Hubspot, and the Google marketing platform. All provide marketing related services such as market automation, customer relationship management, digital marketing, analytics and advertising.
Video and multimedia
For Adobe Premiere, main competitors are Final cut pro and Vegas pro in the video editing space, which may be faster than the Premiere Pro as it is easier to do light editing, but harder to edit non-traditional timelines as it is non-customisable
Web design
Sketch, Figma, Axure RP are all tools that compete with Adobe for this service, providing design tools for prototyping, user testing, and real time collaborations during web and experience designing.
edit edit source
In the application development field, Adobe has 60.80% with the Creative cloud, significantly higher than the second highest which is Microsoft Azure with 15%
To break this down further, Premiere Pro has possessed 23.3% of the video editing market, which is the highest, though Apple’s Final Cut Pro is very close in market shares (22.86%)
Adobe document cloud has 0.35% in market share in the data management technologies, dwarfed by the likes of G suite (68%) and office 365 (7%).
Financials edit edit source
- Total Digital Media ARR (Annualized Recurring Revenue): ARR reached approximately $13.97 billion by December 2, 2022, marking a 15% increase from $12.15 billion by December 3, 2021. This growth resulted from higher adoption of Creative Cloud and Document Cloud offerings. However, there was an $87 million ARR reduction in response to the Russia-Ukraine conflict.
- Creative Revenue: Creative revenue for fiscal 2022 amounted to $10.46 billion, showing a 10% rise from $9.55 billion in fiscal 2021. This increase was driven by subscription revenue growth associated with Creative Cloud offerings.
- Document Cloud Revenue: Document Cloud revenue for fiscal 2022 stood at $2.38 billion, a 21% increase from $1.97 billion in fiscal 2021. Subscription revenue growth related to Document Cloud offerings contributed to this rise.
- Digital Experience Revenue: Fiscal 2022 saw Digital Experience revenue amounting to $4.42 billion, marking a 14% increase from $3.87 billion in fiscal 2021. This growth was primarily due to higher subscription revenue across the Digital Experience offerings.
- Remaining Performance Obligations: Remaining performance obligations reached $15.19 billion by December 2, 2022, up by 9% from $13.99 billion by December 3, 2021. This increase was driven by new contracts and renewals for Digital Media and Digital Experience offerings. However, foreign currency exchange rate fluctuations partially offset this growth.
- Cost of Revenue: Cost of revenue amounted to $2.17 billion for fiscal 2022, showing a 16% increase from $1.87 billion in fiscal 2021. This increase was primarily due to higher costs related to hosting services, data centers, and base and incentive compensation.
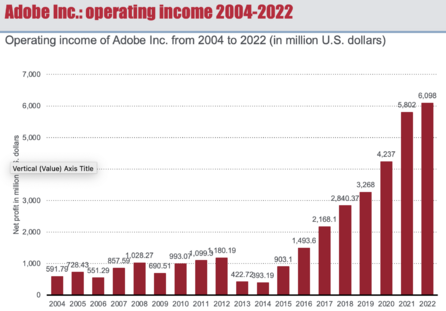
- Operating Expenses: Operating expenses reached $9.34 billion for fiscal 2022, reflecting a 15% increase from $8.12 billion in fiscal 2021. The rise in operating expenses was driven by increased base and incentive compensation costs, as well as higher marketing spend.
Other Financial Performance Indicators edit edit source
edit edit source
- Competition: Adobe faces competition from a number of other companies that offer similar products and services. These competitors include Microsoft, Google, and Salesforce. Adobe's competitors are constantly innovating and expanding their product offerings, which could put pressure on Adobe's pricing and market share. For example, Microsoft has been investing heavily in its Office 365 subscription service, which competes with Adobe's Creative Cloud subscription service. Google has also been investing in its cloud-based productivity suite, Google Workspace, which competes with Adobe's Document Cloud.
- Dependence on Creative Cloud: Adobe's Creative Cloud is a key driver of its growth, and any decline in demand for Creative Cloud products could negatively impact Adobe's financial performance.
- New market entrants: Adobe is also at risk of new market entrants, particularly in the cloud-based software market. These new entrants could disrupt Adobe's business by offering lower prices or more innovative products and services. For example, a number of startups have emerged in recent years that offer cloud-based photo editing and graphic design tools. These startups could pose a threat to Adobe's Creative Cloud business.
- Regulatory changes: Adobe is subject to a variety of regulations, both domestic and international. Changes in these regulations could impact Adobe's business in a number of ways, including increasing its costs or restricting its ability to operate in certain markets. For example, the European Union's General Data Protection Regulation (GDPR) has imposed new requirements on companies that collect and process personal data. Adobe has had to invest heavily in order to comply with the GDPR, which has increased its costs.
- Exchange rate fluctuations: Adobe generates a significant portion of its revenue from international sales. Fluctuations in exchange rates could impact Adobe's bottom line. For example, if the US dollar strengthens against other currencies, Adobe's revenue from international sales could decrease in terms of US dollars.
- Economic downturn: A prolonged economic downturn could lead to decreased demand for Adobe's products and services, which could impact its revenue and profitability. For example, the global financial crisis of 2008-2009 led to a decline in demand for Adobe's products and services, which resulted in a decrease in its revenue and profitability.
edit edit source
- Cybersecurity risks: Adobe is a major provider of cloud-based services, which makes it a target for cyberattacks. A successful cyberattack could result in the loss of customer data, financial losses, and damage to Adobe's reputation. For example, in 2013, Adobe was the victim of a cyberattack that resulted in the theft of customer data. This cyberattack had a significant impact on Adobe's reputation and its business.
- Data privacy risks: Adobe collects and stores a significant amount of customer data. A data privacy breach could result in fines, lawsuits, and damage to Adobe's reputation. For example, in 2019, Adobe was fined $1.1 million by the French data protection authority for failing to properly protect customer data.
- Product liability risks: Adobe's products could be subject to product liability claims. These claims could result in financial losses and damage to Adobe's reputation. For example, in 2018, Adobe was sued by a customer who claimed that Adobe's software had caused her computer to crash. This lawsuit is still pending.
- Intellectual property risks: Adobe owns a valuable portfolio of intellectual property. Infringement of this intellectual property could result in financial losses and damage to Adobe's reputation. For example, in 2017, Adobe was sued by a company that claimed that Adobe had infringed its patent on a technology used in its Creative Cloud software. This lawsuit was settled out of court.
- Workforce risks: Adobe relies on a talented workforce to develop and deliver its products and services. Fluctuations in the labor market could make it difficult for Adobe to attract and retain top talent. For example, the COVID-19 pandemic has led to an increase in the demand for tech workers, which has made it more difficult for Adobe to attract and retain top talent.
Valuation (DCF) edit edit source
Balance sheet (historic and forecasted)
| Annual As Reported in Millions of U.S. Dollars | ||||||||||
| 2018 | 2019 | 2020 | 2021 | 2022 | 2023 | 2024 | 2025 | 2026 | 2027 | |
| Total cash and cash equivalents | 1,643.00 | 2,650.00 | 4,478.00 | 3,844.00 | 4,236.00 | 11,486.45 | 19,429.99 | 28,124.06 | 37,630.47 | 48,018.48 |
| ST Investments | 1,586.00 | 1,527.00 | 1,514.00 | 1,954.00 | 1,860.00 | 1,934.40 | 2,011.78 | 2,092.25 | 2,175.94 | 2,262.97 |
| Trade receivables | 1,331.00 | 1,544.00 | 1,408.00 | 1,894.00 | 2,088.00 | 2,244.54 | 2,413.92 | 2,597.18 | 2,795.44 | 3,009.94 |
| Doubtful Account | (15.00) | (10.00) | (10.00) | (16.00) | (23.00) | (24.15) | (25.36) | (26.63) | (27.96) | (29.35) |
| Prepaid expenses and other current assets | 268.00 | 690.00 | 675.00 | 993.00 | 835.00 | 860.05 | 885.85 | 912.43 | 939.80 | 967.99 |
| Total current assets | 4,813.00 | 6,401.00 | 8,065.00 | 8,669.00 | 8,996.00 | 16,501.29 | 24,716.18 | 33,699.29 | 43,513.70 | 54,230.03 |
| PPE | 2,525.00 | 2,954.00 | 3,056.00 | 3,124.00 | 3,477.00 | 3,768.69 | 4,079.83 | 4,411.74 | 4,765.82 | 5,140.76 |
| accumulated depreciation and amortizatio | (1,406.00) | (1,569.00) | (1,458.00) | (1,451.00) | (1,569.00) | (1,830.21) | (2,103.85) | (2,390.53) | (2,690.85) | (3,005.49) |
| Operating lease right-of-use assets, net | -- | -- | 487.00 | 443.00 | 407.00 | 415.14 | 423.44 | 431.91 | 440.55 | 449.36 |
| Goodwill | 10,581.00 | 10,691.00 | 10,742.00 | 12,668.00 | 12,787.00 | 13,042.74 | 13,303.59 | 13,569.67 | 13,841.06 | 14,117.88 |
| other intangibles | 2,068.00 | 1,719.00 | 1,359.00 | 1,820.00 | 1,449.00 | 1,492.47 | 1,537.24 | 1,583.36 | 1,630.86 | 1,679.79 |
| Deferred income taxes | -- | -- | 1,370.00 | 1,085.00 | 777.00 | 777.00 | 777.00 | 777.00 | 777.00 | 777.00 |
| other assets | 231.00 | 656.00 | 744.00 | 883.00 | 841.00 | 724.24 | 606.19 | 486.79 | 365.94 | 243.56 |
| Total Assets | 18,812.00 | 20,852.00 | 24,365.00 | 27,241.00 | 27,165.00 | 34,891.36 | 43,339.63 | 52,569.23 | 62,644.07 | 73,632.90 |
| Liabilities ($ Millions) | ||||||||||
| Trade payables | 186.00 | 209.00 | 306.00 | 312.00 | 379.00 | 397.95 | 417.85 | 438.74 | 460.68 | 483.71 |
| Accrued expenses | 1,163.00 | 1,367.00 | 1,418.00 | 1,736.00 | 1,790.00 | 1,879.50 | 1,973.48 | 2,072.15 | 2,175.76 | 2,284.54 |
| Debt | 0.00 | 0.00 | 0.00 | 0.00 | 500.00 | 520.00 | 540.80 | 562.43 | 584.93 | 608.33 |
| Deferred Revenue | 2,916.00 | 3,378.00 | 3,629.00 | 4,733.00 | 5,297.00 | 5,667.79 | 6,064.54 | 6,489.05 | 6,943.29 | 7,429.32 |
| Income taxes payable | 36.00 | 56.00 | 63.00 | 59.00 | 75.00 | 80.25 | 85.87 | 91.88 | 98.31 | 105.19 |
| Operating lease liabilities | 0.00 | 0.00 | 92.00 | 97.00 | 87.00 | 92.22 | 97.75 | 103.62 | 109.84 | 116.43 |
| Total current liabilities | 4,301.00 | 5,010.00 | 5,508.00 | 6,937.00 | 8,128.00 | 8,637.71 | 9,180.28 | 9,757.87 | 10,372.79 | 11,027.51 |
| Long-term liabilities: | ||||||||||
| Debt | 4,115.00 | 4,138.00 | 4,117.00 | 4,123.00 | 3,629.00 | 3,774.16 | 3,925.13 | 4,082.13 | 4,245.42 | 4,415.23 |
| Deferred revenue | 138.00 | 123.00 | 130.00 | 145.00 | 117.00 | 125.19 | 133.95 | 143.33 | 153.36 | 164.10 |
| Income taxes payable | 644.00 | 616.00 | 529.00 | 534.00 | 530.00 | 561.80 | 595.51 | 631.24 | 669.11 | 709.26 |
| Operating lease liabilities | 252.00 | 261.00 | 499.00 | 453.00 | 417.00 | 446.19 | 477.42 | 510.84 | 546.60 | 584.86 |
| Other liabilities | -- | 173.00 | 223.00 | 252.00 | 293.00 | 319.37 | 347.06 | 376.14 | 406.68 | 438.77 |
| Total liabilities | 9,450.00 | 10,321.00 | 11,006.00 | 12,444.00 | 13,114.00 | 13,864.42 | 14,659.35 | 15,501.55 | 16,393.97 | 17,339.74 |
| Stockholders’ equity: | ||||||||||
| Common stock | ||||||||||
| Additional paid-in-capital | 5,685.00 | 6,505.00 | 7,357.00 | 8,428.00 | 9,868.00 | 10,972.46 | 12,107.50 | 13,273.98 | 14,472.79 | 15,704.85 |
| Retained earnings | 11,816.00 | 14,829.00 | 19,706.00 | 23,905.00 | 28,319.00 | 34,451.27 | 41,243.23 | 48,751.30 | 57,036.24 | 66,163.44 |
| Accumulated other comprehensive income (loss) | (148.00) | (188.00) | (158.00) | (137.00) | (293.00) | (301.79) | (310.84) | (320.17) | (329.77) | (339.67) |
| Treasury stock | (7,991.00) | (10,615.00) | (13,546.00) | (17,399.00) | (23,843.00) | (24,095.00) | (24,359.60) | (24,637.43) | (24,929.15) | (25,235.46) |
| Total equity | 9,362.00 | 10,531.00 | 13,359.00 | 14,797.00 | 14,051.00 | 21,026.94 | 28,680.28 | 37,067.68 | 46,250.10 | 56,293.16 |
| Total equity and liabilities | 18,812.00 | 20,852.00 | 24,365.00 | 27,241.00 | 27,165.00 | 34,891.36 | 43,339.63 | 52,569.23 | 62,644.07 | 73,632.90 |
| Check | 0 | 0 | 0 | 0 | 0 | 0 | 0 | 0 | 0 | 0 |
Income statement (historic and forecasted)
| Annual As Reported in Millions of U.S. Dollars | ||||||||||
| 2018 | 2019 | 2020 | 2021 | 2022 | 2023 | 2024 | 2025 | 2026 | 2027 | |
| Revenue: | ||||||||||
| Product | 622.00 | 648.00 | 507.00 | 555.00 | 532.00 | 563.92 | 597.76 | 633.62 | 671.64 | 711.94 |
| Subscription | 7,922.00 | 9,994.00 | 11,626.00 | 14,573.00 | 16,388.00 | 17,535.16 | 18,762.62 | 20,076.00 | 21,481.33 | 22,985.02 |
| Service and Other | 486.00 | 529.00 | 735.00 | 657.00 | 686.00 | 720.30 | 756.32 | 794.13 | 833.84 | 875.53 |
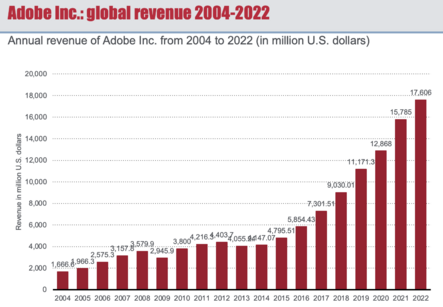
| Total Revenue | 9,030.00 | 11,171.00 | 12,868.00 | 15,785.00 | 17,606.00 | 18,819.38 | 20,116.69 | 21,503.76 | 22,986.80 | 24,572.48 |
| Cost of revenue | ||||||||||
| Subscription | -- | -- | 1,108.00 | 1,374.00 | 1,646.00 | 1,695.38 | 1,746.24 | 1,798.63 | 1,852.59 | 1,908.17 |
| Products | 46.00 | 40.00 | 36.00 | 41.00 | 35.00 | 36.05 | 37.13 | 38.25 | 39.39 | 40.57 |
| Stock-based Compensation & Service and Support | 341.00 | 411.00 | 578.00 | 450.00 | 484.00 | 508.20 | 533.61 | 560.29 | 588.31 | 617.72 |
| Total cost of revenue | 387.00 | 451.00 | 1,722.00 | 1,865.00 | 2,165.00 | 2,239.63 | 2,316.98 | 2,397.16 | 2,480.29 | 2,566.46 |
| Gross profit | 8,643.00 | 10,720.00 | 11,146.00 | 13,920.00 | 15,441.00 | 16,579.75 | 17,799.71 | 19,106.59 | 20,506.51 | 22,006.02 |
| Operating expenses: | ||||||||||
| Research & Development | 1,538.00 | 1,930.00 | 2,188.00 | 2,540.00 | 2,987.00 | 3,136.35 | 3,293.17 | 3,457.83 | 3,630.72 | 3,812.25 |
| Sales and marketing | 2,621.00 | 3,245.00 | 3,591.00 | 4,321.00 | 4,968.00 | 5,141.88 | 5,321.85 | 5,508.11 | 5,700.89 | 5,900.43 |
| General and Administrative | 588.00 | 707.00 | 776.00 | 878.00 | 1,030.00 | 1,060.90 | 1,092.73 | 1,125.51 | 1,159.27 | 1,194.05 |
| Depreciation | 157.00 | 173.00 | 192.00 | 207.00 | 189.00 | 198.45 | 208.37 | 218.79 | 229.73 | 241.22 |
| Amortization of intangibles | 91.00 | 175.00 | 162.00 | 172.00 | 169.00 | 177.45 | 186.32 | 195.64 | 205.42 | 215.69 |
| Total operating expenses | 4,995.00 | 6,230.00 | 6,909.00 | 8,118.00 | 9,343.00 | 9,715.03 | 10,102.44 | 10,505.87 | 10,926.04 | 11,363.64 |
| Operating income | 3,648.00 | 4,490.00 | 4,237.00 | 5,802.00 | 6,098.00 | 6,864.72 | 7,697.27 | 8,600.72 | 9,580.48 | 10,642.38 |
| Interest expense | (99.00) | (157.00) | (116.00) | (113.00) | (113.00) | 113.22 | 117.75 | 122.46 | 127.36 | 132.46 |
| Investment gains (losses), net | 3.00 | 52.00 | 14.00 | 16.00 | (19.00) | (19.95) | (20.95) | (21.99) | (23.09) | (24.25) |
| Other income (expense), net | 50.00 | 42.00 | 41.00 | 0.00 | 42.00 | 44.10 | 46.31 | 48.62 | 51.05 | 53.60 |
| Other items | (810.00) | (1,222.00) | 0.00 | 0.00 | 0.00 | 0.00 | 0.00 | 0.00 | 0.00 | 0.00 |
| Total non-operating income (expense), net | (856.00) | (1,285.00) | (61.00) | (97.00) | (90.00) | (94.50) | (99.23) | (104.19) | (109.40) | (114.87) |
| Net Income Before Taxes | 2,792.00 | 3,205.00 | 4,176.00 | 5,705.00 | 6,008.00 | 6,770.22 | 7,598.05 | 8,496.53 | 9,471.08 | 10,527.52 |
| Tax | 15.00 | 251.00 | (1,084.00) | 883.00 | 1,252.00 | 1,354.04 | 1,519.61 | 1,699.31 | 1,894.22 | 2,105.50 |
| Net Income | 2,591.00 | 2,951.00 | 5,260.00 | 4,822.00 | 4,756.00 | 5,416.18 | 6,078.44 | 6,797.22 | 7,576.87 | 8,422.01 |
| Basic Weighted Average Shares | 491.00 | 486.00 | 481.00 | 477.00 | 470.00 | 493.50 | 518.18 | 544.08 | 571.29 | 599.85 |
| Basic EPS | 5.28 | 6.07 | 10.94 | 10.11 | 10.12 | 10.98 | 11.73 | 12.49 | 13.26 | 14.04 |
| Diluted Weighted Average Shares | 498.00 | 492.00 | 485.00 | 481.00 | 471.00 | 494.55 | 519.28 | 545.24 | 572.50 | 601.13 |
| Diluted EPS | 5.20 | 6.00 | 10.85 | 10.02 | 10.10 | 10.95 | 11.71 | 12.47 | 13.23 | 14.01 |
Cash flow statement (historic and forecasted)
| Annual As Reported in Millions of U.S. Dollars | ||||||||||
| 2018 | 2019 | 2020 | 2021 | 2022 | 2023 | 2024 | 2025 | 2026 | 2027 | |
| Net Income | 2,590.80 | 2,951.50 | 5,260.00 | 4,822.00 | 4,756.00 | 5,416.18 | 6,078.44 | 6,797.22 | 7,576.87 | 8,422.01 |
| Depreciation | 346.50 | 736.70 | 757.00 | 788.00 | 856.00 | 898.45 | 908.37 | 918.79 | 929.73 | 941.22 |
| Reduction of operating lease right-of-use assets | -- | -- | 87.00 | 73.00 | 83.00 | 77.08 | 77.23 | 77.40 | 77.58 | 77.78 |
| Stock-based compensation | 609.60 | 787.70 | 909.00 | 1,069.00 | 1,440.00 | 848.72 | 874.18 | 900.41 | 927.42 | 955.24 |
| Other non-cash items | 7.20 | 13.80 | 40.00 | 7.00 | 10.00 | 10.50 | 11.03 | 11.58 | 12.16 | 12.76 |
| Trade receivables, net | (2.00) | (187.80) | 106.00 | (430.00) | (198.00) | (167.04) | (180.40) | (194.84) | (210.42) | (227.26) |
| Prepaid expenses and other assets | (77.20) | (531.10) | (288.00) | (475.00) | (94.00) | (125.59) | (128.55) | (131.52) | (134.50) | (137.48) |
| Trade payables | 54.90 | 23.10 | 96.00 | (20.00) | 66.00 | 18.95 | 19.90 | 20.89 | 21.94 | 23.03 |
| Accrued Expenses | 43.80 | 171.70 | 86.00 | 162.00 | 7.00 | 89.50 | 93.98 | 98.67 | 103.61 | 108.79 |
| Income taxes payable | 479.20 | 4.20 | (72.00) | 2.00 | 19.00 | 37.05 | 39.33 | 41.74 | 44.31 | 47.03 |
| Deferred revenue | 444.70 | 497.00 | 258.00 | 1,053.00 | 536.00 | 378.98 | 405.51 | 433.89 | 464.27 | 496.77 |
| Cash from Operating Activities | 4,029.40 | 4,421.90 | 5,727.00 | 7,230.00 | 7,838.00 | 7,482.78 | 8,199.00 | 8,974.24 | 9,812.94 | 10,719.90 |
| Cash Flow-Investing Activities ($ Millions) | ||||||||||
| Purchases and sales of long-term invest | (18.50) | (48.70) | (15.00) | (42.00) | (46.00) | (48.30) | (50.72) | (53.25) | (55.91) | (55.91) |
| Purchases of short-term investments | (566.10) | (699.90) | (1,071.00) | (1,533.00) | (909.00) | (954.45) | (1,002.17) | (1,052.28) | (1,104.90) | (1,160.14) |
| Proceeds from sales of short-term invest | 1,709.50 | 86.10 | 167.00 | 191.00 | 270.00 | 283.50 | 297.68 | 312.56 | 328.19 | 344.60 |
| Maturities of short-term investments | 765.90 | 699.50 | 915.00 | 877.00 | 683.00 | 717.15 | 753.01 | 790.66 | 830.19 | 871.70 |
| Purchases of property and equipment | (266.60) | (394.50) | (419.00) | (348.00) | (442.00) | (243.39) | (260.43) | (278.66) | (298.16) | (319.03) |
| Acquisitions, net of cash acquired | (6,314.40) | (100.70) | 0.00 | (2,682.00) | (126.00) | 0.00 | 0.00 | 0.00 | 0.00 | 0.00 |
| Proceeds from sale of long-term investments | 4.90 | 2.60 | 9.00 | 0.00 | 0.00 | 100.00 | 100.00 | 100.00 | 100.00 | 100.00 |
| Cash from Investing Activities | (4,685.30) | (455.60) | (414.00) | (3,537.00) | (570.00) | (145.49) | (162.63) | (180.97) | (200.59) | (218.79) |
| Cash Flow-Financing Activities ($ Millions) | ||||||||||
| Taxes paid related to net share settlements | (393.20) | (440.00) | (681.00) | (719.00) | (518.00) | (543.90) | (571.10) | (599.65) | (629.63) | (661.11) |
| Repurchases of common stock | (2,050.00) | (2,750.00) | (3,050.00) | (3,950.00) | (6,550.00) | 0.00 | 0.00 | 0.00 | 0.00 | 0.00 |
| Proceeds from re-issuance of treasury stock | 191.00 | 232.90 | 270.00 | 291.00 | 278.00 | 291.90 | 306.50 | 321.82 | 337.91 | 354.81 |
| Long Term Debt Issuance | 2,248.30 | 0.00 | 3,144.00 | 0.00 | 0.00 | 165.16 | 171.77 | 178.64 | 185.78 | 193.21 |
| Repayment of debt | (1.70) | -- | (3,150.00) | 0.00 | 0.00 | 0.00 | 0.00 | 0.00 | 0.00 | 0.00 |
| Cash from Financing Activities | (5.60) | (2,946.10) | (3,488.00) | (4,301.00) | (6,825.00) | (86.84) | (92.83) | (99.19) | (105.94) | (113.09) |
| Foreign Exchange Effects | (1.70) | (12.70) | 3.00 | (26.00) | (51.00) | |||||
| Net Change in Cash | (663.20) | 1,007.50 | 1,828.00 | (634.00) | 392.00 | 7,250.45 | 7,943.54 | 8,694.07 | 9,506.41 | 10,388.01 |
| Net Cash - Beginning Balance | 2,306.10 | 1,642.80 | 2,650.00 | 4,478.00 | 3,844.00 | 4,236.00 | 11,486.45 | 19,429.99 | 28,124.06 | 37,630.47 |
| Net Cash - Ending Balance | 1,642.80 | 2,650.20 | 4,478.00 | 3,844.00 | 4,236.00 | 11,486.45 | 19,429.99 | 28,124.06 | 37,630.47 | 48,018.48 |
Valuation
| Valuation | 2023 | 2024 | 2025 | 2026 | 2027 |
| Period 1 | Period 2 | Period 3 | Period 4 | Period 5 | |
| Free cash flow | 7,239.39 | 7,938.58 | 8,695.58 | 9,514.78 | 10,400.86 |
| Terminal value | 308,367.80 | ||||
| Present value of cash flows | 6,733.83 | 6,868.51 | 6,998.08 | 7,122.61 | 221,960.62 |
| Sum of PVs | 249,683.65 | ||||
| Debt | 6,000.00 | ||||
| Number of shares | 471.00 | ||||
| Share price estimate | 542.85 | ||||
| Market value | 512.00 | ||||
| WACC | |||||
| Equity | 13 | ||||
| Debt | 6 | ||||
| Total | 19.00 | ||||
| Equity | 68% | ||||
| Debt | 32% | ||||
| tax rate | 20.84% | ||||
| Cost of debt | 6% | ||||
| Cost of equity | 8.80% | ||||
| WACC | 7.5% | ||||
| Long term growth rate | 4% |
- ↑ https://www.statista.com/statistics/478166/adobe-segment-revenue/
- ↑ https://www.statista.com/statistics/478166/adobe-segment-revenue/
- ↑ https://www.statista.com/statistics/478166/adobe-segment-revenue/
- ↑ https://www.statista.com/statistics/266399/revenue-of-adobe-systems-worldwide-since-2004/#:~:text=Adobe%20Inc.%20reported%20a%20company,for%20its%202022%20fiscal%20year.
- ↑ https://www.statista.com/statistics/266399/revenue-of-adobe-systems-worldwide-since-2004/#:~:text=Adobe%20Inc.%20reported%20a%20company,for%20its%202022%20fiscal%20year.
- ↑ https://www.statista.com/statistics/266399/revenue-of-adobe-systems-worldwide-since-2004/#:~:text=Adobe%20Inc.%20reported%20a%20company,for%20its%202022%20fiscal%20year.