Direxion daily 20 year treasury bull 3x
| TMF | |
| Type | 3x Leveraged ETF |
| Founded | 16th April 2009 |
| Founder | Direxion |
| Capital ratio | Expense ratio: 1.06% (as of 22/07/2022) |
| Website | https://etfdb.com/etf/TMF/#etf-ticker-profile |
Overview edit edit source
The Direxion Daily 20+ Year Treasury Bull & Bear 3X Shares seek daily investment results, before fees and expenses, of 300%, or 300% of the inverse (or opposite), of the performance of the ICE U.S. Treasury 20+ Year Bond Index.[2] The purpose of this product is to provide exposure to the rising Treasury bond prices to profit during a recessionary period, where tightened credit market becomes unsustainable and forces the federal funds to taper its implemented monetary policy.
The idea edit edit source
TMF offers a powerful instrument for investors with a bullish outlook on US 20+ years Treasury bonds. In a form of leveraged ETF, TMF allow investors to take advantage of the deterioriatng economy by betting on long term Treasury yields to fall, mainly caused by the US interest rate cuts in an adverse economic scenario.[3] TMF was founded by Direxion along with 133 other ETFs that were launched in 2009, in order to provide leverage and hedge against a certain position or a sector for improved risk management, following the 2008 Financial Crisis.[4]
| Data | Value (as of 22/07/2023) |
|---|---|
| Current Price | $7.53 |
| Net Assets | $2.17B |
| Beta | 6.23 |
| Expense Ratio | 1.06% |
| Yield | 2.11% |
| 52 week range | $6.15 - $14.48 |
| Net Asset Value | 7.53 |
| Credit Rating | AAA |
| Weighted average maturity | 25.99 years |
Current Holdings edit edit source
| Security Description | Ticker | Type of Security | Holding Percentage |
|---|---|---|---|
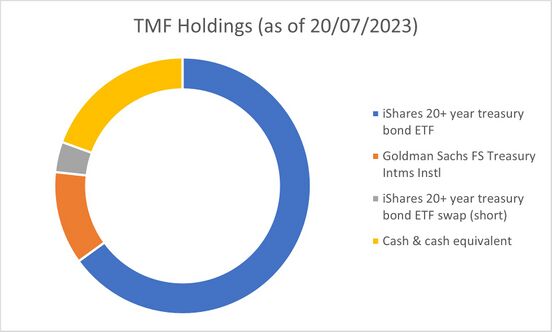
| IShares Tr Barclays 20+ year Treasury ETF | TLT | ETF | 65.02 |
| Goldman Sachs FS Treasury Instruments Instl | FTIXX | Swap | 11.70 |
| IShares 20+ year Treasury Bond ETF Swap | Short Swap | (3.83) | |
| Cash and cash equivalent | Cash | 19.45 |
Above lists the holdings of TMF as an ETF as of 20/07/2023. However, holdings of leveraged ETFs change daily.
Ownership edit edit source
Main institutional ETF and options ownership.
| Investor | Shares | Options (if applicable) |
|---|---|---|
| Barclays Plc | 1,169,520 | |
| Jane Street Group, Llc | 802,016 | |
| Hillhouse Capital Advisors, Ltd | 793,050 | |
| Berry Street Capital Management LLP | 750,000 | |
| Susquehanna International Group, LLP | 591,500 | Call |
| Aspireon Wealth Advisors | 516,285 | |
| Taika Capital LP | 490,800 | |
| Morgan Stanley | 329,577 | |
| Citadel Advisors Llc | 303,536 | |
| Two Sigma Securities, Llc | 259,410 | |
| Prelude Capital Management, Llc | 235,584 | |
| ORG Partners LLC | 162,247 | |
| LifeGuide Financial Advisors, LLC | 152,295 | |
| Atlas Financial Advisors, Inc | 133,112 | |
| JP Morgan Chase & Co | 114,932 | |
| Cutler Group LP | 146,600 | Put |
| Wolverine Trading, Llc | 144,500 | Put |
| Cantor Fitzgerald, LP | 89,157 | |
| Bank of New York Mellon Corporation | 60,002 | |
| SG Americas Securities, LLC | 41,700 | |
| Innova Wealth Partners | 39,248 | |
| Commonwealth Equity Services, Llc | 23,572 | |
| HAP Trading, LLC | 20,500 | Put |
| Tucker Asset Management LLC | 16,491 |
Leveraged ETFs edit edit source
Leveraged ETFs (exchange traded funds) are products which utilises financial derivatives such as future contracts, options and swaps in order to deliver the desired return of a particular index. [8]
Due to the high risk, TMF is typically used by traders to profit from the index's short term trends or through technical analysis. Therefore leveraged ETFs have the potential to provide significant gains as well as losses, and provide both long and short exposure to a certain index.
Typical holdings of an leveraged ETF include a signficant proportion invested in short term securities and a smaller position on volatile derivatives. Large amount of cash is generally used to meet financial obligations caused by the losses on the derivatives. This is held by maintaing a constant leverage ratio.
US Treasury Bonds edit edit source
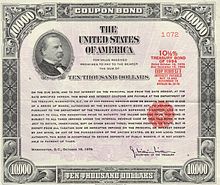
US Treasury Bonds are debt securities issued by the US government in exchange of a fixed annual interest. This type of sovereign debt is insured by the US government thus commonly referred as the risk free investment. Buying a Treasury bond is effectively lending money to the US government in exchange of a stated annual interest.
Bond prices of the US Treasury Bonds are influenced by many factors, including monetary policies, interest rates, economic growth and many more which are explained in Macroeconomics section.[10] Long term US Treasury Bonds which are typically referred to 10+ years to maturity, are more resilient to daily fluctuations and volatility, and are impacted by the macroeconomic decisions mostly by the federal reserve. During a volatile and uncertain economic period, cash inflows to these bonds increase as they are considered to be one of the safest haven during economic hardship.
ICE U.S. Treasury 20+ Year Bond Index (IDCOT20) edit edit source
This index illustrates the performance of US dollar fixed rate securities with maturity date longer than twenty years with the average weighted maturity period of 26 years.[11] TMF provides 300% daily returns of IDCOT20.
| Terms | Definition |
|---|---|
| Face value | Fixed price which the bond issuer pays back at the time of the bond's maturity |
| Bond price | Adjustable market price of the bond |
| Bond yield | Current bond price divided by the coupon rate |
| Coupon rate | Fixed annual return the investor expects to receive |
| Yield to maturity | Percentage rate of return assuming the investors holds the bond to maturity[12] |
Macroeconomics edit edit source
Monetary Policy edit edit source
Quantitative Tightening (QT) refers to reducing the liquidity out of the financial market. This is implemented by the US Federal Reserve shrinking its balance sheet by either selling the US Treasury bonds or letting the bonds on their balance sheet mature without reissuance. Quantitative tightening increases the amount of bonds available for investors which forces the bond yields higher in order to attract investors. This results in lower bond prices, and has a negative impact on the performance of TMF.[13]
Quantitative Easing (QE) is the reverse of quantitative tightening. This is commonly referred as "money printing", where the government issued bonds are acquired by the Federal Reserve. This increases the liquidity in the financial market and naturally leads to currency devaluation. Implementing QE is effectively issuing more debt, thus the Federal Reserve lowers the interest rate to minimise the cost of debt as much as possible. Lowering interest rates lead to higher bond prices, therefore QE has a positive impact on TMF performance.[14]
Recession edit edit source
By definition, recession implies a period of time with two or more consecutive quarters to negative growth of Gross Domestic Product. The period of recession is officially declared by the National Bureau of Economic Research. Therefore, despite having two consecutive negative growth during Q1 and Q2 of 2022, this period wasn't declared and officially recongnised as a recession.
During a recession, or a stagnating economy, the Federal Reserve typically implement quantitative easing with interest rate cuts to pump more liquidity into the financial market in order to revive the economy. With treasury yields being correlated to interest rates and bond prices being inversely proportional, the Federal Reserve's attempt to overcome a recession will increase bond prices and TMF.[15]
Also, liquidity flows into the safest assets with a relatively lower volatility during an economic hardship, with US Treasury Bonds are considerd to be one of the safest asset to own. Increasing demand for the US Treasury will increase the price of bonds and conversely further decrease the bond yields.
Inverted Yield Curve edit edit source
Treasury bonds with longer maturity date typically has a higher yield, as it has increased economic uncertainty and devaluation with rising annual inflation. However when shorter bonds have a higher yield than long term bonds, it is described as a yield curve inversion. This inversion is most commonly measured by 2 year yield minus 10 year yield. When this metric dips below 0 basis point, it accurately predicted every recession in the last half century thus regarded as an accurate indicator of a recession. Historically it required 6 to 18 months since the inversion for the recession to occur. It's recognised as a reliable recession indicator as it illustrates the shortage of money supply in the near term, which indicate the economic turmoil.
Yield curve inverted on July 2022 and its been deteriorating to negative 95 basis points (as of 22/07/2023).[17]
Inflation edit edit source

Increasing inflation diminishes the value of bond's future cash flows. As occurred in 2022, if a bond has a coupon rate of 3% and inflation rate (Consumer Price Index) is at 9%, real yield of that particular bond is -6%. This again is correlated to the Federal Reserve's monetary policy as the interest rates will rise in order to bring down inflation. Therefore higher inflation leads to higher interest rates, higher yields will be demanded by investors which brings to bond prices down.
Long term inflation target by the FED is 2% and the federal reserve is remaining hawkish as they are determined to bring long term inflation down to their target.[19]
Increasing inflation will typically bring bond prices down and plummet the performance of TMF and vice versa.
June Consumer Price Index was at 3% from the high of 9.1% in June 2022, which decreased the probability of further interest rate hikes. As of 22/07/2023, economic consensus indicate 70% of investors are anticipating a 25 basis point rate hike in July Federal Open Market Committee, and 33% are expecting a further 25 basis point hike in September FOMC.
Microeconomics edit edit source
Credit Card Debt edit edit source
US credit card debt is at an all time high at $993B as of 5th July 2023.[20] Delinquency rate on credit card loans have been increasing for the sixth consecutive quarter, nearing the pre-pandemic level at 2.43% at Q1 2023.[21] Rising debt and its delinquencies will most likely lead to increased default rates. Potential economic hardship may trigger a recession which will be advantageous to TMF. Rising interest rates on the existing debt will only worsen this debt crisis.
The upward trend in delinquency rates on credit card debt typically indicate the beginning of a recession, which was evident in 2000 dot-com crash, 2008 financial crisis and 2020 Covid pandemic. Rapid decrease in delinquency rates after the start of a recession was due to the financial aid or a "bail-out" by the federal reserve by implementing QE and rate cuts to revive the economy. Another upward trend in delinquency rates can be observed from 2021 which may signal the start of a recessionary period in the near future.
US personal savings rate is hovering near the lowest level, with the highest debt level and rising delinquency rates while consumer spending remains resilient. This raises concerns and risks in the US economy as the ability to pay back the loans remains questionable. Rising delinquency rates typically leads to rising default rates on those loans, leading to a struggling economy which has a positive effect on the performance of TMF.
Commercial Real Estate edit edit source

Small businesses are in the epicentre of the economic damage from tightened monetary policy. Small business rent delinquency rates have reached 40% in the United States in June, equalling April's record data.[27] Businesses struggling to pay rent may have to reduce and minimise their expenses which are evident in mass layoffs in the economy.[28]
Commercial real estate crisis is also effecting individuals and in total $1.5T of commercial real estate loans is due to mature by 2025.[29] Refinancing on those loans may not be affective with high interest rates.
Recent regional banking turmoil including Silicon Valley Bank and Signature Bank, raised the issue of CRE loans. As regional banks suffer vast amount of unrealised losses due to deflation in bond prices in their portfolio, those banks are limiting the amount of lending to risky assets including CRE. Close to 80% of those CRE loans are responsible by these regional banks which raises concerns for both regional banks CRE market and the economy as a whole. Downward trend in commercial real estate, especially office buildings may worsen the issue. With hybrid and remote working environment along with mass layoffs, demand for office buildings are likely to be weakening for the near future. This decrease the value of CRE and dampens the losses suffered by the CRE exposure of the regional banks.[30]
Defaults on CRE loans by corporations and individuals may increase the probability of a recession, which is beneficial for TMF.
Historical Performance edit edit source
![TMF[31]Interest rates, 30 year treasury yield[32]](/images/e/ee/Tmf_graph.jpg)
TYX indicates the treasury yield of US 30 year Treasury Bond.
Inverse correlation can be observed between TMF and TYX. TYX tends to be proportional to the federal funds rate whenever a drastic change in interest rates occur. Sustainability of a aggressive inflation fight and interest rate hikes remain questionable and FED annually assesses the impact of the unsustainable economy with its annual bank stress test.
FED Bank Stress Test 2023 edit edit source
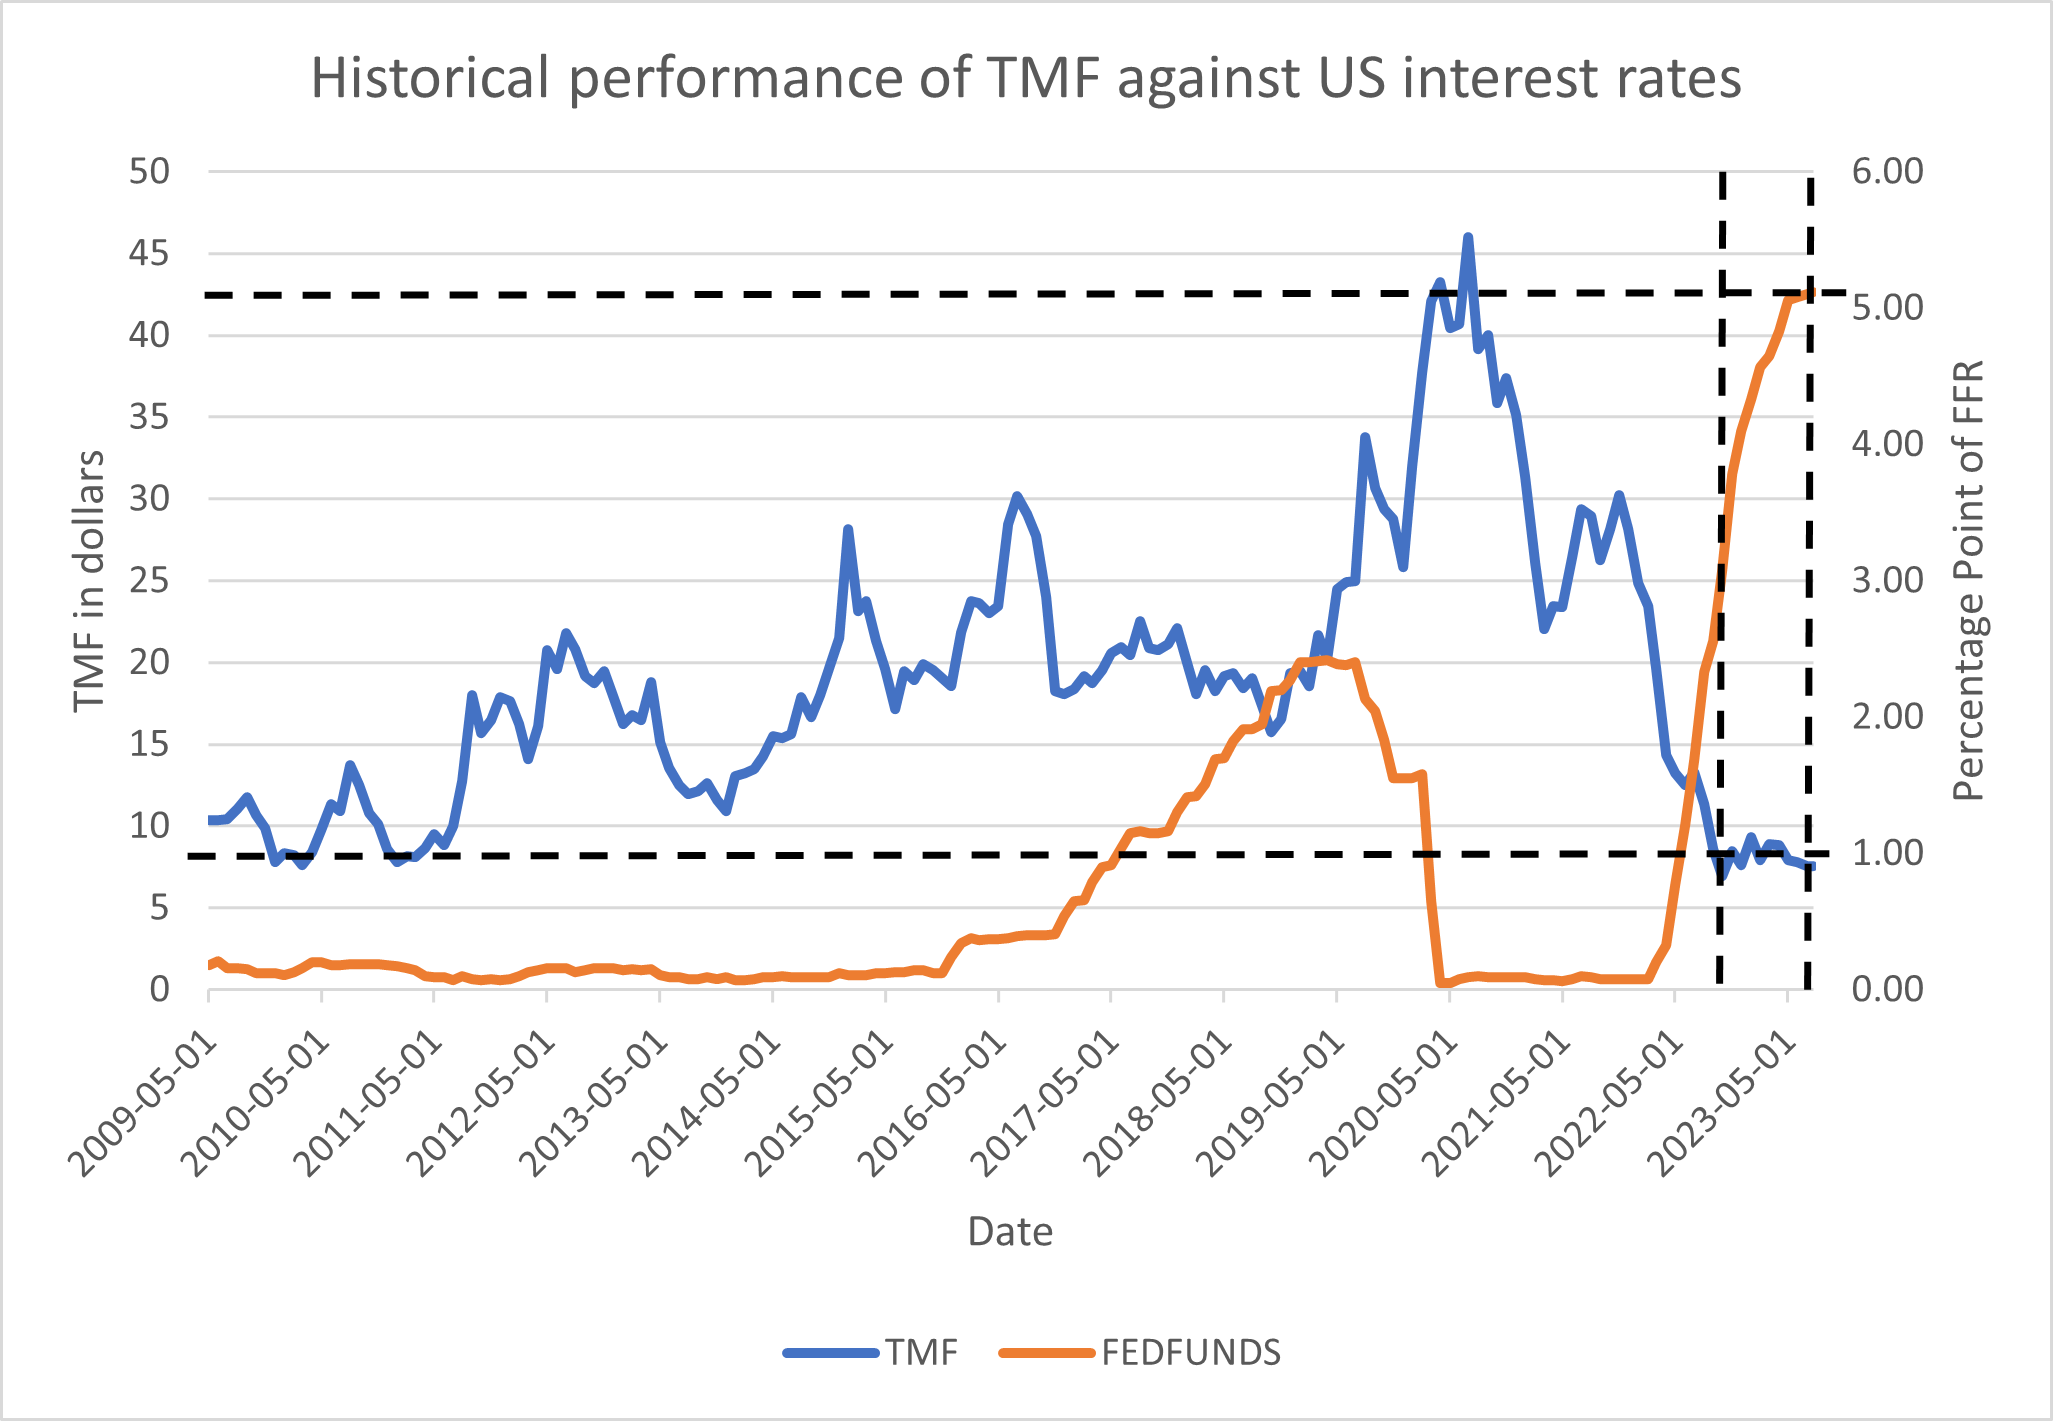
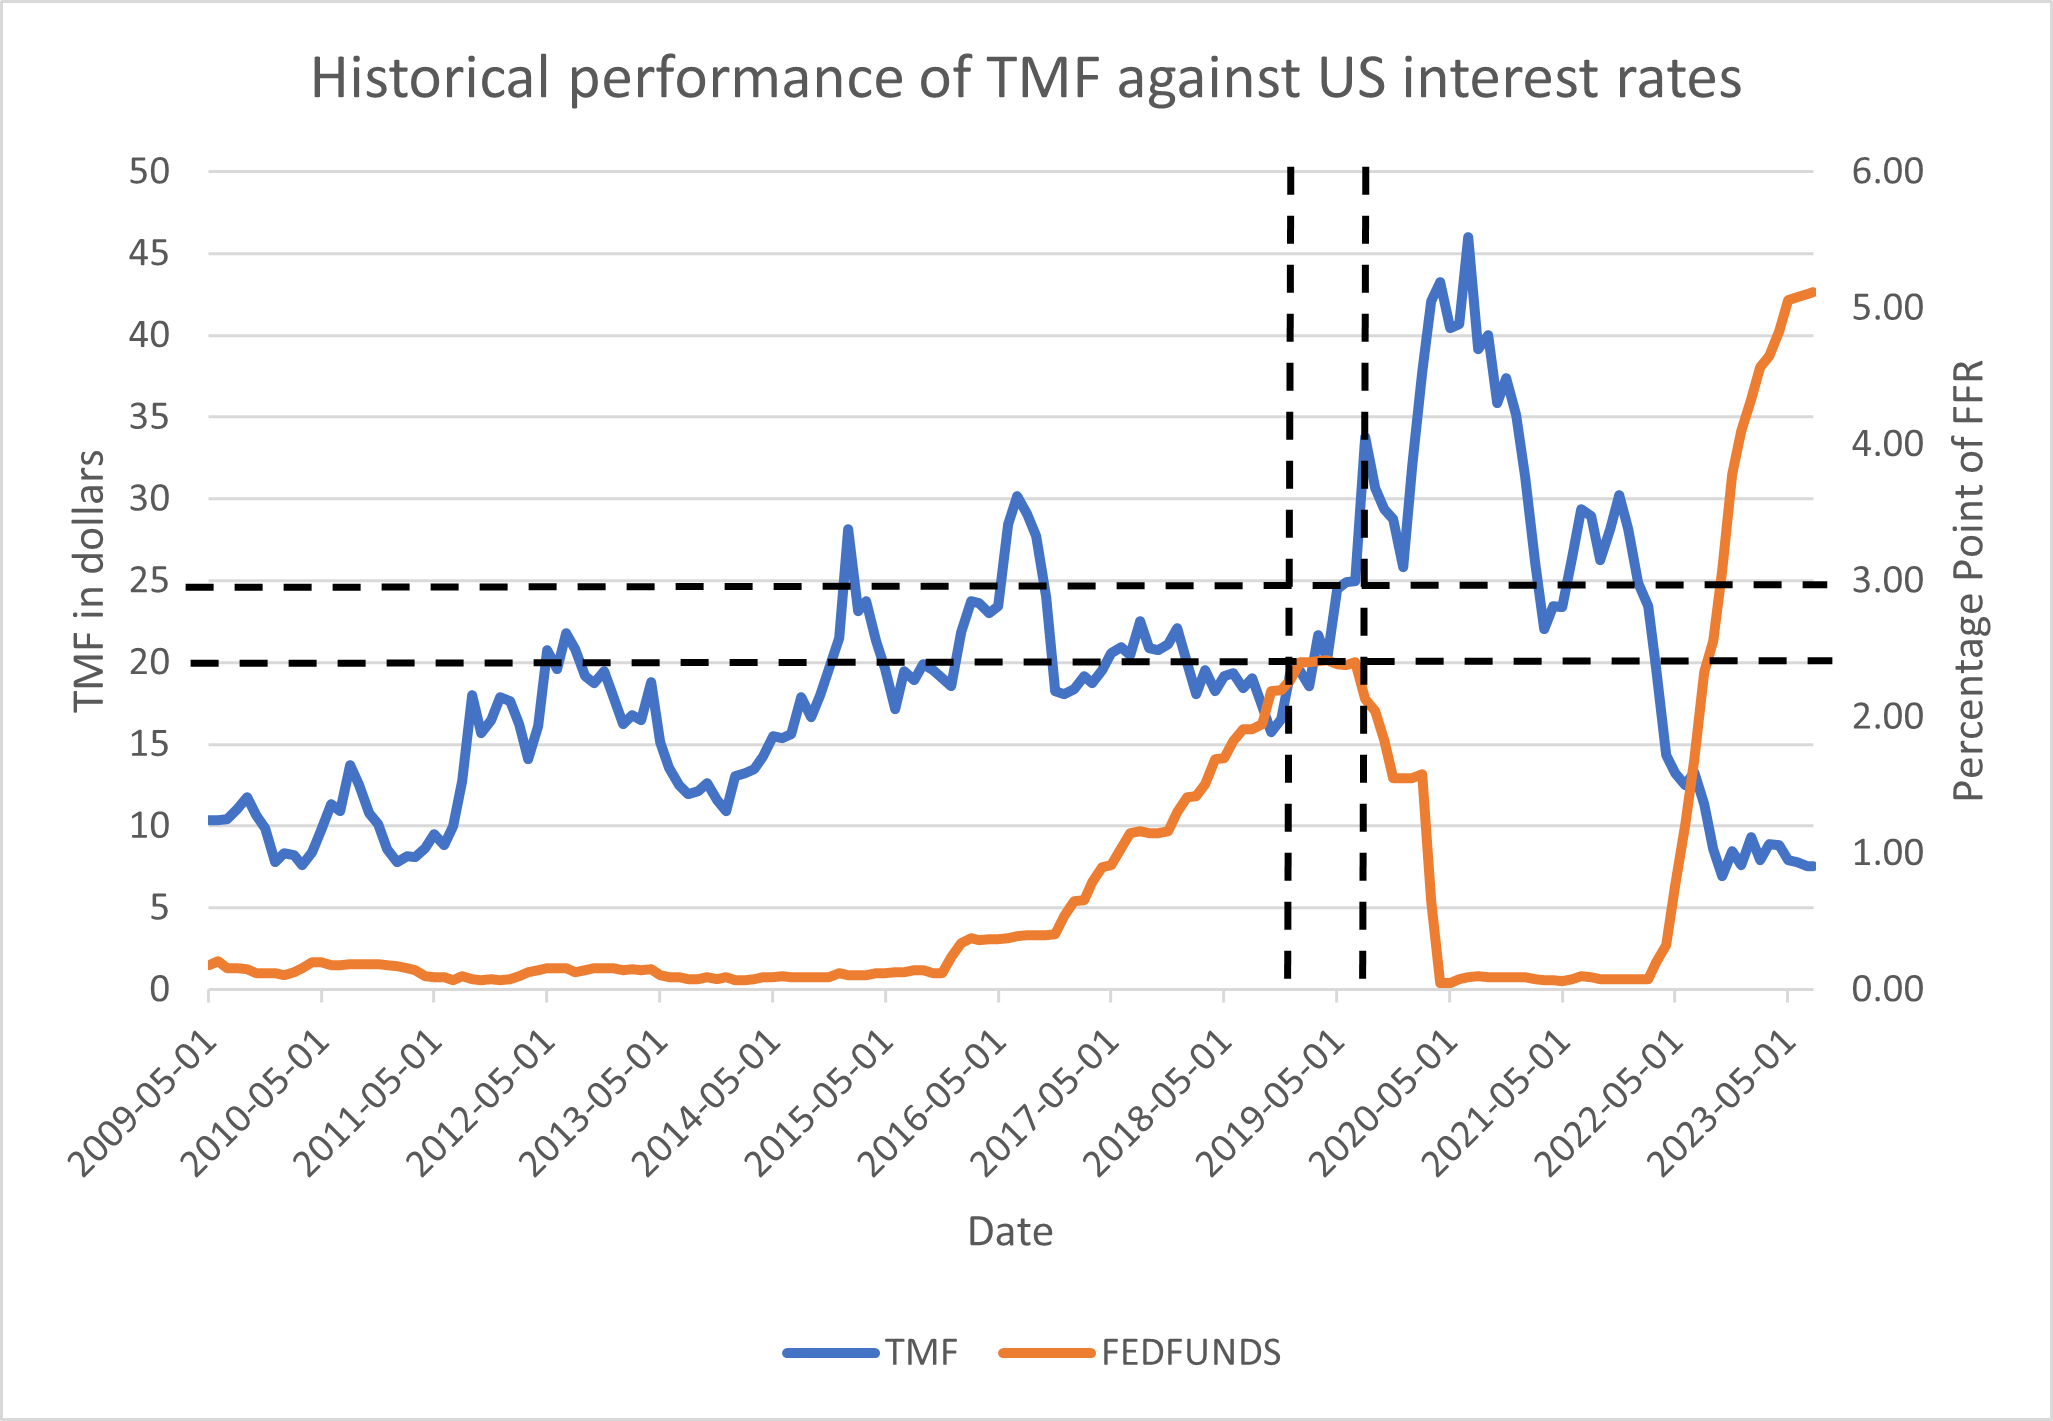
The Federal Reserve carry out the annual bank stress test in a hypothetical severely adverse scenario to test the financial resilience of US banks to evaluate the risks and strengths. 2023 Bank Stress Test indicate in a "severely adverse" scenario, projection of the 3 month Treasury yield is expected to plummet from 4% to 0.1%, which indicate a severe recession forcing the federal reserve to decrease the fed funds rate to near zero. Near zero interest rates will decrease treasury yields and drive TMF higher.
In the same scenario, commercial real estate prices are projected to decrease by up to 40%. The exposure of CRE and its loans by the banks, along with the real estate crash may contribute to bring interest rates lower.
Projection edit edit source
The nature of leveraged ETFs make the forecast of the performance extremely challenging and inaccurate, however economic trends can be identified based on past performances and used to project future performances. Three different cases were evaluated for the projection of TMF performance. Bull case refers to the catastrophic economic conditions with a severe recession, providing bullish conditions for TMF and vice versa.
Bear Case edit edit source
In this scenario, the Federal Reserve will hike the interest rates up to 5.50 ~ 5.75 with two more 25 basis points hikes, in July and September FOMC. Economy remains resilient and has enough strength to withstand tightened credit conditions. The federal reserve is likely to hold the rates until Q3 2024 as stated by their chairman Jerome Powell, and performance of TMF will struggle to see the upside in the next few years. [33]
Base Case edit edit source
This scenario refers to the general consensus of the market. According to CNBC research, market sees the interest rates decreased to 3% by 2025 after peaking in September 2023 with 5.50%. TMF historically performs in the range between $20 and $25 with these rate cuts, which provide 165% to 229% upside potential.[34] However, the pace of rate cuts need to be considered as well as incoming economic data to determine the projection on TMF. Rate cuts may indicate a soft landing with a mild technical recession to bring inflation down to 2% while having a minimal impact on the labour market.
Bull Case edit edit source
This case refers to the severely adverse scenario as indicated by the federal reserve bank stress test, where the economy undergoes a severe economic recession forcing the interest rates to near zero level. Although the likelihood of this case is not the highest, this scenario appears to be similar with 2020 Covid crash, where the significant QE and rate cuts were observed allowing TMF to reach above $45 with 497% upside from current price.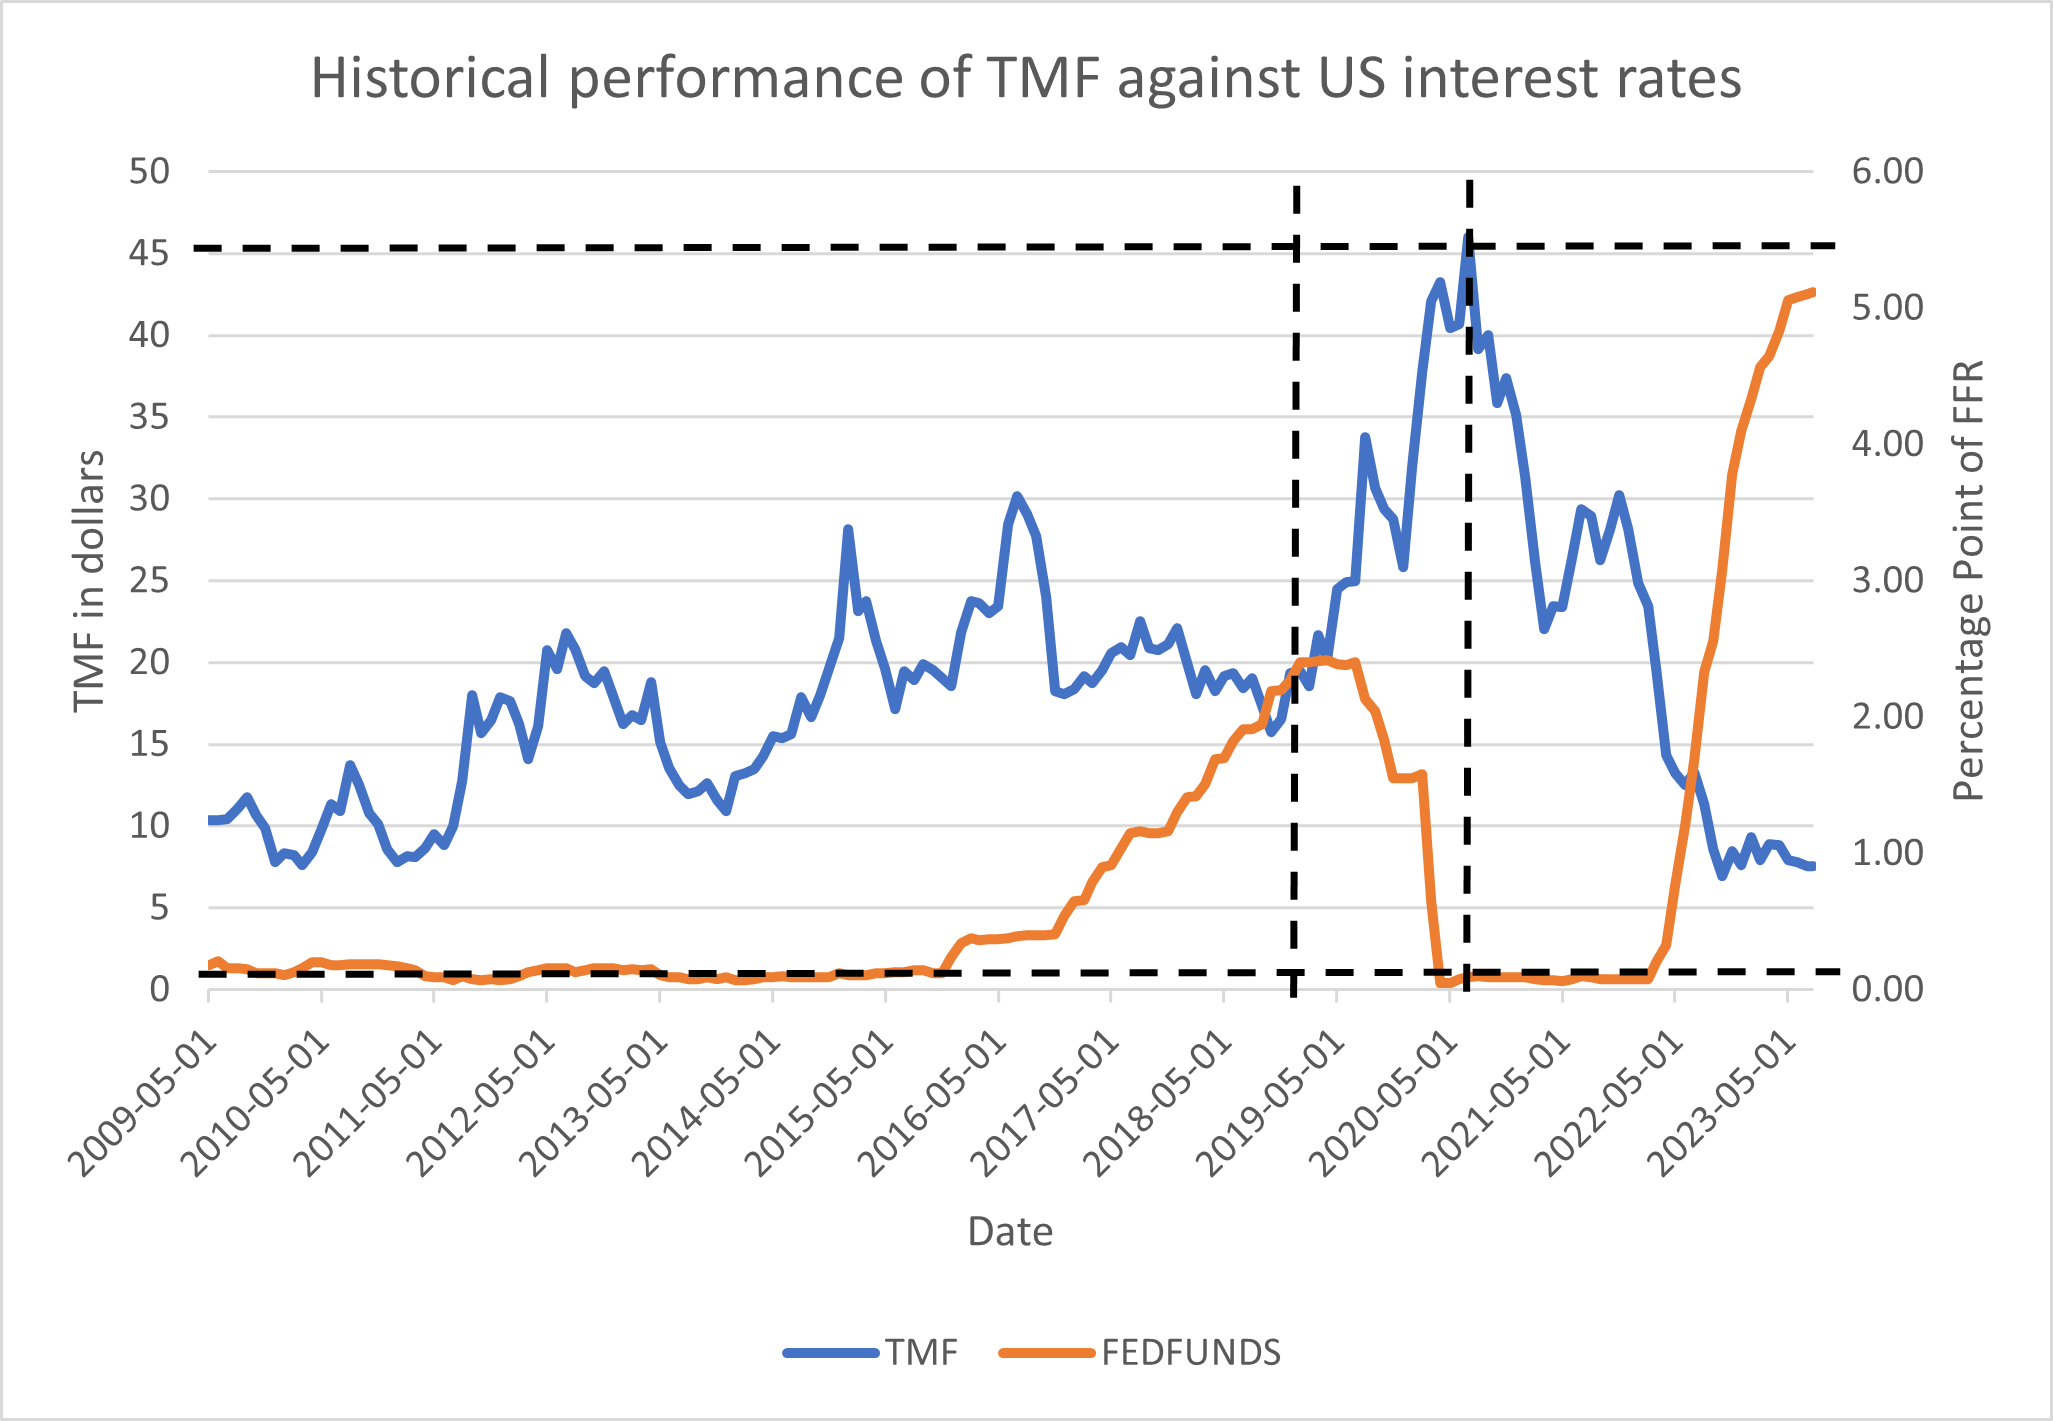
Risk assessment edit edit source
Risks as a Leveraged ETF edit edit source
TMF, being a 3x leveraged ETF, comes with a substantial risk as the product is leveraged with derivatives to achieve higher returns. These derivatives include future contracts, swaps and options with high volatility. Leveraged ETFs provide daily return of the desired multiple, and the return resets daily. Compounding returns can bring significant losses or gains. With the considerable risk, TMF is not considered appropriate for long term investment and mostly used for trading.[35]
Expense ratio also plays a role. Expense ratio indicate the annual percentage of an investor's investment for the ETF provider for providing the service as commission. 3x Leveraged ETF typically has a relatively high expense ratio which negatively impacts an investor's portfolio.
Macroeconomic risks edit edit source
June Jobs report indicate resilient strength of the labour market with 3.6% unemployment rate. Total private payrolls estimated 220k jobs to be added, which provided an upside surprise with 497k actual value. Although June Payrolls was slightly lower than expected with 209,000 jobs added vs 230,000 jobs estimated, overall labour market remain resilient.
Strong labour market gives room for the federal reserve for more rate hikes as it indicates the strength of the economy.[36]
References edit edit source
- ↑ https://www.direxion.com/product/daily-20-year-treasury-bull-bear-3x-etfs
- ↑ https://www.direxion.com/product/daily-20-year-treasury-bull-bear-3x-etfs
- ↑ https://etfdb.com/etf/TMF/#etf-ticker-profile
- ↑ https://www.plansponsor.com/etfs-continue-growth-in-2009/
- ↑ https://www.direxion.com/product/daily-20-year-treasury-bull-bear-3x-etfs
- ↑ https://www.direxion.com/product/daily-20-year-treasury-bull-bear-3x-etfs
- ↑ https://fintel.io/so/us/tmf
- ↑ https://www.investopedia.com/terms/l/leveraged-etf.asp
- ↑ https://en.wikipedia.org/wiki/United_States_Treasury_security
- ↑ https://www.investopedia.com/ask/answers/062315/which-economic-factors-impact-treasury-yields.asp#:~:text=Interest%20rates%2C%20inflation%2C%20and%20economic%20growth%20are%20among%20the%20biggest,the%20direction%20of%20Treasury%20yields.
- ↑ https://www.theice.com/publicdocs/data/ICE-Indices_20+yrs.pdf
- ↑ 12.0 12.1 https://www.investopedia.com/ask/answers/020215/what-difference-between-yield-maturity-and-coupon-rate.asp#:~:text=The%20yield%20to%20maturity%20(YTM)%20is%20the%20percentage%20rate%20of,(par%20value)%20at%20maturity.
- ↑ https://www.investopedia.com/quantitative-tightening-6361478
- ↑ https://www.investopedia.com/ask/answers/012815/how-does-quantitative-easing-us-affect-bond-market.asp
- ↑ https://www.vinovest.co/blog/bonds-during-recession
- ↑ https://fred.stlouisfed.org/series/T10Y2Y
- ↑ https://fred.stlouisfed.org/series/T10Y2Y
- ↑ https://internationalfinance.com/top-reasons-for-inflation/
- ↑ https://tradingeconomics.com/united-states/interest-rate
- ↑ https://www.foxbusiness.com/economy/credit-card-debt-rising-double-edged-sword-economy
- ↑ https://fred.stlouisfed.org/series/DRCCLACBS
- ↑ https://fred.stlouisfed.org/series/CCLACBW027SBOG
- ↑ https://fred.stlouisfed.org/series/DRCCLACBS
- ↑ https://fred.stlouisfed.org/series/CCLACBW027SBOG
- ↑ https://fred.stlouisfed.org/series/PSAVERT
- ↑ https://www.adventuresincre.com/careers-in-real-estate/
- ↑ https://thehill.com/business/4073250-small-businesses-struggling-to-make-rent-report/
- ↑ https://www.businessinsider.com/layoffs-sweeping-the-us-these-are-the-companies-making-cuts-2023
- ↑ https://www.businessinsider.com/layoffs-sweeping-the-us-these-are-the-companies-making-cuts-2023
- ↑ https://cre.moodysanalytics.com/insights/cre-news/whats-the-real-situation-with-cre-and-banks-doom-loop-or-headline-hype/
- ↑ https://finance.yahoo.com/quote/%5ETYX/history?period1=1370044800&period2=1689984000&interval=1mo&filter=history&frequency=1mo&includeAdjustedClose=true
- ↑ https://www.direxion.com/product/daily-20-year-treasury-bull-bear-3x-etfs
- ↑ https://www.usatoday.com/story/money/2023/06/16/when-will-the-fed-cut-interest-rates-2023/70330336007/
- ↑ https://www.cnbc.com/2023/06/14/the-fed-forecasts-two-more-hikes-this-year-taking-rates-as-high-as-5point6percent.html#:~:text=The%20central%20bank%20also%20hiked,their%20expectations%20for%20economic%20growth.
- ↑ https://www.investopedia.com/articles/investing/121515/why-3x-etfs-are-riskier-you-think.asp
- ↑ https://www.cnbc.com/2023/07/07/jobs-report-june-2023-.html
![2 year treasury yield minus 10 year treasury yield data[16]](/images/0/0f/T210.jpg)
![credit card debt[22], delinquency rates[23]](/images/4/43/Delinquency1.jpg)
![credit card debt[24]personal savings rate[25]](/images/a/a3/Debt_delinquency123.jpg)
