Martin Currie Global Portfolio Trust
Summary edit edit source
Patiently waiting for the storm to pass
Martin Currie Global Portfolio Trust (MNP) has experienced a tough six-month period of relative performance at a time when value rather than growth stocks have been favoured by investors. The trust’s manager, Zehrid Osmani, has stayed true to his strategy of investing in high-quality companies with long-term growth potential, aiming to generate above-market returns over a rolling five-year period. He says that this approach has compounded investors’ wealth over the long term, and that ‘all it takes is a few quarters of positive earnings growth during a period of negative earnings revisions, and MNP should once again outperform’. He states that ‘valuation discipline is critical, but even more so now in an environment of rising interest rates’. The trust’s portfolio turnover remains low as the manager is not panicking or trying to chase performance.
NAV performance versus the benchmark over the last five years (Osmani’s tenure as MNP’s lead manager started on 1 October 2018)[1]
The analyst’s view edit edit source
While the trust’s recent performance has been disappointing, it is a reflection of macroeconomic developments in 2022, rather than a deterioration in portfolio companies’ fundamentals. MNP’s relatively concentrated portfolio of 29 quality businesses that are trading at sensible valuations should ultimately bear fruit for long-term global equity investors given Osmani’s disciplined approach, which is based on detailed bottom-up research. The manager and his team constantly revisit the trust’s holdings to monitor their operating trends and to ensure their investment theses still hold true. There has recently been a change in MNP’s investment policy (see page 9); while this will not change Osmani’s approach, it further emphasises the importance of ESG analysis within the research process, thereby further differentiating the trust from its peers.
Commitment to zero-discount policy edit edit source
MNP’s board employs a zero-discount policy aiming to ensure that, in normal market conditions, the trust’s shares trade close to NAV. Its 2.5% discount to cum-income NAV compares with a 0.0% to a 0.9% range of average discounts over the last one, three, five and 10 years. MNP has considerable reserves that can be drawn down, when necessary, to enable stable annual dividend payments.
Market outlook: Selectivity warranted edit edit source
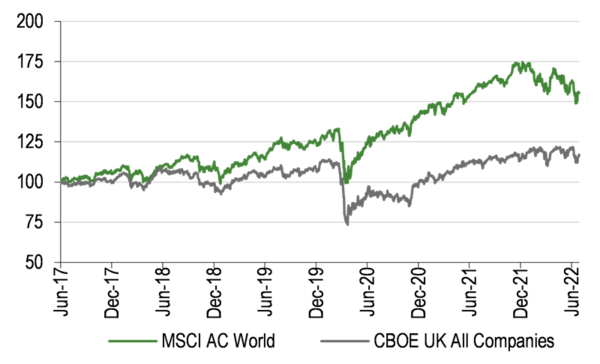
As shown in Exhibit 1 (left-hand side) the global stock market has rolled over in 2022 and unlike in recent years, UK stocks have performed relatively better. Investors are having to deal with the new realities of rampant inflation and rising interest rates; given the extended period of low growth and ultra-low interest rates, many market participants will not have experienced this before. Also, there are other headwinds to global economic growth, including the war in Ukraine and China’s zero-COVID policy. Understandably, investors have adopted a ‘risk-off’ attitude.
Looking at the US bellwether S&P 500 index, from the end of December 2021 to 29 June 2022, only one sector was in positive territory; energy was up by c 35% due to rising commodity prices, while the other 10 sectors were down in a range of single digits to more than 30%. While valuations have moderated, the Datastream World Index is now trading on a 13.7x forward earnings multiple, compared with 17.4x at the beginning of 2022, this devaluation is unlikely to provide support for stock prices if earnings estimates are too optimistic and need to be revised down.
In an uncertain environment, investors may benefit from taking a longer-term perspective and focusing on high-quality stocks with sustainable growth potential, which are trading on reasonable valuations. In aggregate, technology stocks had been multi-year outperformers until the end of 2021 but have since de-rated meaningfully as higher interest rates reduce the present value of their long-term cash flows. Hence, going forward, considering companies on a case-by-case basis, rather than ‘following the trends’ would appear to be a sensible approach, as over the long term, firms with solid fundamentals have tended to generate good returns for investors.
Exhibit 1a: Global and UK indices (£ total return) last five years[2]
| Last | High | Low | 10-year
average |
Last as % of
average | |
|---|---|---|---|---|---|
| US | |||||
| P/E 12 months forward (x) | 16.2 | 23.6 | 11.9 | 17.5 | 92 |
| Price to book (x) | 3.7 | 4.7 | 1.9 | 3.0 | 123 |
| Dividend yield (%) | 1.7 | 2.7 | 1.2 | 2.0 | 84 |
| Return on equity (%) | 18.1 | 18.5 | 9.8 | 13.7 | 133 |
| World | |||||
| P/E 12 months forward (x) | 13.7 | 20.0 | 10.6 | 15.3 | 90 |
| Price to book (x) | 2.2 | 2.6 | 1.5 | 1.9 | 114 |
| Dividend yield (%) | 2.4 | 3.4 | 1.8 | 2.4 | 100 |
| Return on equity (%) | 13.8 | 14.0 | 7.2 | 10.9 | 127 |
The fund manager: Zehrid Osmani edit edit source
The manager’s view: More cautious on global growth prospects edit edit source
Over the past few months, Osmani’s view on the economic outlook has changed as a result of macroeconomic developments. In our last MNP review, published in January 2022, the manager was positive on the prospects for global economic growth; however, he now believes that there is a 60–65% probability of a slowdown. Osmani has also increased the chances of stagflation (high inflation and stagnant demand) from less than 5% to 10–15%; he believes that the highest risk of stagflation is in Europe. The manager says that ‘a lot has happened in the last six months’, highlighting the war in Ukraine, which is ‘adding fuel to the fire on the inflationary front’, evidenced by higher oil and soft commodity prices.
Osmani also points to China’s zero-COVID policy, which has led to sizable lockdowns in around a third of the territory. This approach has negatively affected both supply (increased bottlenecks in the global supply chain) and demand (Chinese consumers are an important part of global demand). He believes that leading indicators are declining rapidly, especially in Europe and the United States. Osmani’s view is that an economic slowdown typically favours the relative performance of quality, growth and momentum stocks as there is a higher likelihood of earnings downgrades elsewhere in the market. He highlights that profit warnings have already started, citing negative earnings releases from Netflix and major US retailers Target and Walmart. Consensus 2022 global earnings growth is 7–8%; however, the manager believes this is too optimistic and considers 4% to be a more realistic outcome. He also suggests that the consensus 4–5% for European earnings growth for this year is likely to be revised down to zero.
In line with his well-documented investment approach, Osmani continues to focus on companies with consistent earnings and long-term structural growth opportunities, and pricing power, which he believes should perform relatively well in an inflationary environment. Turning his attention to China, the manager says the slowdown has been self-inflicted due to the zero-COVID policy and suggests that when the economy does reopen, there should be a strong recovery. Now, the country is navigating through partial lockdowns and Osmani acknowledges pandemic-relapse risk both in China and elsewhere. Despite this, he is more bullish on the prospects for the Chinese economy over the next 18 months compared with the rest of the world. He cites the risk of a slowdown in Europe given the region’s dependency on Russian energy, and in the United States, due to its reliance on a buoyant stock market to support demand. Osmani suggests that there is a wide range of potential outcomes from a global recession to economic expansion led by a recovery in China; he places his views in the middle of these extremes.
The manager highlights the risk from central banks’ monetary policy, suggesting that if they act too late, inflation will be out of control and they will have to hike interest rates aggressively. Furthermore, if they do not raise interest rates sufficiently, investors will anticipate more rate hikes in the future, which is the case now, as evidenced by rising bond yields. Osmani suggests that ‘all eyes are on inflation’ and what happens here ‘will dictate the level of stock market volatility’. He believes that higher inflation datapoints will cause aggressive stock price moves, whereas lower inflation numbers ‘could calm investors’ nerves’; although the manager admits it is difficult to have a firm view on the near-term outcome. He comments that wage inflation in the United States brings the risk of structural rather than cyclical economic impacts.
Referring to recent company meetings, Osmani says that he is not receiving consistent messages, which highlights the importance of assessing businesses on a case-by-case basis. The manager says that historically, households have tended to be very sensitive to a higher cost of living, which is what we are all experiencing, such as increased prices for food, energy and fuel. Osmani highlights that many industrial companies are experiencing strong operating trends. He cites construction companies, where some businesses have increased their prices by more than 20% in just three months to cover rising raw material costs; ‘there are companies out there with pricing power’, adds the manager. He also highlights the strong order books at semiconductor companies; business momentum in that industry remains robust despite supply bottlenecks.
When questioned about opportunities identified during the 2022 market weakness, Osmani says that there are companies where he had liked the business model but not the valuation and that there are some ideas under consideration where he sees ‘decent upside’ to his estimated price targets. However, the manager points to the share price weakness of MNP’s portfolio companies year-to-date, where at times ‘selling was indiscriminate’. Osmani highlights that apart from fashion retailer Farfetch, which is yet to break even, all the names in the fund are profitable growth companies with high returns, robust balance sheets and strong cash flow generation. He suggests that some of the trust’s holdings have even more upside potential than the new opportunities that he has identified.
Current portfolio positioning edit edit source
MNP’s largest holdings at end-May 2022, which represent a range of sectors, are shown in Exhibit 2. The top 10 concentration has increased from 43.7% to 53.3% over the prior 12 months, reflecting Osmani’s increased level of conviction in these names.
| Company | Country | Sector | Portfolio weight % | |
|---|---|---|---|---|
| 31 May 2022 | 31 May 2021* | |||
| Microsoft Corp | US | Information technology | 6.8 | 4.6 |
| Linde | US | Materials | 6.4 | 4.4 |
| ResMed | US | Healthcare | 5.5 | 4.1 |
| ASML Holding | Netherlands | Information technology | 5.4 | N/A |
| NVIDIA Corp | US | Information technology | 5.3 | N/A |
| Kingspan Group | Ireland | Industrials | 5.3 | 4.4 |
| Visa | US | Information technology | 5.1 | N/A |
| Hexagon | Sweden | Industrials | 4.8 | 4.1 |
| CSL | Australia | Healthcare | 4.4 | N/A |
| Moncler | Italy | Consumer discretionary | 4.3 | 4.7 |
| Top 10 (% of portfolio) | 53.3 | 43.7 | ||
The most significant changes in MNP’s geographic exposure in the 12 months to end-May 2022 (Exhibit 3) are a higher North American (+5.0pp) and a lower emerging markets weighting (-8.5pp). Compared with the benchmark, the largest deviations remain Europe (including the UK) at +26.8% and North America at -20.1pp; however, investors should remember that the trust’s geographic and sector allocations are the result of bottom-up stock selection.
| Portfolio end-
May 2022 |
Portfolio end-
May 2021 |
Change
(pp) |
Index
weight |
Active weight
vs index (pp) |
Trust weight/
index weight (x) | |
|---|---|---|---|---|---|---|
| North America | 43.7 | 38.7 | 5.0 | 63.8 | (20.1) | 0.7 |
| Europe (inc UK) | 42.8 | 40.3 | 2.5 | 16.0 | 26.8 | 2.7 |
| Pacific ex-Japan | 7.7 | 6.7 | 1.0 | 3.1 | 4.5 | 2.4 |
| Emerging markets | 5.8 | 14.3 | (8.5) | 11.4 | (5.6) | 0.5 |
| Middle East | 0.0 | 0.0 | 0.0 | 0.2 | (0.2) | 0.0 |
| Japan | 0.0 | 0.0 | 0.0 | 5.5 | (5.5) | 0.0 |
| Total | 100.0 | 100.0 | 100.0 |
| Portfolio end-
May 2022 |
Portfolio end-
May 2021 |
Change
(pp) |
Index
weight |
Active weight
vs index (pp) |
Trust weight/
index weight (x) | |
|---|---|---|---|---|---|---|
| Information technology | 33.8 | 26.9 | 6.9 | 21.3 | 12.5 | 1.6 |
| Healthcare | 23.3 | 26.3 | (3.0) | 12.3 | 11.0 | 1.9 |
| Consumer discretionary | 13.3 | 19.5 | (6.2) | 11.0 | 2.4 | 1.2 |
| Industrials | 11.6 | 10.8 | 0.8 | 9.4 | 2.2 | 1.2 |
| Consumer staples | 5.8 | 5.6 | 0.2 | 7.3 | (1.5) | 0.8 |
| Materials | 5.8 | 4.0 | 1.7 | 5.1 | 0.6 | 1.1 |
| Financials | 3.7 | 3.4 | 0.3 | 14.8 | (11.1) | 0.3 |
| Communication services | 2.7 | 3.4 | (0.8) | 7.8 | (5.2) | 0.3 |
| Real estate | 0.0 | 0.0 | 0.0 | 2.7 | (2.7) | 0.0 |
| Utilities | 0.0 | 0.0 | 0.0 | 3.1 | (3.1) | 0.0 |
| Energy | 0.0 | 0.0 | 0.0 | 5.2 | (5.2) | 0.0 |
| Total | 100.0 | 100.0 | 100.0 |
Exhibit 4 shows that over the 12 months to end-May 2022, the largest changes to MNP’s sector exposures are a higher technology weighting (+6.9pp) and lower exposures to the consumer discretionary (-6.2pp) and healthcare (-3.0pp) sectors. The largest active weights versus the benchmark are overweight allocations to the IT (+12.5pp) and healthcare (+11.0pp) sectors, with an underweight allocation to financial stocks (-11.1pp). MNP continues to have zero exposure in the real estate, utilities and energy sectors, which together made up 11.0% of the benchmark at end-May 2022.
In April 2022 the manager switched MNP’s holding in Taiwan Semiconductor Manufacturing Company (TSMC) into Netherlands-listed ASML Holdings (ASML), which following market weakness has more upside to the manager’s estimated target price than TSMC. Osmani explains that these transactions maintain MNP’s semiconductor exposure but is a move higher up the value chain as ASML is a quasi-monopoly. Both companies have a similar growth profile in terms of sales and earnings, but ASML has a higher return on invested capital (ROIC) than TSMC. There is also higher political risk at TSMC due the tensions between Taiwan and China. The manager says that ASML is a beneficiary of the proliferation of production sites. TSMC is building a facility in the United States, Japan has invited the company to build in its territory and Europe is likely to follow suit. Once these operations are up and running, ASML will be shipping its tools to four of TSMC’s facilities rather than just to Taiwan, which will bring scale benefits to ASML’s operations.
Commenting on the limited number of new positions and complete disposals in recent months, Osmani says that he and his team are constantly ‘kicking the tyres’ of portfolio companies to determine if any share price weakness is due to deteriorating fundamentals. He reports that almost all investee firms are ‘delivering or overdelivering’ and his level of conviction in these companies remains high. A small position in JD.com was sold in March 2022 following a two-month lock-up period after the spinout from Tencent.
Performance: Poor six months has hit long-term record edit edit source
| 12 months ending | Share price
(%) |
NAV
(%) |
Benchmark*
(%) |
MSCI AC World
(%) |
CBOE UK All Companies (%) |
|---|---|---|---|---|---|
| 31/05/18 | 7.0 | 7.8 | 8.7 | 9.1 | 6.6 |
| 31/05/19 | 13.8 | 11.0 | 5.1 | 4.8 | (3.4) |
| 31/05/20 | 9.3 | 15.2 | 8.5 | 8.0 | (12.0) |
| 31/05/21 | 28.0 | 23.1 | 23.9 | 23.9 | 23.4 |
| 31/05/22 | (16.3) | (15.4) | 5.6 | 5.6 | 8.5 |
In FY22 (ending 31 January), MNP’s NAV and share price total returns of +2.9% and -2.6% respectively lagged the benchmark’s +15.9% total return. However, to put this in context, in the three years to the end of January 2022, the trust’s NAV and share price total returns of +54.1% and +53.1% respectively modestly outperformed the benchmark’s 52.5% total return.
| One month | Three months | Six months | One year | Three years | Five years | 10 years | |
|---|---|---|---|---|---|---|---|
| Price relative to benchmark | (3.8) | (7.6) | (20.5) | (20.8) | (17.5) | (12.1) | (12.4) |
| NAV relative to benchmark | (2.6) | (8.3) | (20.1) | (19.9) | (15.5) | (11.4) | (19.4) |
| Price relative to MSCI AC World | (3.8) | (7.6) | (20.5) | (20.8) | (17.1) | (11.7) | (10.7) |
| NAV relative to MSCI AC World | (2.6) | (8.3) | (20.1) | (19.9) | (15.1) | (11.1) | (17.8) |
| Price relative to CBOE UK All Companies | (4.8) | (9.4) | (29.0) | (22.8) | (0.5) | 17.7 | 40.1 |
| NAV relative to CBOE UK All Companies | (3.5) | (10.1) | (28.7) | (22.0) | 2.0 | 18.6 | 29.0 |
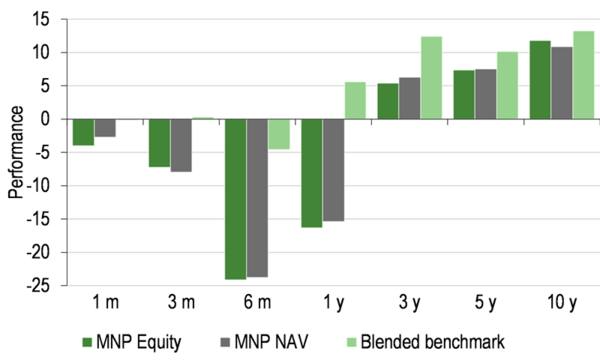
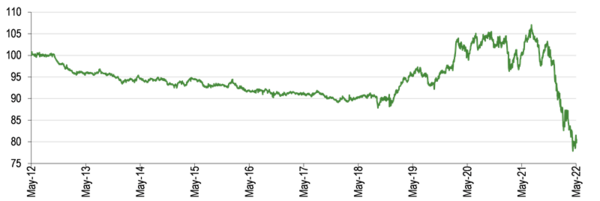
Unfortunately, a difficult period of relative performance over the last six months has negatively affected MNP’s long-term record, meaning that the trust now lags the benchmark over the last one, three, five and 10 years in both NAV and share price terms.
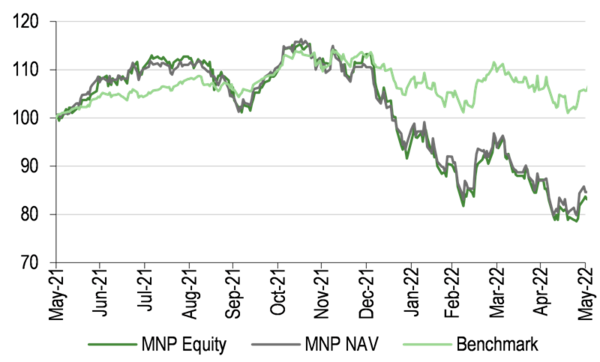
Exhibit 7a: Price, NAV and benchmark total return performance, one-year rebased[8]
Exhibit 7b: Price, NAV and benchmark total return performance (%)[8]
Osmani reports that he is ‘not happy’ with MNP’s relative performance over the last six months. The manager is aware of the headwinds facing Farfetch given its Chinese and Russian exposure; however, he sees a rapid pathway to this company reaching profitability. Osmani comments that Masimo is under scrutiny by the team. It is a healthcare company that develops, manufactures and markets a variety of non-invasive monitoring technologies. Its core business is the measurement of low perfusion arterial blood oxygen saturation and pulse rate monitoring, known as Masimo SET pulse oximetry. The manager says that Masimo is in a two-player market with Dutch conglomerate Philips. Being in a duopoly affords the company high returns and it is gaining around two-thirds of industry new orders due to its more innovative product offering. In Q122 Masimo announced the acquisition of Sound United, which is a leading consumer technology company and owner of multiple premium audio and home entertainment brands including Denon and Marantz. This deal changed the investment thesis for Masimo as it has acquired a non-healthcare business, while consumer electronics is deemed to be a very competitive sector. Investors were not impressed with this development and Masimo’s shares fell by around 37% when the deal was announced in February 2022. Although Osmani’s level of conviction in this position has declined, he considers the stock is oversold and Masimo remains in MNP’s portfolio. The manager does not expect the company to undertake further consumer transactions, while Sound United provides Masimo with a platform to distribute the combined company’s portfolio of consumer-facing healthcare products. The use of Bluetooth wireless technology in a hospital setting will be more efficient than Masimo’s wired products, which need to be removed when a patient goes to the bathroom. However, the manager would have preferred the company to in-licence rather than acquire the new technology.
Over the last six months, the largest detractors to MNP’s relative performance were: Masimo (medtech), Farfetch (luxury brands), NVIDIA (semiconductors, although Osmani has a higher level of conviction in the company’s long-term growth potential following a recent meeting), Kingspan (building materials) and Moncler (luxury brands). The largest positive contributors included industrial gas company Linde, which is still reaping efficiency benefits following its December 2016 acquisition of Praxair, and by not holding LVMH, SAP, Schneider and Siemens.
The manager highlights that MNP’s sector exposure has been detrimental so far in 2022 as the best performing sector is energy (+45%, the trust has no exposure), while the second worst performing sector is technology (-15%, MNP’s largest overweight exposure). The worst performing sector so far this year is consumer discretionary, which is home to the trust’s luxury goods holdings. MNP’s healthcare exposure is primarily in medtech, which has been placed in the same ‘bucket’ as IT stocks and has suffered in the market rotation from growth to value stocks. In addition, large pharma companies have outperformed and MNP is underweight.
Exhibit 8: NAV total return performance relative to benchmark over 10 years[9]
Peer group comparison edit edit source
MNP is one of the smaller funds in the 17-strong AIC Global sector. Along with other companies that employ a growth-focused strategy such as Manchester & London, Monks and Scottish Mortgage, MNP has had a tough period of performance over the last 12 months, which has also negatively affected its longer-term record. The trust’s NAV total return now ranks 12th, 13th, 11th and 12th over the last one, three, five and 10 years respectively. Nevertheless, its five-year NAV performance is above the sector average. MNP’s results have primarily been achieved without the use of gearing as the trust only drew down a new debt facility on 24 November 2020. On 29 June 2022, MNP had the fourth-highest valuation in the peer group. The trust has a below-average ongoing charge and level of net gearing that is above the mean. MNP’s focus on capital growth, rather than income, results in a below-average dividend yield.
| % unless stated | Market
cap £m |
NAV TR
1 year |
NAV TR
3 year |
NAV TR
5 year |
NAV TR
10 year |
Discount
(ex-par) |
Ongoing
charge |
Perf.
fee |
Net
gearing |
Dividend
yield |
|---|---|---|---|---|---|---|---|---|---|---|
| Martin Currie Global Portfolio | 248.4 | (24.5) | 8.2 | 37.7 | 170.5 | (2.1) | 0.7 | No | 112 | 1.4 |
| Alliance Trust | 2,745.6 | (7.5) | 21.7 | 41.4 | 185.0 | (5.6) | 0.6 | No | 106 | 2.6 |
| AVI Global Trust | 918.7 | (3.4) | 30.6 | 46.0 | 176.5 | (9.5) | 0.8 | No | 100 | 1.8 |
| Bankers | 1,294.1 | (5.9) | 20.7 | 43.8 | 204.0 | (7.7) | 0.5 | No | 108 | 2.2 |
| Blue Planet Investment Trust | 6.2 | (63.5) | (69.1) | (68.8) | (38.0) | (1.6) | 4.3 | No | 150 | 4.2 |
| Brunner | 417.1 | (0.9) | 26.7 | 46.1 | 182.1 | (10.9) | 0.6 | No | 107 | 2.2 |
| F&C Investment Trust | 4,251.1 | (3.2) | 25.9 | 49.7 | 220.7 | (9.3) | 0.5 | No | 107 | 1.6 |
| Global Opportunities Trust | 83.6 | 11.2 | 14.4 | 19.1 | 147.4 | (17.4) | 1.0 | No | 100 | 1.7 |
| JPMorgan Elect Managed Growth | 252.6 | (7.8) | 17.9 | 37.7 | 192.9 | (2.4) | 0.5 | No | 100 | 1.8 |
| Keystone Positive Change Inv | 111.3 | (33.1) | (36.0) | (37.3) | 16.7 | (16.7) | 0.5 | No | 111 | 6.2 |
| Lindsell Train | 210.5 | (11.0) | 15.1 | 89.3 | 469.8 | (4.1) | 0.8 | Yes | 100 | 5.0 |
| Manchester & London | 143.4 | (31.5) | (8.7) | 17.9 | 87.6 | (18.7) | 0.8 | Yes | 100 | 3.9 |
| Mid Wynd International Inv Trust | 461.8 | (7.1) | 30.0 | 63.6 | 244.9 | 1.1 | 0.6 | No | 100 | 1.0 |
| Monks | 2,118.0 | (26.8) | 17.3 | 48.6 | 199.8 | (9.6) | 0.4 | No | 108 | 0.2 |
| Scottish Investment Trust | 530.7 | 2.0 | 2.0 | 9.3 | 110.0 | (1.1) | 0.6 | No | 102 | 3.2 |
| Scottish Mortgage | 10,801.2 | (38.0) | 61.7 | 116.5 | 545.7 | (12.1) | 0.3 | No | 117 | 0.5 |
| Witan | 1,482.2 | (12.2) | 9.5 | 21.7 | 174.8 | (9.1) | 0.7 | Yes | 113 | 2.7 |
| Average (17 funds) | 1,533.9 | (15.5) | 11.0 | 34.3 | 193.6 | (8.0) | 0.8 | 108 | 2.5 | |
| MNP rank in peer group | 12 | 12 | 13 | 11 | 12 | 4 | 11 | 4 | 14 |
Dividends: Commitment to stable/progressive payouts edit edit source
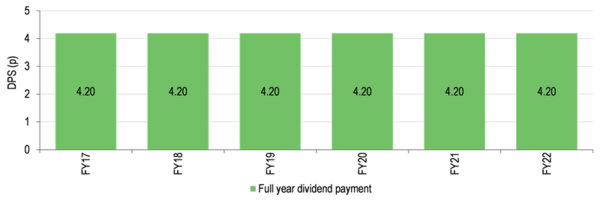
MNP pays quarterly dividends in July, October, January and April. For the last six financial years, the trust’s annual dividend has been steady at 4.20p per share. In FY22, MNP’s revenue per share was 1.36p, which was a 31.0% decline year-on-year, meaning the dividend was 0.3x covered. At the end of the period, the trust had revenue reserves of c £0.5m and special distributable reserves of c £76.3m, which in aggregate represent more than 20x the last annual distribution. At the June 2022 AGM a proposal was passed allowing the distribution of realised capital gains by way of dividends (MNP was already permitted to distribute realised capital gains in buying back its shares). However, the board has stated that there is no intention to change the current dividend policy. Based on its current share price, the trust offers a 1.4% dividend yield.
Exhibit 10: Dividend history since FY17[11]
Valuation: Zero-discount policy edit edit source
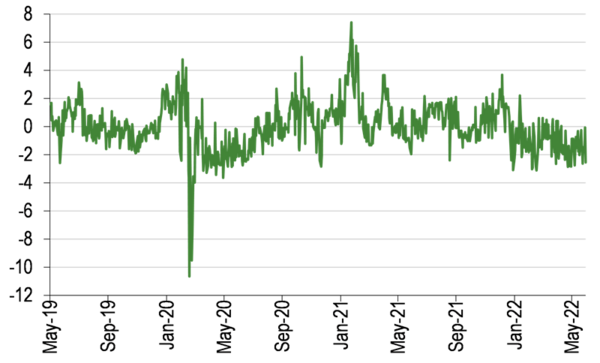
Exhibit 11: Discount over three years (%)[12]
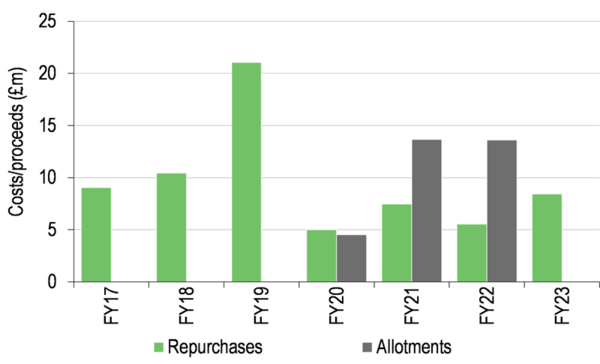
Exhibit 12: Buybacks and issuance[13]
MNP’s shares are trading at a 2.5% discount to cum-income NAV, which compares with a range of a 3.7% premium to a 3.1% discount over the last 12 months. Over the last one, three, five and 10 years, MNP has traded at average discounts of 0.2%, 0.0%, 0.3% and 0.9% respectively. The board has employed a zero-discount policy since 2013, aiming to ensure that, in normal market conditions, the trust’s shares trade close to NAV. Renewed annually, the trust has authority to repurchase up to 14.99% of its shares and allot up to 10% of its issued share capital in order to manage a discount or premium. In FY22, c 1.6m shares were repurchased (c 1.8% of the share base) at a cost of c £5.5m, while c 3.4m shares were reissued from treasury (c 4.0% of the share base) valued at c £13.6m.
Fund profile: High-conviction global equity portfolio edit edit source
Launched in March 1999, MNP is listed on the Main Market of the London Stock Exchange. Zehrid Osmani, who has 24 years of investment experience, has been lead manager since 1 October 2018. He was formerly a senior portfolio manager and head of European equities research at BlackRock, with a proven track record in fundamental research and unconstrained investment. He is head of Martin Currie’s global long-term unconstrained (GLTU) team.
Martin Currie is now a division of Franklin Templeton Investments following the acquisition of its former parent Legg Mason on 31 July 2020. The company maintains its autonomy and its investment philosophy and processes remain unchanged.
Since 1 February 2020, MNP’s objective has been to generate a total return in excess of the total return of the MSCI AC World Index (previously a capital return in excess of a less broad global index). The trust received shareholder approval at the June 2022 AGM to change its investment policy. This will not mean a change in the manager's approach to investing but will state more clearly the importance of ESG to MNP, which the board believes will further differentiate the company from other investment trusts and funds. The new investment policy also provides further clarity on risk mitigation and the use of gearing.
The prior investment policy was to predominantly invest in blue-chip equities with market caps above $3bn. These were primarily quality growth companies with superior share price appreciation potential based on attractive ROIC, balance sheet strength and ESG credentials. The portfolio was high conviction, typically with 25–40 stocks, held for the long term. Debt could be used to enhance shareholder returns.
The new investment policy is as follows:
- To invest predominantly in listed global equities of quality growth companies with superior share price appreciation potential, based on projected ROIC, balance sheet strength and sustainable business models.
- To manage a high-conviction portfolio with typically 25–40 positions, held for the long term.
- To spread risk via a portfolio that is diversified by type of company and sources of revenue. No more than 10% of total assets may be invested in a single stock.
- To fully integrate ESG criteria into fundamental analysis when assessing business models.
- To exclude investments identified through the manager’s proprietary ESG risk assessment as having a high level of sustainability or governance risk.
- To potentially use debt to enhance shareholder returns. Gearing will not exceed 20% of net assets at the time of drawdown.
- To not invest in other listed closed-end funds.
The board monitors MNP’s success via three key performance indicators:
- NAV performance versus the benchmark over a rolling three-year period – achieved in FY22, outperformance of 1.6% (albeit meaningfully lower than the 19.4% outperformance in the three years to the end of FY21).
- Top-third share price performance versus the peers in the AIC Global sector over a rolling three-year period – achieved in FY22, fifth out of 15 funds.
- Ongoing charges (excluding performance fees) of less than 0.70% per year – achieved in FY22, 0.68%.
Investment process: Three-step, bottom-up approach edit edit source
Osmani is head of Martin Currie’s 10-strong GLTU team and is supported by a wider group of more than 30 investment professionals who meet hundreds of companies every year. He aims to generate a total return above that of the MSCI AC World Index by focusing on high-quality, undervalued growth stocks with the potential to outperform consistently. The manager has an unconstrained, high-conviction approach and invests with a long-term, five- to 10-year horizon. At end-May 2022, there were 29 holdings in the portfolio. There is a systematic three-step investment process that builds conviction at each stage:
- Idea generation: the total universe of c 2,800 listed global stocks is screened down to an investible universe of c 500 companies and then a research pipeline of 90+ names is prioritised to identify companies with a combination of quality, sustainable growth and an attractive valuation. The GLTU team believes that companies that can generate a high and sustainable return on invested capital, above their weighted average cost of capital, can generate above-average total returns over the long term.
- Fundamental analysis is based on eight key criteria: industry analysis, a company’s growth drivers, returns, financial strength, accounting, corporate ethos, ESG profile and valuation. Businesses are assessed on a scale of 1 (lowest risk) to 5 (highest risk) across a wide range of measures. As part of the process there is a systematic risk assessment focusing on industry risks, company risks, governance and sustainability, and portfolio risks. A newer upgrade to this process is an assessment of a company’s workforce risk, looking at bottlenecks in the skilled labour force and the resulting risk of wage inflation. Companies considered for inclusion in the portfolio are likely to have a dominant position and pricing power in a market with high barriers to entry. The manager seeks businesses with structural growth prospects, high returns on invested capital, strong cash flow generation and a quality management team with a strong corporate culture. To ensure a consistent approach, a proprietary research template is compiled for companies reviewed, and each is given a conviction rating between 1 (strong buy) and 5 (sell).
- Portfolio construction: each position is weighted appropriately, aiming to ensure a meaningful contribution to the fund’s returns. Osmani and his team break down the portfolio by geographic revenue and profit rather than where a company is listed, to understand the fund’s exposure by economic value (it is overweight developed and underweight emerging markets). The portfolio is also assessed in terms of end-user exposure at a tier one level – the consumer, business and government – and then at a more detailed tier two level focusing on individual sectors and industries. Stocks may be sold when they have reached their price target, if they are nearing their price target and there are better risk/reward opportunities elsewhere, or if the high-conviction investment case no longer holds true.
MNP’s portfolio has a high active share (98.4% at end-May 2022); this is a measure of how a fund differs from its benchmark, with 0% representing full index replication and 100% showing no commonality. Compared with the MSCI AC World Index, in aggregate, the trust’s holdings have higher forecast revenue, earnings and dividend growth, and higher valuations in terms of forward P/E and EV/EBITDA multiples. The portfolio has a higher ROIC and a stronger balance sheet compared with the index. These relative metrics reflect MNP’s biases towards growth and high-quality companies with pricing power. Portfolio turnover is typically up to 20% pa, implying a holding period of around five years.
The portfolio reflects three overarching themes, which Osmani believes will span multiple decades and should be amplified in a post-pandemic world: the future of technology, demographic change and resource scarcity. Within these, he sees a wealth of investment opportunities including increased infrastructure spending, such as on 5G networks, healthcare and railways; green initiatives including renewable energy and electric vehicles; robotics and automation; increased demand for cloud computing and online services; and cyber security.
The manager says that the GLTU team’s approach is to keep in constant touch with portfolio companies, along with other relevant contacts, thereby gaining deeper knowledge. He highlights that the group has great access to senior managers despite having a relatively modest amount of assets under management. Osmani reports that the team participated in 495 company meetings and around 220 earnings calls in 2021.
MNP’s approach to ESG edit edit source
ESG factors have been an integral part of MNP’s investment process for many years. Martin Currie has held a United Nations triple A+ rating for the last five years for strategy and governance, incorporation and active ownership, which are the three categories in the United Nations Principles for Responsible Investment (UN PRI). The company first became a UN PRI signatory in July 2009.
Martin Currie believes that good ESG practices are a fundamental component of a high-quality company. Factors considered by Osmani and his team typically include shareholder rights, accounting standards, remuneration, board structure, supply chain, data protection, pollution/hazardous waste policies, water usage and climate change policies. Their findings may influence important financial assumptions about a company, such as its cost of capital, revenues or costs, and therefore an estimate of its intrinsic value; a poor ESG track record may indicate wider sustainability issues within a firm. Osmani strongly believes that including ESG analysis in investment decisions delivers improved returns for MNP’s shareholders. On a practical level the manager and his team evaluate, measure and risk assess 60 individual areas for every company that they research. They also focus on an additional 20 assessments related to social exploitation risk, including criteria that examine the countries in which the company operates, the supply chain, gender/age/racial exploitation and working conditions, alongside the firm’s overall momentum in tackling social exploitation.
Exhibit 13a: MNP’s ESG metrics for FY22: Engagement topics[14]

| Scope 1 and 2* | Weighted average carbon intensity** | Coverage (%)*** |
| Portfolio | 91.3 | 98.3 |
| MSCI World Index | 157.5 | 99.9 |
Osmani says that 2021 was a busy year of ongoing engagements with investee companies; a breakdown of topics is shown in Exhibit 13 (left-hand side). On the governance side, the manager and his team continued to convey their stance on remuneration policy in a year of recovery from the challenging 2020 corporate profits environment. While on the environmental and social topics, the team has continued to engage with companies as part of its assessment of social exploitation risks and has been assessing firms’ carbon emissions in more detail (Exhibit 13, right-hand side). Osmani notes that many companies have increased their focus on reducing their carbon emissions and brought in more targets within their corporate agendas. The manager and his team are developing metrics to measure MNP’s carbon footprint; while the data is not yet complete, an indication of the portfolio’s carbon footprint highlights its significantly lower carbon footprint compared with the benchmark’s.
Gearing edit edit source
MNP historically had not employed gearing since 2008, although up to 20% of NAV is permitted. However, on 23 November 2020 the board announced that it had entered into a £30m three-year unsecured sterling term loan facility with Royal Bank of Scotland International. This was fully drawn down the following day at a fixed interest rate of 1.181% pa and equated to c 10% of MNP’s NAV. The board is confident that the manager can generate annual returns above the trust’s modest cost of debt over the long term, meaning that the use of gearing should contribute positively to MNP’s results. At end-May 2022, net gearing was 11.0%.
Fees and charges edit edit source
With effect from 1 February 2021, MNP’s performance fee was discontinued and the investment management fee was changed to 0.50% per year on the first £300m of ex-income NAV and 0.35% of ex-income NAV above this level (previously a flat fee of 0.40%), calculated and payable quarterly. In FY22, MNP’s ongoing charges were 0.68%, which was 10bp higher than 0.58% in FY21 (1.62% including a performance fee).
Capital structure edit edit source
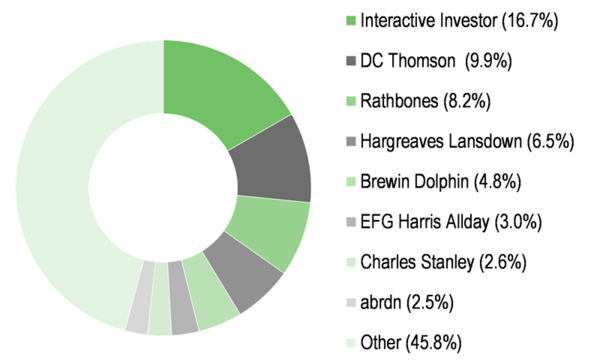
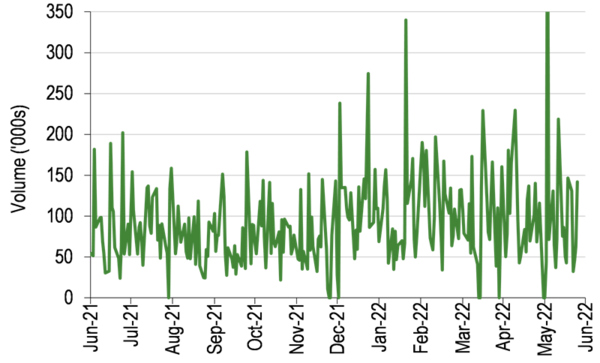
MNP is a conventional investment trust with one class of share – there are c 83.9m ordinary shares in issue, with a further c 14.8m held in treasury. At end-FY22, the trust’s equity capital was split as followed: 75.8% banks and nominee companies, 11.2% individuals and trustees and 13.0% other holders. Over the last year, MNP’s average daily trading volume was c 94k shares.
Exhibit 14: Major shareholders[15]
Exhibit 15: Average daily volume[16]
The board edit edit source
| Board member | Date of appointment | Remuneration in FY22 | Shareholdings at end-FY22 |
|---|---|---|---|
| Gillian Watson (chairman since 1 February 2021) | 1 April 2013 | £40,000 | 3,329 |
| Gary Le Sueur | 1 December 2016 | £26,500 | 31,735 |
| Marian Glen | 1 December 2016 | £33,000 | Nil |
| Christopher Metcalfe | 19 September 2019 | £26,500 | 8,600 |
| Lindsay Dodsworth | 1 November 2021 | £6,625 | 2,542 |
References edit edit source
- ↑ Source: Refinitiv, Edison Investment Research.
- ↑ 2.0 2.1 Source: Refinitiv, Edison Investment Research.
- ↑ Source: MNP, Edison Investment Research. Note: *N/A where not in end-May 2021 top 10.
- ↑ Source: MNP, Edison Investment Research. Note: Adjusted for gearing and cash. Numbers subject to rounding.
- ↑ Source: MNP, Edison Investment Research. Note: Adjusted for gearing and cash. Numbers subject to rounding.
- ↑ Source: Refinitiv. Note: All % on a total return basis in pounds sterling. *MSCI AC World since 1 February 2020, previously a less broad global index.
- ↑ Source: Refinitiv, Edison Investment Research. Note: Data to end-May 2022. Geometric calculation. Note: Benchmark is MSCI AC World since 1 February 2020, previously a less broad global index.
- ↑ 8.0 8.1 Source: Refinitiv, Edison Investment Research. Note: Three-, five- and 10-year performance figures annualised.
- ↑ Source: Refinitiv, Edison Investment Research.
- ↑ Source: Morningstar, Edison Investment Research. Note: *Performance data to 28 June 2022 based on ex-par NAV. TR = total return. Net gearing is total assets less cash and equivalents as a percentage of net assets (100 = ungeared).
- ↑ Source: Bloomberg, Edison Investment Research.
- ↑ Source: Refinitiv, Edison Investment Research.
- ↑ Source: Morningstar, Edison Investment Research.
- ↑ 14.0 14.1 Source: MNP, MSCI, Edison Investment Research.
- ↑ Source: Bloomberg. Note: At 31 May 2022.
- ↑ Source: Refinitiv. Note: 12 months to 29 June 2022.
- ↑ Source: MNP.

