Novo Nordisk A/S
Summary Presentation edit edit source
Idea edit edit source
Novo Nordisk A/S, a healthcare company, engages in the research, development, manufacture, and marketing of pharmaceutical products worldwide. It operates in two segments, Diabetes and Obesity care, and rare diseases (biopharmaceuticals). The Diabetes and Obesity care segment provides products in the areas of insulins, GLP-1 and related delivery systems, oral antidiabetic products, obesity, and other chronic diseases. The Biopharmaceuticals segment offers products in the areas of haemophilia, growth disorders, and hormone replacement therapy. The company collaboration agreements with Gilead Sciences, Inc. Novo Nordisk A/S also has a research collaboration with Lumen Bioscience, Inc. to explore strategies for delivering oral biologics for cardiometabolic disease. The company was founded in 1923 and is headquartered in Bagsvaerd, Denmark.[1]
Novo Nordisk was founded in 1923 by two Danish brothers, August and Harald Krogh, with the idea of developing and manufacturing insulin for people with diabetes. The company has since grown to become the world's largest insulin producer, responsible for 50% of the world supply, and a leading developer of treatments for other serious chronic diseases, including obesity, haemophilia, and growth disorders.
Mission Statement
Novo Nordisk's mission is to "drive change to defeat serious chronic diseases." The company does this by pioneering scientific breakthroughs, expanding access to its medicines, and working to prevent and ultimately cure the diseases it treats.
Segments & Key Projects edit edit source
Novo Nordisk operates in three segments:
Diabetes and Obesity care: This segment accounted for 87% of Novo Nordisk's revenue in 2022. The company's diabetes products include insulin, GLP-1 agonists, and oral antidiabetics. Novo Nordisk is the world's leading diabetes care company, with a market share of over 30%.[2]
Biopharmaceutical: This segment accounted for 13% of Novo Nordisk's revenue in 2022. The company's biopharm products treat rare blood disorders, rare endocrine disorders, and hormone replacement therapy. Novo Nordisk is a leading company in the rare disease space, with a market share of over 20%.[2]
Breakdown of Novo Nordisk's revenue by segment in 2022: [3]
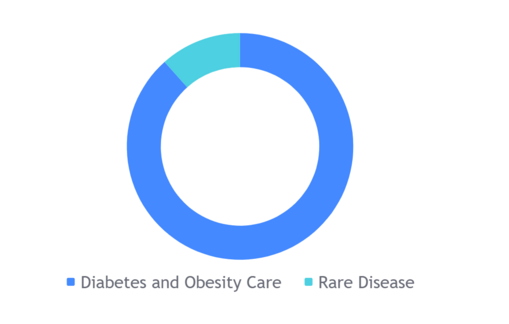
Diabetes and Obesity care:
- Insulin: $139.5 billion (63%)
- GLP-1 agonists: $40.5 billion (16%)
- Oral antidiabetics: $20.5 billion (9%)
Biopharmaceutical:
- Rare blood disorders: $11.5 billion (5%)
- Rare endocrine disorders: $5.5 billion (2%)
- Hormone replacement therapy: $1.5 billion (1%)
Novo Nordisk's net profit in 2022 was DKK 55.5 billion (US$8.2 billion). The company's strong revenue growth in 2022 was driven by the continued growth of its diabetes products, particularly its GLP-1 agonists. Novo Nordisk also benefited from the launch of its new obesity drug, Wegovy.
Revenue Breakdown by Sector[3]
In 2022, Novo Nordisk's revenue breakdown by sector was as follows:
- Diabetes Care: 64%
- Obesity & Metabolism: 20%
- Biopharmaceuticals: 16%
Novo Nordisk's revenue in 2022 came from the following global markets:[3]
- North America: This region accounted for 54% of Novo Nordisk's revenue in 2022. The United States is Novo Nordisk's largest market, accounting for 40% of the company's total revenue.
- Europe: This region accounted for 29% of Novo Nordisk's revenue in 2022. Germany, France, and Italy are Novo Nordisk's largest markets in Europe.
- China: This region accounted for 9% of Novo Nordisk's revenue in 2022. China is the fastest growing market for Novo Nordisk, and the company expects to see continued growth in this market in the coming years.
- Other markets: This region accounted for 8% of Novo Nordisk's revenue in 2022. This includes markets such as Japan, Brazil, and India.
Detailed breakdown of Novo Nordisk's revenue by market in 2022:
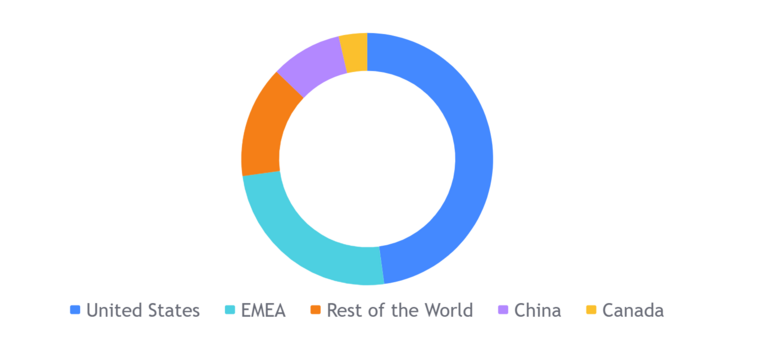
- North America:
- United States: $90.6 billion (33%)
- Canada: $10.5 billion (4%)
- Europe:
- Germany: $23.2 billion (9%)
- France: $19.2 billion (8%)
- Italy: $16.5 billion (7%)
- China: $15.7 billion (6%)
- Other markets:
- Japan: $10.2 billion (4%)
- Brazil: $7.5 billion (3%)
- India: $5.8 billion (2%)
Projects edit edit source
Novo Nordisk has a number of projects in development in the areas of diabetes, obesity, rare diseases, and growth hormone. Some of the most notable projects include:
Currently in development
Semaglutide injection pen
This is a new formulation of Novo Nordisk's flagship diabetes drug, Ozempic. The injection pen is designed to be easier to use and more convenient for patients.[4]
TT-003
This is a new drug for the treatment of obesity. TT-003 is a combination of two drugs, semaglutide and exenatide. TT-003 is currently in Phase 3 clinical trials.[5]
NN9031
This is a new drug for the treatment of type 1 diabetes. NN9031 is a long-acting insulin that is designed to be more effective and less likely to cause hypoglycaemia than current insulin therapies. NN9031 is currently in Phase 2 clinical trials.
NSG005
This is a new drug for the treatment of growth hormone deficiency. NSG005 is a long-acting growth hormone that is designed to be more effective and less likely to cause side effects than current growth hormone therapies. NSG005 is currently in Phase 3 clinical trials.[6]
In addition to these projects, Novo Nordisk is also developing a number of other drugs and technologies for the treatment of diabetes, obesity, rare diseases, and growth hormone. The company is committed to continuous innovation, and is always looking for new ways to improve the lives of patients.
Most successful products
- Ozempic: This is a once-weekly injection for the treatment of type 2 diabetes. Ozempic is a GLP-1 agonist, a type of drug that helps to control blood sugar levels by mimicking the effects of the hormone glucagon-like peptide-1. Ozempic was approved by the FDA in 2017, and has since become one of Novo Nordisk's top-selling drugs.[7]
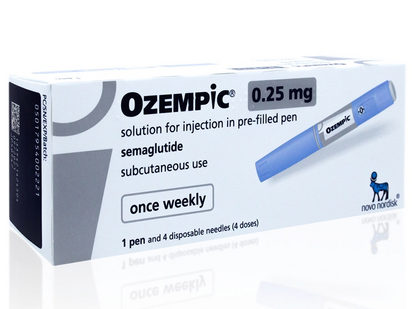
- Rybelsus: This is a once-daily pill for the treatment of type 2 diabetes. Rybelsus is also a GLP-1 agonist, and was approved by the FDA in 2019. Rybelsus is the first GLP-1 agonist that can be taken once daily, and has been shown to be effective in controlling blood sugar levels.[8]
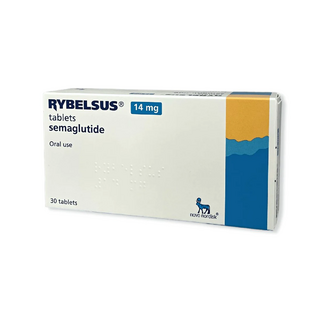
- Wegovy: This is a once-weekly injection for the treatment of obesity. Wegovy is also a GLP-1 agonist, and was approved by the FDA in 2021. Wegovy is the first GLP-1 agonist that has been shown to be effective in helping people lose weight, and has been shown to be safe and well-tolerated.[9]
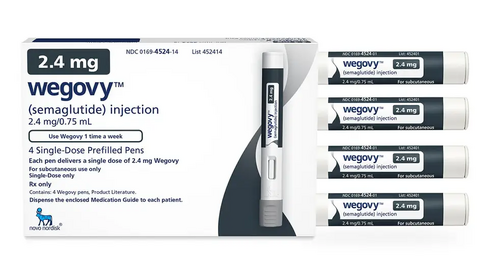
Novo Nordisk is a leading global pharmaceutical company with a strong track record of innovation. The company is committed to finding new and innovative ways to treat diabetes, obesity, rare diseases, and growth hormone. Novo Nordisk is also committed to making its products more affordable and accessible to patients around the world.
Leadership edit edit source
The company is led by an executive management team of 11 people, and a separate board of directors consisting of 12 people.
Key leadership figures:
Chief Executive Officer
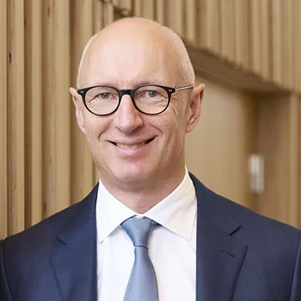
Novo Nordisk is led by Lars Fruergaard Jørgensen, who has been the company's CEO since 2017. Mr Jørgensen joined Novo Nordisk in 1991 as an economist in Health Care, Economy & Planning and has over the years completed overseas postings in the Netherlands, the US and Japan. In 2004 he was appointed senior vice president for IT & Corporate Development. In January 2013 he was appointed executive vice president and chief information officer assuming responsibility for IT, Quality & Corporate Development. In November 2014 he took over the responsibilities for Corporate People & Organisation and Business Assurance and became chief of staff. Mr Jørgensen was appointed president and chief executive officer in January 2017. Mr Jørgensen also serves as first vice-president of the European Federation of Pharmaceutical Industries and Associations (EFPIA). He holds an MSc in Finance and Business Administration from Aarhaus School of Business, Denmark.
Chief Financial Officer
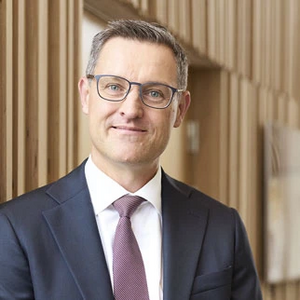
Karsten Munk Knudsen joined Novo Nordisk in 1999 as a business analyst in NNIT A/S, previously a subsidiary of Novo Nordisk, and has since held finance positions of growing size and complexity throughout the Novo Nordisk value chain. From 2010 to 2014 Mr Knudsen was corporate vice president for Finance & IT at Novo Nordisk Inc. in the US and in 2014 he was appointed senior vice president of Corporate Finance in Novo Nordisk. In February 2018 Mr Knudsen was promoted to executive vice president and chief financial officer. In 2019, Mr Knudsen assumed further responsibilities as his area was expanded to cover Finance, Legal & Procurement followed by a further expansion in 2022 when he assumed responsibility for Global Solutions. Mr Knudsen also serves as chair of the board of directors of NNE A/S and as a member of the board of directors of Hempel A/S, both in Denmark. He holds an MSc in Finance from the University of Aarhaus, Denmark.
Chief Scientific Officer
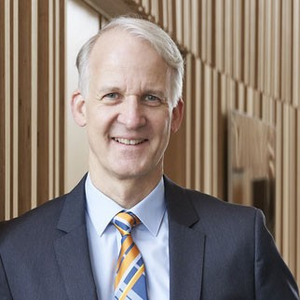
Dr Marcus Schindler joined Novo Nordisk in January 2018 as senior vice president for External Innovation and Strategy. From March 2018 to 2021 he was senior vice president for Global Drug Discovery and in March 2021 Dr Schindler was appointed executive vice president for Research & Early Development and chief scientific officer. Prior to joining Novo Nordisk Dr Schindler was vice president, head of cardiovascular and metabolic diseases innovative medicines (CVMD iMed) at AstraZeneca, Sweden. From 2009-2012 he was head of research at (OSI) Prosidion, Oxford, UK. From 2000-2008 he worked in various leadership roles at Boehringer Ingelheim, Germany after having started his career with Glaxo Wellcome/GSK, UK in 1997. Dr Schindler holds a PhD from the University of Cambridge, UK. He is also an adjunct professor of Pharmacology at the University of Gothenburg, Sweden.
Executive VP, North America Operations Head
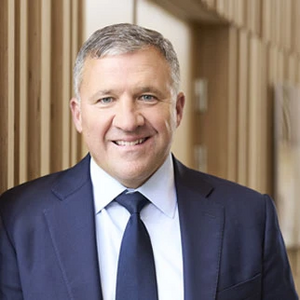
Mr Doug Langa joined Novo Nordisk in 2011 as senior director of Managed Markets. In 2015 Mr Langa was promoted to corporate vice president of Market Access in the US and in 2016 he was appointed senior vice president of Market Access in the US. In March 2017 Mr Langa was appointed senior vice president, head of North America Operations and president of Novo Nordisk Inc., and in August 2017 Mr Langa was promoted to executive vice president, continuing his responsibilities as head of North America Operations and president of Novo Nordisk Inc. Mr. Langa represents Novo Nordisk Inc. on the board of directors of the trade association PhRMA. Mr Langa joined Novo Nordisk from GlaxoSmithKline, where he was the senior director of payer marketing. Prior to GlaxoSmithKline Mr Langa spent the majority of his career at Johnson and Johnson, where he held various roles of increasing responsibility within managed markets, sales leadership and marketing. He holds professional certificates from Harvard Business School, Wharton School of Business, and an MBA from Fordham University.
Chair of Board of Directors
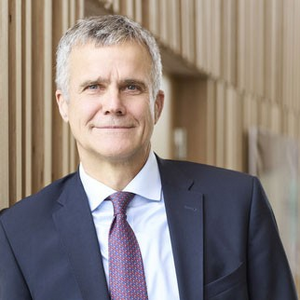
Mr Helge Lund is the Chair of the Board of Directors, the Chair Committee and the Nomination Committee of Novo Nordisk. Mr Helge was first elected to the position in 2017, and has recently been re-elected in 2023 to serve for another year. He has been a member of the board of directors since 2014. Mr Helge has previously served as Chief executive of BG Group plc., 2015-2016, President and CEO of Equinor ASA, 2004-2014, and President and CEO of Aker Kvaerner ASA, 2002-2004. Mr Helge currently also holds positions as Chair of the board of directors of BP p.l.c. and Inkerman AS, Member of the board of directors of Belron SA and P/F Tjaldur, Operating advisor to Clayton Dubilier & Rice, and Member of the board of trustees of the International Crisis Group. He holds an MBA from INSEAD, and MA in Economics from the Norwegian School of Economics and Business Administration.
Executive VP, Commercial Strategy & Corporate Affairs.
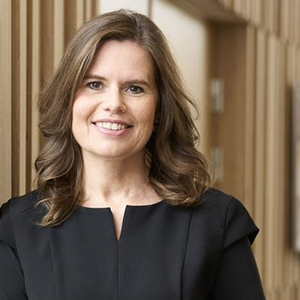
Ms Sylvest joined Novo Nordisk in 1996 as trainee. From 1997 to 2008 Ms Sylvest had roles in headquarters and regions within pricing, health economics, marketing and sales effectiveness. In 2003, she was appointed vice president of sales and marketing effectiveness in Region Europe. From 2008 to 2015 Ms Sylvest headed up affiliates and business areas of growing size and complexity in Europe and Asia and in 2013 she was also appointed corporate vice president. In August 2015 Ms Sylvest was appointed senior vice president and general manager of Novo Nordisk’s Region China. In this role she was responsible for the company’s activities in the mainland, Taiwan and Hong Kong of China. In October 2017 Ms Sylvest was promoted to executive vice president for Commercial Strategy & Corporate Affairs. She also serves as vice chair of the board of directors of Danish Crown A/S, in Denmark and as member of the board of directors of Argenx SE, in the Netherlands.
Ownership Structure[10] edit edit source
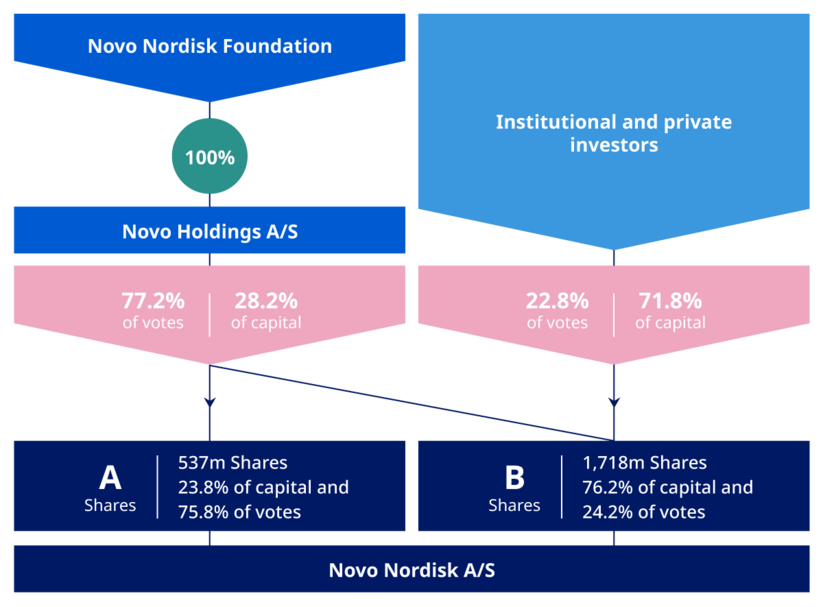
Novo Nordisk is a publicly traded company on the New York Stock Exchange and is part of the NASDAQ Copenhagen. The largest shareholder is Novo Holdings A/S, a Danish investment company that is owned by the families of the company's founders. Novo Holdings owns approximately 28% of Novo Nordisk's shares.
As of 9 May 2023, the A shares held by Novo Holdings A/S represented 23.8% of the total share capital and 75.8% of the total votes of Novo Nordisk. In addition, the B shares held by Novo Holdings A/S represented 4.4% of the total share capital and 1.4% of the total votes. In total, as of 9 May 2023 Novo Holdings A/S’ ownership amounted to 28.2% of share capital and 77.2% of votes of Novo Nordisk. Treasury shares are included in the above, however voting rights of treasury shares cannot be exercised.
Novo Holdings A/S is wholly owned by the Novo Nordisk Foundation. The Novo Nordisk Foundation has a dual objective: to provide a stable basis for the commercial and research activities conducted by the companies within the Novo Group (of which Novo Nordisk A/S is that largest) and to support scientific, humanitarian, and social purposes.
Novo Nordisk is not aware of the existence of any agreements between shareholders on the exercise of votes or control.
The stake held by Board members and employees cannot be determined exactly. However, Novo Nordisk estimated that as of January 31, 2023, the B shares held by Novo Nordisk’s Board members and employees represented less than 1% of the beneficial ownership of the Company.
Novo Nordisk’s share capital is DKK 451,000,000, which is divided into an A share capital of nominally DKK 107,487,200 and a B share capital of nominally DKK 343,512,800.
All A shares are held by Novo Holdings A/S, a Danish private limited liability company wholly-owned by the Danish self-governing foundation, the Novo Nordisk Foundation. Please see further information in “Ownership Structure”.
The A shares are not listed but are in principle transferable. However, according to the Articles of Association of the Novo Nordisk Foundation, the A shares cannot be divested by Novo Holdings A/S or the Foundation.
The B shares are listed on Nasdaq Copenhagen under the ticker “NOVO B” and on the New York Stock Exchange (NYSE) as American Depository Receipts (ADRs) under the ticker “NVO” and are fully transferable.
Each A share of DKK 0.01 carries 10 votes, whereas each B share of DKK 0.01 carries one vote. Thus, each B share of DKK 0.2 (the present denomination of the company's shares) carries 20 votes and each A share of DKK 0.2 carries 200 votes.
The current differentiation of voting rights cannot be revoked, as this would violate the Articles of Association of the Novo Nordisk Foundation, which have been approved by the Danish Foundation Authority.
On 2 January 2014 the B shares were split in a five-for-one ratio and the trading unit of the B shares listed on Nasdaq Copenhagen was changed from DKK 1 to DKK 0.2. On 9 January 2014, each of Novo Nordisk’s American Depository Receipts (ADRs) listed on New York Stock Exchange was also split in a five-for-one ratio. Hence, the ratio of B shares to ADRs listed on the New York Stock Exchange remains 1:1.[10]
Corporate Strategy edit edit source
Novo Nordisk's corporate strategy is focused on three main pillars:[11]
- Drive change to defeat diabetes and other serious chronic diseases: Novo Nordisk is committed to finding new and innovative ways to treat diabetes and other chronic diseases. The company is investing heavily in research and development, and is focused on developing new products that can improve the lives of patients.
- Pioneer scientific breakthroughs and expand access to medicines: Novo Nordisk is also committed to pioneering scientific breakthroughs and expanding access to medicines. The company is working to make its products more affordable and accessible to patients around the world.
- Work to prevent, and ultimately cure, these diseases: Novo Nordisk is also committed to working to prevent, and ultimately cure, diabetes and other chronic diseases. The company is investing in research into new prevention strategies, and is working to develop new technologies that can help to cure these diseases.
In order to achieve its corporate strategy, Novo Nordisk is focused on the following key areas:
- Innovation: Novo Nordisk is committed to continuous innovation, and is investing heavily in research and development. The company has a strong track record of innovation, and has launched a number of breakthrough products in recent years.
- Global reach: Novo Nordisk has a global reach, with operations in over 70 countries. This allows the company to reach patients around the world, and to address the growing burden of diabetes and other chronic diseases.
- Sustainability: Novo Nordisk is committed to sustainability, and is working to reduce its environmental impact. The company has set ambitious targets for reducing its carbon emissions, and is working to make its operations more sustainable.
Novo Nordisk is a leading global pharmaceutical company, and its corporate strategy is focused on addressing the growing burden of diabetes and other chronic diseases. The company is committed to innovation, global reach, and sustainability, and is working to make its products more affordable and accessible to patients around the world.
Risks edit edit source
Risks of operations, competitors and other:
Diversification in products
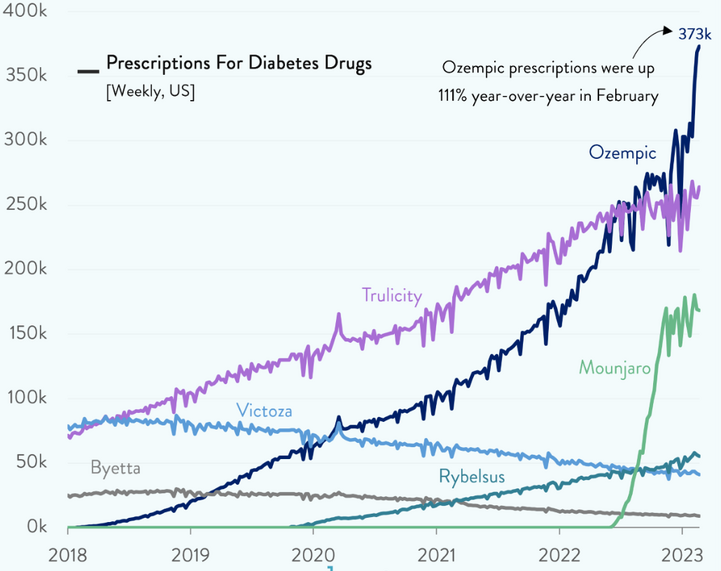
The 3 main products produced by Novo Nordisk all contain the same active ingredient which is Semaglutide. This represents 88% of their revenue from segments of obesity and diabetes drugs, excluding their Insulin products. Semaglutide is patented and was produced by Novo Nordisk in 2012, meaning it is relatively new in terms of medical data. It is FDA approved and approved by governing medical bodies however data is still being collected and trials are still being run as per standards. There is data to show that GLP-1s increase the risk of Thyroid cancer and possibly other types of cancers, and can also cause side effects such as pancreatitis which can lead to hospitalisation and death (although in rare cases). in this perspective Novo Nordisk is not a very well diversified business and may be at risk if Semaglutide is adversely affected or if superior compounds are produced by competitors.[12]
Risk from competition
Eli Lilly, the main competitor of Novo Nordisk and american pharmaceutical giant, is currently in the very late stages of developing and seeking approval of the drug Woujaro which is a direct competitor (Tirzepatide). Tirzepatide is currently only authorised for use for Type 2 Diabetes but will likely soon be approved for weight loss purposes as well. This has also shown to be more effective than Ozempic for weight loss in studies from the worlds leading scientific journal, the New England Journal of Medicine. Studies have shown that Ozempic can lead to weight loss of up to 17% body weight and Wegovy up to 18%, whereas Tirzepatide (Mounjaro) has been shown to reduce body weight of up to 23%. Other next generation weight loss drugs are also in development currently by biotech companies such as Versanis who are developing bimagrumab - a drug that promises to maximise fat loss whilst maintaining muscle mass. These medications are expected to come to market within the medium term (~5 years).[12]
Supply chain issues
Novo Nordisk has found it difficult to cope with the demand rising so fast for their drugs, with many patients unable to access them. Wegovy was on the market for roughly 6 months before the company announced that they had a short supply at the end of 2021. Both drugs were on the FDA’s list of medications under shortage. The company has since increased capital expenditures and invested into its operations heavily to ensure that this does not happen again.[13]
Controversial use of medications
Ozempic is not actually approved for weight loss, so tighter regulatory changes could lead to a drop in demand - Under the terms of their approvals, neither drug, Ozempic or Wegovy, should be taken for casual weight loss. This has however become a trend as demand has soared in the last 2 years following celebrity endorsements by the likes of Elon Musk and the Kardashians. Ozempic has been termed the ‘Hollywood Drug’ as a result of this.[14]
Compounding (legal conflicts)
Medical spas, and clinics were found selling custom made versions of Semaglutide, Novo Nordisk has several lawsuits currently in motion to tackle this issue.[15]
Financials edit edit source
| Year | 2022 | 2021 | 2020 | 2019 | 2018 | 2017 | 2016 | 2015 | 2014 |
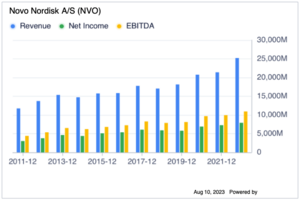
| Revenue | 176,954 | 140,800 | 126,946 | 122,021 | 111,831 | 111,696 | 111,780 | 107,927 | 88,806 |
| Revenue Growth (YoY) | 25.68% | 10.91% | 4.04% | 9.11% | 0.12% | -0.08% | 3.57% | 21.53% | - |
| Cost of Revenue | 28,448 | 23,658 | 20,932 | 20,088 | 17,617 | 17,632 | 17,183 | 16,188 | 14,562 |
| Gross Profit | 148,506 | 117,142 | 106,014 | 101,933 | 94,214 | 94,064 | 94,597 | 91,739 | 74,244 |
| Selling, General & Admin | 50,684 | 41,058 | 36,886 | 35,830 | 33,313 | 32,124 | 32,339 | 32,169 | 26,760 |
| Research & Development | 24,047 | 17,772 | 15,462 | 14,220 | 14,805 | 14,014 | 14,563 | 13,608 | 13,762 |
| Other Operating Expenses | -1,034 | -332 | -460 | -600 | -1,152 | -1,041 | -737 | -3,482 | 770 |
| Operating Expenses | 73,697 | 58,498 | 51,888 | 49,450 | 46,966 | 45,097 | 46,165 | 42,295 | 41,292 |
| Operating Income | 74,809 | 58,644 | 54,126 | 52,483 | 47,248 | 48,967 | 48,432 | 49,444 | 32,952 |
| Interest Expense / Income | 5,986 | 2,451 | 2,624 | 3,995 | 1,755 | 1,533 | 726 | 6,046 | 563 |
| Other Expense / Income | -239 | -2,887 | -1,628 | -65 | -2,122 | -1,246 | -92 | -85 | -1,707 |
| Pretax Income | 69,062 | 59,080 | 53,130 | 48,553 | 47,615 | 48,680 | 47,798 | 43,483 | 34,096 |
| Income Tax | 13,537 | 11,323 | 10,992 | 9,602 | 8,987 | 10,550 | 9,873 | 8,623 | 7,615 |
| Net Income | 55,525 | 47,757 | 42,138 | 38,951 | 38,628 | 38,130 | 37,925 | 34,860 | 26,481 |
| Net Income Growth | 16.27% | 13.33% | 8.18% | 0.84% | 1.31% | 0.54% | 8.79% | 31.64% | - |
| Shares Outstanding (Basic) | 2,262 | 2,292 | 2,358 | 2,450 | 2,500 | 2,550 | 2,600 | 2,597 | - |
| Shares Change | -1.32% | -2.80% | -3.76% | -2.00% | -1.96% | -1.92% | 0.13% | - | - |
| EPS (Basic) | 24.51 | 20.79 | 18.05 | 16.41 | 15.96 | 15.42 | 14.99 | 13.56 | 10.1 |
| EPS (Diluted) | 24.44 | 20.74 | 18.01 | 16.38 | 15.93 | 15.39 | 14.96 | 13.52 | 10.07 |
| EPS Growth | 17.84% | 15.16% | 9.95% | 2.82% | 3.51% | 2.87% | 10.65% | 34.26% | - |
| Free Cash Flow Per Share | 29.51 | 21.23 | 19.57 | 15.45 | 14 | 13.16 | 15.87 | 12.74 | - |
| Dividend Per Share | 1.62 | 1.506 | 1.305 | 1.015 | 1.045 | 0.81 | 1.411 | 0.555 | 0.839 |
| Dividend Growth | 7.57% | 15.40% | 28.57% | -2.87% | 29.01% | -42.59% | 154.23% | -33.85% | - |
| Gross Margin | 83.92% | 83.20% | 83.51% | 83.54% | 84.25% | 84.21% | 84.63% | 85.00% | 83.60% |
| Operating Margin | 42.28% | 41.65% | 42.64% | 43.01% | 42.25% | 43.84% | 43.33% | 45.81% | 37.11% |
| Profit Margin | 31.38% | 33.92% | 33.19% | 31.92% | 34.54% | 34.14% | 33.93% | 32.30% | 29.82% |
| Free Cash Flow Margin | 37.72% | 34.56% | 36.34% | 31.02% | 31.29% | 30.04% | 36.91% | 30.65% | 31.20% |
| Effective Tax Rate | 19.60% | 19.17% | 20.69% | 19.78% | 18.87% | 21.67% | 20.66% | 19.83% | 22.33% |
| EBITDA | 82,410 | 67,556 | 61,507 | 58,209 | 53,295 | 53,395 | 51,717 | 52,488 | 38,094 |
| EBITDA Margin | 46.57% | 47.98% | 48.45% | 47.70% | 47.66% | 47.80% | 46.27% | 48.63% | 42.90% |
| Depreciation & Amortization | 7,362 | 6,025 | 5,753 | 5,661 | 3,925 | 3,182 | 3,193 | 2,959 | 3,435 |
| EBIT | 75,048 | 61,531 | 55,754 | 52,548 | 49,370 | 50,213 | 48,524 | 49,529 | 34,659 |
| EBIT Margin | 42.41% | 43.70% | 43.92% | 43.06% | 44.15% | 44.96% | 43.41% | 45.89% | 39.03% |
Valuation edit edit source

DCF Valuation: edit edit source
| Unlevered Free Cash Flow (mn) | ||||||||||
| Fiscal Year | 2018A | 2019A | 2020A | 2021A | 2022A | 2023E | 2024E | 2025E | 2026E | 2027E |
| Revenue | 111,831 | 122,021 | 126,946 | 140,800 | 176,954 | 188,290 | 211,703 | 238,028 | 267,626 | 300,905 |
| COGS | (17,617) | (20,088) | (20,932) | (23,658) | (28,448) | (29,713) | (34,543) | (38,839) | (43,668) | (49,098) |
| Gross Profit | 94,214 | 101,933 | 106,014 | 117,142 | 148,506 | 158,577 | 177,160 | 199,190 | 223,958 | 251,807 |
| Operating Expenses | (13,653) | (13,620) | (15,002) | (17,440) | (23,013) | (24,894) | (25,650) | (28,839) | (32,425) | (36,457) |
| Selling, General, Administrative | (33,313) | (35,830) | (36,886) | (41,058) | (50,684) | (53,014) | (61,822) | (69,510) | (78,153) | (87,871) |
| Total Operating Expenses | (46,966) | (49,450) | (51,888) | (58,498) | (73,697) | (77,908) | (87,472) | (98,349) | (110,579) | (124,329) |
| Operating Profit (EBITDA) | 47,248 | 52,483 | 54,126 | 58,644 | 74,809 | 80,669 | 89,688 | 100,840 | 113,380 | 127,478 |
| D&A | 3,925 | 5,661 | 5,753 | 6,025 | 7,362 | 7,431 | 2,861 | 2,982 | 3,108 | 3,239 |
| EBIT | 43,323 | 46,822 | 48,373 | 52,619 | 67,447 | 73,238 | 86,827 | 97,858 | 110,272 | 124,239 |
| Operating Taxes | (8,987) | (9,602) | (10,992) | (11,323) | (13,537) | (14,751) | (17,046) | (19,165) | (21,548) | (24,228) |
| NOPAT (Net Operating Profit After Taxes) | 34,336 | 37,220 | 37,381 | 41,296 | 53,910 | 58,487 | 69,781 | 78,693 | 88,723 | 100,011 |
| (+) Depreciation & Amortization | 3,925 | 5,661 | 5,753 | 6,025 | 7,362 | 7,431 | 2,861 | 2,982 | 3,108 | 3,239 |
| (-) Capital Expenditures | (3,370) | (3,388) | (4,353) | (8,656) | (5,336) | (17,445) | 5,604 | 5,841 | 6,087 | 6,344 |
| (-) Change in NWC | -- | (1,430) | (7,937) | (9,457) | 1,175 | (19,800) | (3,906) | (4,533) | (5,096) | (5,730) |
| NWC | 4,903 | 3,473 | (4,464) | (13,921) | (12,746) | (32,546) | (36,452) | (40,985) | (46,081) | (51,811) |
| Current Assets (non cash) | 59,067 | 62,456 | 65,809 | 85,595 | 108,194 | 80,219 | 91,188 | 102,527 | 115,276 | 129,610 |
| Current Liabilitites | 54,164 | 58,983 | 70,273 | 99,516 | 120,940 | 112,765 | 127,640 | 143,512 | 161,357 | 181,421 |
| Unlevered Free Cash Flow | 41,631 | 47,699 | 55,424 | 65,434 | 65,433 | 103,163 | 70,944 | 80,367 | 90,840 | 102,636 |
| Assumptions | ||||||||||
| Fiscal Year | 2018A | 2019A | 2020A | 2021A | 2022A | 2023E | 2024E | 2025E | 2026E | 2027E |
| Revenue Growth | 9.1% | 4.0% | 10.9% | 25.7% | 12.4% | 12.4% | 12.4% | 12.4% | 12.4% | |
| COGS % of Revenue | -15.8% | -16.5% | -16.5% | -16.8% | -16.1% | -16.3% | -16.3% | -16.3% | -16.3% | -16.3% |
| OE% of Revenue | -12.2% | -11.2% | -11.8% | -12.4% | -13.0% | -12.1% | -12.1% | -12.1% | -12.1% | -12.1% |
| SG&A % of Revenue | -29.8% | -29.4% | -29.1% | -29.2% | -28.6% | -29.2% | -29.2% | -29.2% | -29.2% | -29.2% |
| Tax % of EBIT | -19.0% | -18.3% | -20.3% | -19.3% | -18.1% | -19.0% | -19.0% | -19.0% | -19.0% | -19.0% |
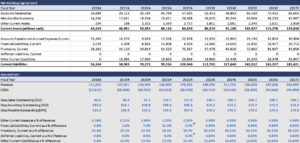
| Net Working Capital (mn) | ||||||||||
| Fiscal Year | 2018A | 2019A | 2020A | 2021A | 2022A | 2023E | 2024E | 2025E | 2026E | 2027E |
| Accounts Receivables | 26,889 | 29,152 | 32,184 | 46,799 | 57,505 | 52,353 | 58,863 | 66,183 | 74,412 | 83,665 |
| Merchandise Inventory | 16,336 | 17,641 | 18,536 | 19,621 | 24,388 | 26,015 | 30,244 | 34,004 | 38,233 | 42,987 |
| Other Current Assets | 204 | 188 | 2,332 | 1,690 | 2,727 | 1,851 | 2,081 | 2,340 | 2,631 | 2,958 |
| Current Assets (without cash) | 43,429 | 46,981 | 53,052 | 68,110 | 84,620 | 80,219 | 91,188 | 102,527 | 115,276 | 129,610 |
| Accounts Payable and Accrued Expenses,Current | 25,464 | 10,570 | 9,630 | 12,528 | 22,678 | 22,335 | 25,965 | 29,194 | 32,824 | 36,906 |
| Financial Liabilities, Current | 2,539 | 2,208 | 8,824 | 15,868 | 4,369 | 12,986 | 14,600 | 16,416 | 18,457 | 20,752 |
| Provisions, Current | 26,161 | 31,120 | 34,814 | 51,520 | 70,287 | 57,478 | 64,626 | 72,662 | 81,697 | 91,856 |
| Defferred Liabilities, Current | 0 | 0 | 0 | 0 | 0 | 0 | 0 | 0 | 0 | 0 |
| Other Current Liabilities | 0 | 15,085 | 17,005 | 19,600 | 23,606 | 19,966 | 22,448 | 25,240 | 28,378 | 31,907 |
| Current Liabilities | 54,164 | 58,983 | 70,273 | 99,516 | 120,940 | 112,765 | 127,640 | 143,512 | 161,357 | 181,421 |
| Assumptions | ||||||||||
| Fiscal Year | 2018A | 2019A | 2020A | 2021A | 2022A | 2023E | 2024E | 2025E | 2026E | 2027E |
| Revenue | 111,831 | 122,021 | 126,946 | 140,800 | 176,954 | 188,290 | 211,703 | 238,028 | 267,626 | 300,905 |
| COGS | (17,617) | (20,088) | (20,932) | (23,658) | (28,448) | (29,713) | (34,543) | (38,839) | (43,668) | (49,098) |
| Days Sales Outstanding (DSO) | 86.6 | 86.0 | 91.3 | 119.7 | 117.0 | 100.1 | 100.1 | 100.1 | 100.1 | 100.1 |
| Days Inventory Outstanding (DIO) | 333.8 | 316.1 | 318.8 | 298.6 | 308.6 | 315.2 | 315.2 | 315.2 | 315.2 | 315.2 |
| Days Payable Outstanding (DPO) | 520.4 | 189.4 | 165.6 | 190.6 | 287.0 | 270.6 | 270.6 | 270.6 | 270.6 | 270.6 |
| Other Current Assets as a % of Revenue | 0.18% | 0.15% | 1.84% | 1.20% | 1.54% | 0.98% | 0.98% | 0.98% | 0.98% | 0.98% |
| Financial Liabilities, Current as a % of Revenue | 2.3% | 1.8% | 7.0% | 11.3% | 2.5% | 6.90% | 6.90% | 6.90% | 6.90% | 6.90% |
| Provisions, Current as a % of Revenue | 23.4% | 25.5% | 27.4% | 36.6% | 39.7% | 30.53% | 30.53% | 30.53% | 30.53% | 30.53% |
| Defferred Liabilities, Current as a % of Revenue | 0.0% | 0.0% | 0.0% | 0.0% | 0.0% | 0.00% | 0.00% | 0.00% | 0.00% | 0.00% |
| Other Current Liabilities as a % of Revenue | 0.0% | 12.4% | 13.4% | 13.9% | 13.3% | 10.60% | 10.60% | 10.60% | 10.60% | 10.60% |
| Fixed Assets Schedule | ||||||||||
| Fiscal Year | 2018A | 2019A | 2020A | 2021A | 2022A | 2023E | 2024E | 2025E | 2026E | 2027E |
| Beginning PP&E | 41,891 | 50,551 | 50,269 | 55,362 | 66,671 | 64,989 | 67,732 | 70,591 | 73,571 | |
| D&A | 3,925 | 5,661 | 5,753 | 6,025 | 7,362 | 7,431 | 2,861 | 2,982 | 3,108 | 3,239 |
| CapEx | 45,816 | 14,321 | 5,471 | 11,118 | 18,671 | 5,749 | 5,604 | 5,841 | 6,087 | 6,344 |
| Ending PP&E | 41,891 | 50,551 | 50,269 | 55,362 | 66,671 | 64,989 | 67,732 | 70,591 | 73,571 | 76,676 |
| Assumptions | ||||||||||
| Fiscal Year | 2018A | 2019A | 2020A | 2021A | 2022A | 2023E | 2024E | 2025E | 2026E | 2027E |
| D&A as a % of Beginning PP&E (to revenue) | 4.6% | 4.5% | 4.3% | 4.2% | 4.4% | 4.4% | 4.4% | 4.4% | 4.4% | |
| CapEx as a % of Beginning PP&E (to revenue) | 11.7% | 4.3% | 7.9% | 10.6% | 8.6% | 8.6% | 8.6% | 8.6% | 8.6% |
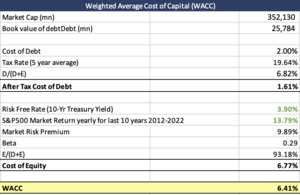
| Weighted Average Cost of Capital (WACC) | |||
| Market Cap (mn) | 352,130 | ||
| Book value of debtDebt (mn) | 25,784 | ||
| Cost of Debt | 2.00% | ||
| Tax Rate (5 year average) | 19.64% | ||
| D/(D+E) | 6.82% | ||
| After Tax Cost of Debt | 1.61% | ||
| Risk Free Rate (10-Yr Treasury Yield) | 3.90% | ||
| S&P500 Market Return yearly for last 10 years 2012-2022 | 13.79% | ||
| Market Risk Premium | 9.89% | ||
| Beta | 0.29 | ||
| E/(D+E) | 93.18% | ||
| Cost of Equity | 6.77% | ||
| WACC | 6.41% | ||
| Unlevered Free Cash Flow (mn) | ||||||||||
| Fiscal Year | 1900A | 1900A | 1900A | 1900A | 1900A | 2023E | 2024E | 2025E | 2026E | 2027E |
| Unlevered Free Cash Flow | 41,631 | 47,699 | 55,424 | 65,434 | 65,433 | 103,163 | 70,944 | 80,367 | 90,840 | 102,636 |
| Projection Year | 1 | 2 | 3 | 4 | 5 | |||||
| Present Value of Free Cash Flow | 109,780 | 80,338 | 96,846 | 116,488 | 140,056 | |||||
| Implied Share Price Calculation | Sensitivity Table | |||||||||
| Sum of PV of FCF (5 year projected Assumption) | 543,508 | |||||||||
| Growth Rate | 10.40% | Growth Rate | ||||||||
| WACC | 6.41% | 198.17 | 9.40% | 9.90% | 10.40% | 10.90% | 11.40% | |||
| Terminal Value | 2,839,967 | WACC | 5.41% | 202.96 | 225.00 | 225.00 | 202.96 | 172.13 | ||
| PV of Terminal Value | 2,081,179 | 5.91% | 188.01 | 205.47 | 205.47 | 188.01 | 162.63 | |||
| Enterprise Value | 2,624,687 | 6.41% | 188.01 | 205.47 | 205.47 | 188.01 | 162.63 | |||
| (+) Cash | 23,574 | 6.91% | 202.96 | 225.00 | 225.00 | 202.96 | 172.13 | |||
| (-) Debt | 25,784 | 7.41% | 247.71 | 287.40 | 287.40 | 247.71 | 198.17 | |||
| (-) Minority Interest | -61,129 | |||||||||
| Equity Value | 2,683,606 | |||||||||
| Diluted Shares Outstanding (mm) | 2257.00 | |||||||||
| Implied Share Price | 198.17 | |||||||||
| Current Price | 156.6 | |||||||||
| Upside | 26.54% | |||||||||
| Valuation | TRUE | |||||||||
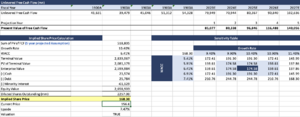
The result of base case of the DCF valuation indicating the implied shared price is 168.30, comparing to the current price, it has a 7.47% increase margin, where the growth rate and the WACC is 10.40% and 6.41% respectively. The Beta is 0.29, which indicating that it is less correlated to the S&P market, which is a typical number for medical companies on medicine that is not focusing on technologies such as medical devices and robotics.
For the bull case and bear case, it has a 26.54% increase and -5.09% decrease respectively. In these 2 cases, a different approach has been applied by comparing the earnings using EBITDA and free cash flow equity. The 3-year EBITDA Growth Rate per share is 13.9, which is above the median of the range over the past 10 years of 13.2, and also 59% higher than other companies in the biotechnology industry. The 3-year revenue growth rate per share is 14.9, which is also higher than the median of the range over the past 10 years of 10.1, and it is 61.1% better than other companies in the Biotechnology industry. Furthermore, the 3-year Book Growth rate per share is 15.6, which is almost at the highest value of the range over the past 10 years of 18.4. Finally, the 3-year FCF Growth rate is 23.6 which is stronger than 73% of the companies in the Biotechnology industry.
Assumption: edit edit source
- The growth rate is obtained using the difference between the terminal value in the next 5 years comparing to the actual value in the past 5 years.
- WACC: Risk free rate taking the current 10 year treasury yield rate at 3.90%, S&P500 market return for the last 10 years from 2012-2022 of 13.79%.
- Base case: constant average of numbers in the past 5 years. The logic behind is that NVO is company focusing on medicine, which has a strong economic moat in the industry and a usually parking of money during a bear market according to the Dow's theory.
Catalyst and competitive analysis: edit edit source
The main competitors of NVO in the market includes: Wuxi biologics (HKG: 2269), Eli Lily (LLY), Johnson & Johnson (JNJ), Merk Co (MRK), AstraZeneca (AZN), Pfizer (PFE).
The PE value of NVO is 49.43, where the most related competitor Eli Lily (LLY) is 72.19, which is undervalued comparatively. In the recent update, the Eli Lily has beat the market expectation in the second-quarter earnings. Elil Lily saying that there is a surge in demand for Mounjaro, which they experienced delays in fulfilling the demand. This indicating that there is a huge increase in demand and so does the sales increase in the related drug. Therefore, the Jefferies analyst Akash Tewari upgraded shares of Eli Lilly to Buy from Hold and raised his price target from $430 to $615. He mentioned that NVO's product, weight-loss drug Wegovy in a trial, known as SELECT, has reduced the risk of heart attack and stroke in obese and overweight patients by 20%, exceeding expectations. These views from the market indicating more money will be entering the pharmaceutical industry and specifically the weight-loss drug. This news caused both LLY and NVO to rise over 15% in one day. On top of that, NVO has a lower PE value comparing to his industry and therefore a higher increase than its industry.
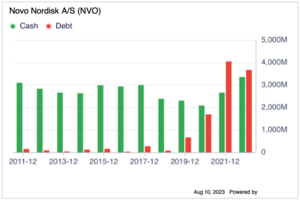
The financial strength of NVO includes: the cash-to-debt of 1.09, which is similar to its competitiors above, which has all recently increases the debt in the past 2 years. This could mean that the market has recently focusing on these area in the weight loss drug market, the R&D budget has increased. Looking at the current ratio and quick ratio of 0.86 and 0.67, which are currently under 1, but the industry has a similar number. The equity-to-asset and the debt-to-EBITDA is 0.32 and 0.31 respectively, they are both better than the market by 63% and 70%. The Piotroski F-score, Altman Z-score and the Beneish M-score all points to the safe indicator, indicating NVO is not likely to be a manipulator on their financials. For the Profitability strength: the Gross Margin%, Net Margin%, ROA%, ROE%, ROCE% and ROIC% are all significantly better than the biotechnology industry by 80 to 98%. For the comparative indicators: the PE, PB, PEG, PS ratio is similar to the industry, but if we compare to S&P500 market, there is a 17% increase margin comparing to the ratios of S&P500 market, indicating there is still 17% profit.
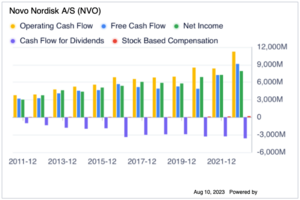
Furthermore, the operating cash flow has a consistent increase in the past 10 years, much higher the the net income and they also have a negative financing and investing cash flow. The Free cash flow increase steadily over the past 10 years, which is a good indicator to buy.
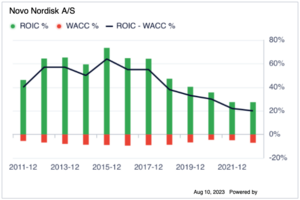
Last but not least, the difference in ROIC to WACC % remains positive in the past 10 years. Although there is a decrease since 2015, this is because of the market capital size of NVO has increased in the past 10 years, so this is reasonable. The current ROIC-WACC% is still 27.2%.[16]
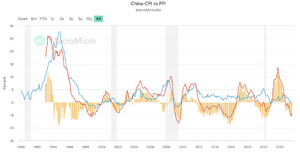
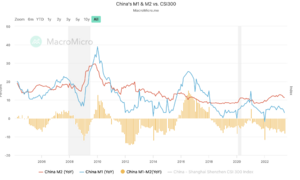
Comparing to its competitor Wuxi (HKG:2269), for macro analysis, the M1 to M2 value in the China market is a negative value, indicating that the money is not coming out to the market, lower buying power. Also, thePPI remain very low, much lower than the expectation, which is currently at -4.40. The PPI to CPI ratio has a negative value of -4.10. These all indicating that the US market is healthier than the China market, the money is likely to buy NVO comparatively.[17]
Appendix edit edit source
Income Statement
| Income statement | 2022 |
| Fiscal year is January-December. All values DKK Millions. | |
| Sales/Revenue | 176,954 |
| Sales Growth | 25.68% |
| Cost of Goods Sold (COGS) incl. D&A | 30,975 |
| COGS excluding D&A | 24,373 |
| Depreciation & Amortization Expense | 6,602 |
| Depreciation | 5,003 |
| Amortization of Intangibles | 1,599 |
| COGS Growth | 22.48% |
| Gross Income | 145,979 |
| Gross Income Growth | 26.38% |
| Gross Profit Margin | 82.50% |
| SG&A Expense | 71,560 |
| Research & Development | 21,761 |
| Other SG&A | 49,799 |
| SGA Growth | 26.64% |
| EBIT | 74,419 |
| Unusual Expense | 2,526 |
| Non Operating Income/Expense | -2,322 |
| Non-Operating Interest Income | 239 |
| Interest Expense | 559 |
| Interest Expense Growth | 36.01% |
| Gross Interest Expense | 559 |
| Pretax Income | 69,251 |
| Pretax Income Growth | 17.17% |
| Pretax Margin | 39.14% |
| Income Tax | 13,537 |
| Income Tax - Current Domestic | 17,343 |
| Income Tax - Deferred Domestic | -3,806 |
| Equity in Affiliates | -189 |
| Consolidated Net Income | 55,525 |
| Net Income | 55,525 |
| Net Income Growth | 16.27% |
| Net Margin | 31.38% |
| Net Income After Extraordinaries | 55,525 |
| Net Income Available to Common | 55,525 |
| EPS (Basic) | 24.51 |
| EPS (Basic) Growth | 17.87% |
| Basic Shares Outstanding | 2,265 |
| EPS (Diluted) | 24.44 |
| EPS (Diluted) Growth | 17.84% |
| Diluted Shares Outstanding | 2,272 |
| EBITDA | 81,021 |
| EBITDA Growth | 25.97% |
| EBITDA Margin | 45.79% |
| EBIT | 74,419 |
Balance Sheet
| Assets | 2022 | |
| Fiscal year is January-December. All values DKK Millions. | ||
| Cash & Short Term Investments | 23,574 | |
| Cash Only | 12,653 | |
| Cash & Short Term Investments Growth | 34.82% | |
| Cash & ST Investments / Total Assets | 9.77% | |
| Total Accounts Receivable | 51,500 | |
| Accounts Receivables, Net | 50,560 | |
| Accounts Receivables, Gross | 52,080 | |
| Bad Debt/Doubtful Accounts | -1,520 | |
| Other Receivables | 940 | |
| Accounts Receivable Growth | 23.32% | |
| Accounts Receivable Turnover | 3.44 | |
| Inventories | 24,388 | |
| Finished Goods | 6,038 | |
| Work in Progress | 13,673 | |
| Raw Materials | 6,392 | |
| Progress Payments & Other | -1,715 | |
| Other Current Assets | 8,732 | |
| Miscellaneous Current Assets | 8,732 | |
| Total Current Assets | 108,194 | |
| Net Property, Plant & Equipment | 66,671 | |
| Property, Plant & Equipment - Gross | 111,426 | |
| Buildings | 39,859 | |
| Machinery & Equipment | 37,548 | |
| Construction in Progress | 22,361 | |
| Leases | 4,131 | |
| Other Property, Plant & Equipment | 7,527 | |
| Accumulated Depreciation | 44,755 | |
| Buildings | 16,781 | |
| Machinery & Equipment | 22,935 | |
| Other Property, Plant & Equipment | 5,039 | |
| Total Investments and Advances | 1,343 | |
| LT Investment - Affiliate Companies | 327 | |
| Other Long-Term Investments | 1,016 | |
| Intangible Assets | 51,416 | |
| Net Goodwill | 5,092 | |
| Net Other Intangibles | 46,324 | |
| Other Assets | 206 | |
| Tangible Other Assets | 206 | |
| Total Assets | 241,257 | |
| Assets - Total - Growth | 24.03% | |
| Asset Turnover | 0.81 | |
| Return On Average Assets | 25.48% |
Cashflow Statement
| Cashflow Statement | 2022 |
| Operating Activities | |
| Fiscal year is January-December. All values DKK Millions. | |
| Net Income before Extraordinaries | 55,525 |
| Net Income Growth | 16.27% |
| Depreciation, Depletion & Amortization | 6,602 |
| Depreciation and Depletion | 5,003 |
| Amortization of Intangible Assets | 1,599 |
| Deferred Taxes & Investment Tax Credit | -3,806 |
| Deferred Taxes | -3,806 |
| Other Funds | 25,902 |
| Funds from Operations | 84,223 |
| Changes in Working Capital | -5,336 |
| Receivables | -9,917 |
| Inventories | -4,767 |
| Accounts Payable | 6,717 |
| Other Assets/Liabilities | 2,631 |
| Net Operating Cash Flow | 78,887 |
| Net Operating Cash Flow Growth | 43.42% |
| Net Operating Cash Flow / Sales | 44.58% |
| Investing Activities | |
| All values DKK Millions. | |
| Capital Expenditures | -14,753 |
| Capital Expenditures (Fixed Assets) | -12,146 |
| Capital Expenditures (Other Assets) | -2,607 |
| Capital Expenditures Growth | -99.77% |
| Capital Expenditures / Sales | -8.34% |
| Net Assets from Acquisitions | -7,075 |
| Sale of Fixed Assets & Businesses | - |
| Purchase/Sale of Investments | -3,090 |
| Purchase of Investments | -9,735 |
| Sale/Maturity of Investments | 6,645 |
| Net Investing Cash Flow | -24,918 |
| Net Investing Cash Flow Growth | 21.17% |
| Net Investing Cash Flow / Sales | -14.08% |
| Financing Activities | |
| All values DKK Millions. | |
| Cash Dividends Paid - Total | -25,303 |
| Common Dividends | -25,303 |
| Change in Capital Stock | -24,086 |
| Repurchase of Common & Preferred Stk. | -24,086 |
| Issuance/Reduction of Debt, Net | -1,410 |
| Change in Current Debt | 93 |
| Change in Long-Term Debt | 11,120 |
| Issuance of Long-Term Debt | 11,120 |
| Net Financing Cash Flow | -51,797 |
| Net Financing Cash Flow Growth | -103.18% |
| Net Financing Cash Flow / Sales | -29.27% |
| Exchange Rate Effect | -238 |
| Net Change in Cash | 1,934 |
| Free Cash Flow | 66,741 |
| Free Cash Flow Growth | 37.13% |
| Free Cash Flow Yield | 1.94% |
References edit edit source
- ↑ https://www.novonordisk.com/about/our-heritage.html
- ↑ 2.0 2.1 https://www.novonordisk.com/investors/investor-highlights.html
- ↑ 3.0 3.1 3.2 https://www.novonordisk.com/investors/annual-report.html
- ↑ https://www.novomedlink.com/diabetes/patient-support/product-education/library/ozempic-pen-instructions-for-use.html
- ↑ https://www.frontiersin.org/articles/10.3389/fendo.2020.00568/full
- ↑ https://oa.mg/author/r-krishna-murthy-karuturi-A2089560729
- ↑ https://diatribe.org/fda-approves-ozempic-powerful-once-weekly-type-2-diabetes-medication
- ↑ https://www.europeanpharmaceuticalreview.com/news/100641/first-oral-glp-1-treatment-type-2-diabetes-approved/
- ↑ https://www.theguardian.com/society/2023/feb/13/weight-loss-jabs-to-be-sold-via-high-street-chemists
- ↑ 10.0 10.1 https://www.novonordisk.com/investors/stock-information.html
- ↑ https://www.novonordisk.com/about/corporate-governance.html
- ↑ 12.0 12.1 https://www.euronews.com/next/2023/04/28/mounjaro-the-new-weight-loss-drug-set-to-rival-ozempic-and-wegovy
- ↑ https://www.theguardian.com/society/2023/may/10/online-uk-pharmacies-prescribing-weight-loss-jabs-to-people-with-healthy-bmi-investigation
- ↑ https://www.vogue.co.uk/beauty/article/what-is-ozempic
- ↑ https://edition.cnn.com/2023/06/20/health/novo-nordisk-lawsuits/index.html
- ↑ https://www.gurufocus.com/stock/NVO/summary
- ↑ https://en.macromicro.me/charts/260/cn-china-m1-m2