Rolls-Royce Holdings plc
Summary edit edit source
Rolls-Royce Holdings plc operates as an industrial technology company in the United Kingdom and internationally. The company operates in four segments: Civil Aerospace, Power Systems, Defence, and New Markets. The Civil Aerospace segment develops, manufactures, and sells aero engines for large commercial aircraft, regional jet, and business aviation markets, as well as provides aftermarket services. The Power Systems segment engages in the development, manufacture, marketing, and sale of integrated solutions for onsite power and propulsion for the marine, defense, power generation, and industrial markets. The Defence segment offers aero engines for military transport and patrol aircraft applications; and naval engines and submarine nuclear power plants, as well as aftermarket services. The New Markets segment develops, manufactures, and sells small modular reactor and new electrical power solutions. It also provides maintenance, repair, and overhaul services. Rolls-Royce Holdings plc was founded in 1884 and is headquartered in London, the United Kingdom.
Investment presentation
Mission Statement edit edit source
Rolls-Royce articulates its mission as a commitment to "delivering excellence in power solutions for a rapidly evolving world." This serves as a guiding compass for the company's financial endeavors and strategic decisions.
At its core, the mission statement highlights two key objectives: excellence in power solutions and adaptability to a changing world.
In the financial context, the former can can be translated into focusing on revenue streams generated from their core products: aero engines and power systems. The company aims to generate substantial revenue by offering cutting-edge, efficient, and reliable power solutions to their clients. This revenue drives their financial growth and supports their operational activities, such as research and development (R&D), manufacturing, and customer service.
The phrase "rapidly evolving world" underlines the significance of flexibility and responsiveness to external changes. In financial terms, this translates to the company's ability to navigate through economic uncertainties, technological shifts, and changing customer preferences. For instance, Rolls-Royce must allocate resources wisely, invest in innovative technologies, and diversify its portfolio to ensure it remains competitive and resilient in a dynamic market.
Rolls-Royce's mission statement influences its financial strategies in several ways:
- R&D Allocation: A considerable portion of the company's budget is dedicated to research and development, aligning with the pursuit of excellence. This investment supports the creation of state-of-the-art power solutions, which can translate into higher demand and revenue in the future.
- Risk Management: The focus on adaptability to a changing world requires the company to employ robust risk management strategies. This involves hedging against potential economic downturns, diversifying its client base, and staying updated with emerging technologies that could impact their market.
- Investor Relations: The mission statement also plays a role in attracting investors who align with the company's values and goals. Communicating how financial strategies support the mission can bolster investor confidence and long-term commitment.
Rolls-Royce's mission statement underscores its dedication to delivering high-quality power solutions while staying responsive to a swiftly changing environment. This commitment resonates across the financial strategies, from resource allocation to risk management, contributing to the company's ongoing financial success.
Company History edit edit source

1904 → Rolls Royce was established by Charles Rolls and Henry Royce as an electrical and mechanical business which sold luxury cars primarily in London.
1914 → In response to the first world war Rolls Royce built their first aero engine- the Eagle for fighter jets.
1953 → Rolls Royce entered the civil aviation sector with their aircraft Dart in the Vickers Viscount which became the universal standard for gas turbines in aviation.
1960s → Due to jet engine misfortune the business was forcibly liquidated. The majority of company portions were bought by the government owned company Rolls Royce 1971
1987 —> The company went through reform, back to the private sector through a number of M&A deals
1998 → BMW gained ownership of Rolls Royce leading to the creation of the new Rolls-Royce Motor Cars Limited
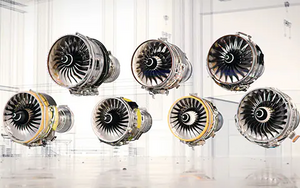
2010 → Rolls Royce produced their first Trent engine, which was used in Airbus aircrafts. Since then the Trent engine has constantly been upgraded and modified.
The Trent engines now power many famous aircrafts including Qatar Airways and Singapore Airlines aircrafts.
2021→ Rolls Royce released their “pathway to zero” plan in line with the Paris agreement which was agreed upon by 193 other parties.
Later in the year Rolls Royce set the world record for fastest electric vehicle with an aircraft that travelled at the speed of 555.9 km/h.[1]
Segments edit edit source
Rolls-Royce Holdings plc operates as an industrial technology company in the United Kingdom and internationally. The company operates in four segments: Civil Aerospace, Power Systems, Defence, and New Markets.
Civil Aerospace edit edit source
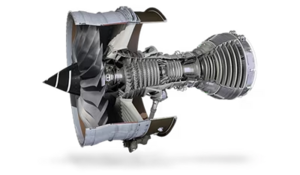
Rolls-Royce have a large installed product base of more than 5,700 large engines and around 9,700 business aviation and regional engines. Around two thirds of these are covered by Long Term Serviceable Agreements, providing long-term embedded value for the Group.
Rolls-Royce also have a large order book with more than 1,500 new large engines due to be delivered over the next few years, representing 52% market share and supporting fleet growth expectations in the medium term.
Rolls-Royces priority for Civil Aerospace is to maximise value from existing capabilities and position the business for the transition to net zero.
48.5% Of total employees work in Civil Aerospace
Defence edit edit source
Defence is a market leader in aero engines for military transport and patrol aircraft with strong positions in combat and helicopter applications. It has significant scale in naval and is the technical authority for through-life support of the nuclear power plant for the Royal Navy's submarine fleet.
With over 16,000 Defence engines in service, Rolls-Royce are a leading provider of military aircraft engines and aero-derivative gas turbines for naval use, and the sole provider of powerplants for the UK’s nuclear submarine fleet.
Rolls-Royce do not provide or manufacture weapons.
In 2021, Rolls-Royce were chosen by the US Air Force as the new provider of power for its fleet of 76 eight-engine B-52 aircraft. The testing and development phase of the award, valued at around $500m commenced in 2022 with the total contract valued at $2.6bn over the next 16 years to 2038. In the UK, the Ministry of Defence announced Rolls-Royce's continuation as the sole supplier of propulsion systems for its next generation of nuclear-powered submarines, which will replace the Astute class in the future. The UK Government also signed an agreement with its Japanese counterpart to develop and deliver a future combat aircraft engine demonstrator. This builds on Team Tempest, the UK-led next-generation fighter programme we are a member of, in which the MoD has committed £2bn of initial investment spending.
21.8% Of total employees work in Defence
Power Systems edit edit source
In Power Systems, Rolls-Royce are focused on expanding their position as an industry leader in mission critical power and propulsion solutions in our end markets. To achieve this, they are maximising the value from existing capabilities by transitioning from supplying standalone products to fully integrated systems, as well as increasing penetration in countries with high-growth economies. Rolls-Royce are also seizing strategic growth opportunities by developing the solutions customers need to support them in their transition to alternative power with net zero carbon emissions.
Rolls-Royce have a large installed product base with over 150,000 engines and around 40,000 active customers worldwide, generating revenues from both OE and aftermarket services. Rolls-Royce's established portfolio of products consists of a range of high-speed reciprocating diesel and gas engines delivered within a complete system solution or as a standalone engine. Rolls-Royce have been increasing sales of complete system solutions, including gensets, battery storage systems and automation to achieve greater value capture and closer customer relationships and have been exploring opportunities to provide energy-as-a-service. Rolls-Royce's agreement with Sustainable Development Capital LLP (SDCL) to jointly work on energy-as-a-service is an example of how we are helping to accelerate the transition to more sustainable power.
18.5% Of total employees work in Power Systems
New Markets edit edit source
The Rolls-Royce New markets segments consists of 2 early stage businesses with high growth potential: Rolls-Royce Electrical and Rolls-Royce SMR.
Rolls-Royce Electrical edit edit source
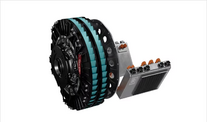
Electrification will contribute to decarbonisation of aviation and electrical technologies and capabilities can also be leveraged for civil, defence and marine applications. Smaller, all-electric aircraft will enable more efficient, quieter and zero-emission air mobility, while hybrid-electric systems increase range and enable more sustainable solutions for larger regional aircraft. The emerging market of advanced air mobility, which includes electrical vertical take-off (eVTOL) aircraft as well more conventional electric commuter aircraft, is aiming to enable a new way of using air mobility on urban and regional routes.
RR are championing aircraft electrification to deliver the clean, sustainable, safe, and silent propulsion and energy systems for the urban and regional air mobility markets of tomorrow.

RR develop complete power and propulsion systems for all-electric and hybrid-electric applications. Our systems under design feature the latest technology, from power generation and energy storage via power electronics and control systems to electric motors.
Electric propulsion unit for Urban Air Mobility
- Direct-drive, air-cooled 150 kW electric motor with integrated power electronics and control
Electric propulsion unit for Regional Air Mobility
- Direct-drive, air-cooled 320 kW electric motor with integrated power electronics and control
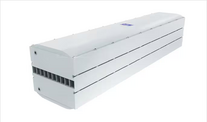
Energy Storage System
- Modular lithium-ion battery system for scalable configuration based on application demand
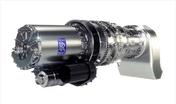
Turbogenerator system
- High efficiency, dual-fuel capable turbogenerator system for hybrid-electric aircraft platforms
Rolls-Royce Small Modular Reactors (SMR)

Rolls-Royce SMR Ltd is a factory built nuclear power plant that offers clean, affordable energy for all.
With an unprecedented demand for clean energy as global markets seek solutions to support their journey to net zero. The demand is for energy that is always on and which generates virtually no emissions. Nuclear energy is the most powerful source of ‘always on’ clean energy, however, it must be deliverable, scalable and cost competitive for it to be widely embraced.
Rolls-Royce's nuclear experience is complemented by their unique aerospace know-how of manufacturing, supply chain management and logistics. Together, that heritage and experience is at the core of the SMR program.
Rolls-Royce expects SMR to receive government approval by 2024 and expected to be fully integrated into the grid by 2030.
The Rolls-Royce SMR is low in cost, deliverable, global and scalable and Investable since it's 90% factory built and has a compact footprint.
Revenues by segments edit edit source
Total underlying group revenue in 2023 H1 results was £6.95 Billion. The split between each segment is shown below.
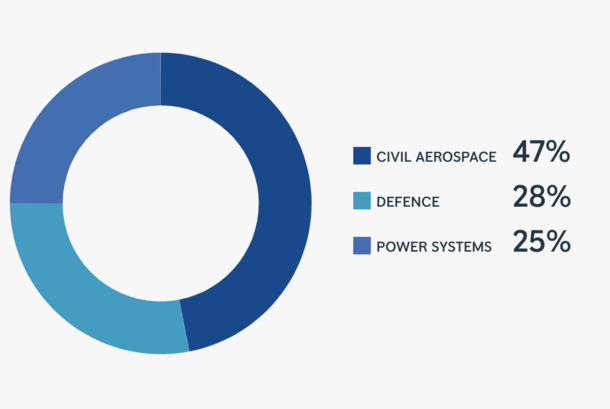
The following table shows further details from 2023 H1 results. All numbers are in £million.
| Segment | Revenue | Gross profit | Operating profit | Trading Cash flow |
|---|---|---|---|---|
| Civil Aerospace | 3257 | 690 | 405 | 401 |
| Defence | 1913 | 379 | 261 | 76 |
| Power Systems | 1774 | 452 | 125 | 22 |
| New Markets | 1 | (78) | (42) |
Projects edit edit source
Rolls Royce have a plethora of fascinating projects underway at the moment- we have selected a few to highlight the innovative and adaptive nature of the company.
Space:
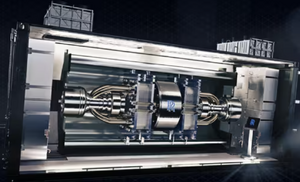
Rolls Royce is working on a two-stage-to-orbit system eg. gas turbines to power hypersonic planes that will take payloads to low Earth orbit, as well as nuclear thermal propulsion* solutions to power fast, efficient rockets for space travel. The gas turbines will take the aircraft into low Earth orbit by combining propulsion systems with a gas turbine and ramjet technologies*.
They are also working on producing small reactors (micro reactors) which will use clean, nuclear energy to power the bases that will be set up on the moon. A regular rocket would require tonnes of fuel to reach the demands of Moon/Mars inhabitants however Rolls Royce’s nuclear reactors only use a few grams of uranium so the systems are lighter and can carry a higher payload whilst maintaining clean energy standards. The reactors will also have an extremely long product life-span as it relies on the natural decay of Uranium which takes decades.
Rolls Royce is undertaking this project since the current goal for space exploration is to inhabit the Moon/ Mars by 2030. Rolls Royce are currently in their product development and testing phase with this project which are showing promising results. This project is funded by the UK Space Agency
* Nuclear propulsion: A force which provides propellant efficiency in rockets
* Ramjet technology: A type of air breathing jet engine which uses the engine’s forward motion to compress incoming air
[2] Small Molecular Reactors (SMR):

In light of the Russia-Ukraine war the UK government has increased investments into the UK energy sector, especially clean energy with the aim of reducing energy dependency on other countries. Rolls Royce are attempting to distribute nuclear reactors which provide scalable, cost competitive and widely available nuclear energy.
Rolls Royce SMR have produced a repeatable factory-built power station which has been tested for its usage of nuclear power. The factory’s reproducible status has allowed Rolls Royce to hopefully have the same factory design internationally in Estonia, Turkey and the Czech Republic. The project is predicted to generate £52 billion in economic benefit and 40,000 regional UK jobs by 2050.
The SMR will generate roughly 470 MW of low carbon energy which is equivalent to more than 150 onshore wind turbines. It will provide consistent base load generation for at least 60 years, unlike wind turbines which have an average lifespan of ~ 20 years. The power station will be able to support both on-grid electricity and a range of off-grid clean energy solutions on top of providing clean energy for ~ 1 million homes.[3]
Hydrogen Engines:

Rolls Royce is also releasing a brand new hydrogen engine programme. They will be carrying out a series of rig and engine tests which validate the efficiency of hydrogen engines for small-mid sized aircrafts. If this programme is successful the firm will move to phase II- the flight test phase. The programme began in 2022 with testing on the Rolls-Royce AE 2100 engine in the UK with a followup with the Rolls-Royce Pearl 15 jet engine with an indefinite date. This project was inspired by market research carried out at UK Aerospace Technology Institute’s Fly Zero team which emphasised the market value of hydrogen engines in aircraft.[4]
Urban Air Mobility:
Urban air mobility represents a revolutionary market which has not yet been commercialised but is in its growth stage. The market is predicted to be worth over one billion pounds by the mid 2020s (hopefully 2027). The products are air taxis and electric, plane like vehicles which can transport up to four people at a time. The aim of these vehicles is to cover distances in a shorter amount of time, in a clear and more cost effective manner- the propulsion systems put in place by Rolls Royce will help meet these standards.

The electric propulsion unit for urban air mobility will be the direct-drive, air cooled 320 kW electric motor. The Torque* to weight ratio of up to 28 Nm/kg because of the engines integrated design and thermal management. This makes the engine highly adaptive and reliable. The energy storage system has been designed for utmost safety- it is composed of a lithium-ion battery with 2-10 module modules with 60-300 kWh capacity and 520-860V nominal voltage.
Although there is a lot of competition amongst large firms like Rolls Royce and also smaller start-ups, when Rolls Royce’s profound history in the aerospace industry is taken into consideration they are much more inclined to deliver more reliable, scalable and safe vehicles.
[5]*Torque is the amount of force required to cause an object to rotate on the axis
Leadership edit edit source
Tufan Erginbilgic holds the reins as the CEO of Rolls-Royce, after taking over in January 2023. With a a track record of leadership in the technology sector, East brings a unique blend of technical insight and strategic acumen to the company. He launched a transformation programme to improve the profitability of the maker of engines for Airbus A350 and Boeing 787 planes. Under his guidance, Rolls-Royce has embraced sustainable practices, showcasing Ergin's commitment to corporate social responsibility. His decisive and inclusive leadership style empowers employees at all levels, making him a driving force behind the company's continued success and prominence in the global market.
Former BP executive Helen McCabe has been hired as chief financial officer of Rolls-Royce. McCabe is responsible for overseeing the company's financial operations, strategic planning, and risk management. His role is crucial in aligning financial decisions with the company's overall objectives, ensuring that financial strategies support growth, innovation, and long-term stability. McCabe's expertise influences the allocation of resources, investment priorities, and financial reporting, all of which have direct implications for stakeholders and investors. This new leadership has caused shares in Rolls-Royce to gain 60% since the start of the year.
The leadership team at Rolls-Royce is responsible for ensuring that the company's financial goals are aligned with its strategic vision. They communicate this alignment both internally and externally, sharing insights into how financial decisions are grounded in the company's core mission and market dynamics. This clear communication helps employees understand the broader context in which financial decisions are made, fostering a sense of unity and purpose within the organization.
Under the leadership's guidance, Rolls-Royce is driven by a commitment to innovation and future-forward thinking. This is evident in their investment in research and development, exploring emerging technologies, and adapting to the evolving demands of the industry. The leadership's ability to champion innovation directly impacts the company's financial performance by positioning Rolls-Royce as a leading player in a competitive landscape.
Ownership Structure edit edit source
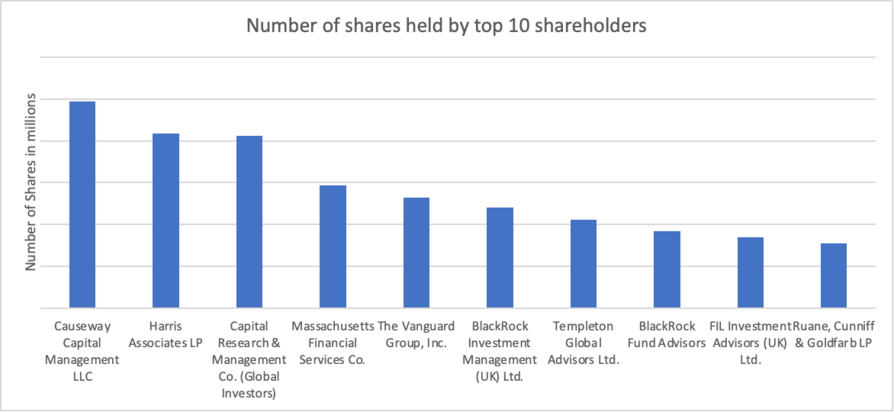
Institutional investors own 73% of Rolls Royce shares with the remainder owned by personal investors. The largest 10 institutions own 33.79% of Rolls Royce shares and are listed below.
| Beneficial Owner | Share | % Held |
| Causeway Capital Management LLC | 497.49m | 5.91% |
| Harris Associates LP | 417.54m | 4.96% |
| Capital Research & Management Co. (Global Investors) | 413.11m | 4.91% |
| Massachusetts Financial Services Co. | 293.36m | 3.49% |
| The Vanguard Group, Inc. | 264.75m | 3.15% |
| BlackRock Investment Management (UK) Ltd. | 240.09m | 2.85% |
| Templeton Global Advisors Ltd. | 210.59m | 2.50% |
| BlackRock Fund Advisors | 183.19m | 2.18% |
| FIL Investment Advisors (UK) Ltd. | 169.33m | 2.01% |
| Ruane, Cunniff & Goldfarb LP | 154.78m | 1.84% |
Corporate Strategy edit edit source
Rolls Royce is aiming to streamline its operations following the challenges posed by the impacts of the pandemic, higher energy costs, and constrained supply chains. The company is conducting a comprehensive overhaul of its operations which can be summarised by three key points.
Delivering on our commitments
During a previous fund-raising round, Rolls Royce made several commitments to improve the long-term health of the business.
Rebuild the balance sheet and gain an investment grade credit rating
Given the previous challenges, Rolls Royce is currently in a precarious financial situation with its credit rating currently rated at BB. The company is currently carrying out a restructuring programme by consolidating noncritical divisions, reducing headcount, and reorganising debt. Moreover, there are several agreements that will raise £2 billion from nuclear disposals.
Maximise value from existing capabilities
Since the technologies and customer base of Rolls Royce have been built over many years and are expected to last a long time, Rolls Royce is planning to support existing products and maximise their lifespan. Through this strategy, Rolls Royce hopes to assist customers with net zero ambitions, generate value and provide cheap updates.
Seizing opportunities for growth
The defence industry is looking to reduce its carbon footprint providing new avenues for Rolls Royce to provide services such as sustainable fuels or powerplants. Additionally, several sectors ranging from aerospace to power systems are in the process of targeting net zero emissions by 2050. This would require Rolls Royce to be innovative to target these segments by investing more in green technologies.
ESG Factors edit edit source
Environmental edit edit source
Like many other companies in this space, Rolls Royce is committed to reducing company operations emissions to net zero by 2030. They also have a further target to assist the entire aerospace sector to achieve net zero by 2050.The plan to achieve net zero is to retrofit old buildings to become energy efficient, installation of low-carbon technologies in all factories, and implement a closed-loop recycling programme for materials.
Social edit edit source
Many of Rolls Royce’s projects have a wide impact on several communities hence it is important to have a proper plan for stakeholder engagement.The views of affected stakeholders are taken into consideration by the teams closest to the project. These teams communicate regularly to ensure that stakeholders' concerns are addressed and heard by the company.
Identifying stakeholders edit edit source
Stakeholders are identified and classified based on project scopes and are categorised below
• Groups directly or indirectly affected by company operations
• Groups with an existing economic, social, or environmental responsibility or relationship
Stakeholders are managed by various methods as listed below
• Press Releases
• Publications such as Annual Report
• Membership in industry bodies
• Surveys
• One-to-one dialogues or consultations
Governance edit edit source
Rolls Royce is governed by an independent board of directors who are responsible for overseeing the operations of the business. Within the board, there are executive and non-executive directors. Executive directors are in charge of managing the business at a high level with the CEO responsible for the day-to-day operations.
Non-executive directors have the same legal responsibilities as executive directors, but they deal with more low-level operations such as assessing performance and ensuring targets are met. They also oversee risk management and financial controls to reduce operational risk for Rolls Royce.
Competitor Analysis edit edit source
| Competing Company | Description | Company Logo |
|---|---|---|
| SpaceX: SpaceX is a private company whose mission is to produce the most powerful next generation of fully reusable launch vehicles which will be capable of carrying humans to Mars and hopefully other destinations in the solar system. |
|
 |
| Joby Aviation: Joby Aviation is a company determined to pioneer the next big thing- Air mobility vehicles. The futuristic aircraft takes off and lands vertically while carrying up to four passengers. |
|
 |
| NuScale Power: A company which has 48 small modular nuclear reactor plants around the US with significant interest from the United Kingdom, Europe, the Middle East, Africa, and Asia. |
|
 |
| Airbus: The company is an aircraft manufacturer focused on increasing the volume of hydrogen-powered flights. |
|
 |
Financials edit edit source
Half year performance[10][11] edit edit source
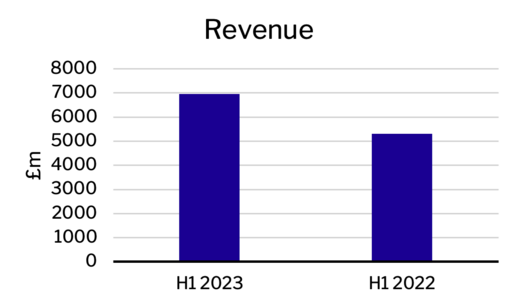
| Income Statement - (£m) | H1 2023 | H1 2022 | % change |
|---|---|---|---|
| Revenue | 6950 | 5308 | 28% |
| Gross Profit | 1515 | 942 | 55% |
| Gross Margin | 21.8% | 17.7% | nm |
| EBITDA | 1162 | 580 | 100% |
| Operating Income / EBIT | 673 | 125 | 382% |
Looking at the half year performance of Rolls-Royce, it is clear that there has been significant growth for the company. Revenue has grown by 28% compared with last year, while gross profit has seen a growth of 55%, due to a reduced COGS margin. The growth in revenue was predominantly driven by the Civil Aerospace, Defence and Power Systems segments. The EBITDA has doubled, while the operating income has increased by more than 5 times. These encouraging and rapid growths have been primarily driven by the growth in the revenue, with the airline industry looking to bounce back from the slow-down in economic activity as a result of COVID-19. Airlines have a greater demand for new aircraft, and so aircraft manufacturers have a new demand for civil aircraft engines such as the Trent series (Trent 1000 and Trent XWB form 100% of the market for engines used on the Airbus A330neo and A350)
5-year historical financials edit edit source
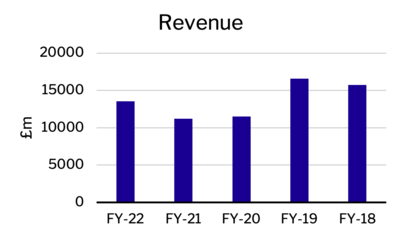
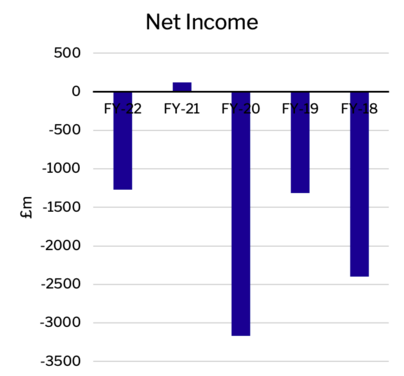
| Income Statement - (£m) | FY-22 | FY-21 | FY-20 | FY-19 | FY-18 |
|---|---|---|---|---|---|
| Revenue | 13520 | 11218 | 11491 | 16587 | 15729 |
| Gross Profit | 2757 | 2136 | 1113 | 942 | 1198 |
| Gross Margin | 20.4% | 19.0% | 9.7% | 5.7% | 7.6% |
| EBITDA | 1285 | 996 | 222 | -344 | -499 |
| Operating Income / EBIT | 787 | 465 | -382 | -933 | -1142 |
| Net Income | -1269 | 120 | -3170 | -1315 | -2401 |
| Balance sheet - (£m) | FY-22 | FY-21 | FY-20 | FY-19 | FY-18 |
|---|---|---|---|---|---|
| Total asset | 29450 | 28674 | 29517 | 32266 | 31857 |
| Total liabilities | 35466 | 33310 | 34392 | 35620 | 32909 |
| Net assets | -6016 | -4636 | -4875 | -3354 | -1052 |
The end of the recent year (FY-22) saw a recovery in the revenue generated. Pandemic years of -20 and -21 saw consecutive drops in the revenue as a result of reduced demand. In 2022, Rolls-Royce received new large engine orders from Malaysia Aviation Group, Norse Atlantic Airways and Qantas. The Bell V-280 Valor, powered by their AE1107F engines, was selected by the US Army for the Future Long Range Assault Aircraft programme. Order intake in the Power Systems segment grew by 29% to £4.3bn. This included mission critical backup power services for their engines.
5-year forecasted financials edit edit source
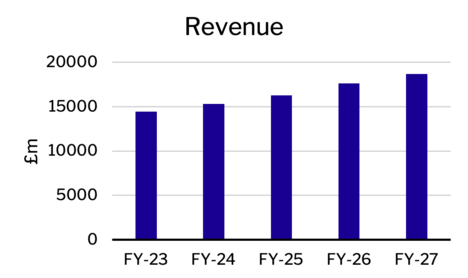
| Income Statement (£m) | FY-23 | FY-24 | FY-25 | FY-26 | FY-27 |
|---|---|---|---|---|---|
| Revenue | 14430 | 15338 | 16269 | 17625 | 18690 |
| Gross Profit | 2886 | 3068 | 3416 | 3701 | 4112 |
| Gross Margin | 20% | 20% | 21% | 21% | 22% |
| EBITDA | 1314 | 1396 | 1659 | 1833 | 2187 |
| Operating Income | 780 | 829 | 1057 | 1181 | 1495 |
| Net income | 451 | 525 | 758 | 877 | 1124 |
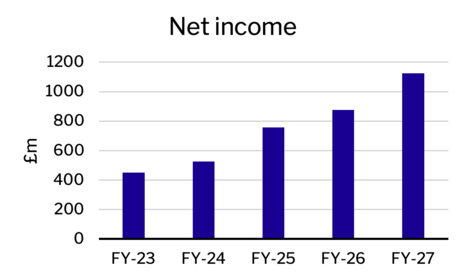
Revenue is expected to reach pre-pandemic levels by 2025, and continue growing steadily after that. The gross margin is expected to grow gradually, following a reduction in the COGS as outline in the valuation section.
Net income was calculated by projecting the taxes and interest expenses. Interest expenses were taken as fractions of the total debt. They were projected to be at a slightly higher than average 3% for 2023 and 2024, before slowly dropping to 2%, reflecting the higher interest rate imposed by the Bank of England, as an attempt to kerb inflation. However, holding the expectation that this attempt is successful, interest rates should drop by 2025 (conservative estimate)[12]. Tax projections can be seen below in the valuation section. The net income projections are in line with Capital IQ analyst projections.
Valuation edit edit source
What's the expected return of an investment in the company? edit edit source
The Stockhub users estimate that the expected return of an investment in Rolls-Royce Holdings plc over the next five years is negative 1%. This value was arrived at through the use an intrinsic valuation in the form of a discounted cash flow model.
Assuming that a suitable return level of five years is 10% per year (based of the S&P 500 returns) and Rolls-Royce achieves its return level of negative 1%, then the company can be considered, within fair margins, as fair-valued.
What are the assumptions used to estimate the return? edit edit source
Key Inputs edit edit source
| Description | Value | Commentary |
|---|---|---|
| Valuation Model | Discounted Cash Flow and Comparable Company Analysis | Two main approaches can be used to estimate the value of an investment:
Research has suggested that to estimate the expected return of an investment over a long-term investment horizon, a discounted cash flow model provides an accurate projection. |
| Financial Projections | Stockhub, CapitalIQ, Yahoo Finance | To improve the reliability of financial projections, a mixture of sources was used when projecting key financial metrics such as revenue. |
| Discount Rate | WACC | The weighted average cost of capital was used as the discount rate as it expresses the return that both bondholders and shareholders demand to provide the company with capital. The cost of equity and cost of debt have been calculated in the tables provided below using values taken from the company's financial statements, beta for the stock, and expected market returns. |
Discounted Cash Flow Model edit edit source
| Current Share Price: £2.10 update latest | |||||||||||||
| £ million | Historical | Projected | |||||||||||
|---|---|---|---|---|---|---|---|---|---|---|---|---|---|
| 2015 | 2016 | 2017 | 2018 | 2019 | 2020 | 2021 | 2022 | 2023 | 2024 | 2025 | 2026 | 2027 | |
| Income Statement | |||||||||||||
| Revenue | 13725 | 14955 | 14747 | 15729 | 16587 | 11491 | 11218 | 13520 | 14430 | 15338 | 16269 | 17625 | 18690 |
| % growth | 9.0% | -1.4% | 6.7% | 5.5% | -30.7% | -2.4% | 20.5% | 6.7% | 6.3% | 6.1% | 8.3% | 6.0% | |
| Cost Of Goods Sold | 10448 | 11876 | 12325 | 14531 | 15645 | 11678 | 9082 | 10763 | 11544 | 12270 | 12852 | 13924 | 14578 |
| % of revenue | 76% | 79% | 84% | 92% | 94% | 102% | 81% | 80% | 80.0% | 80.0% | 79.0% | 79.0% | 78.0% |
| Gross Profit | 3277 | 3079 | 2422 | 1198 | 942 | -187 | 2136 | 2757 | 2886 | 3068 | 3416 | 3701 | 4112 |
| Selling General & Admin Exp. | 1038 | 1765 | 1117 | 1572 | 1105 | 772 | 893 | 1079 | 1240 | 1318 | 1383 | 1463 | 1495 |
| % of revenue | 7.6% | 11.8% | 7.6% | 10.0% | 6.7% | 6.7% | 8.0% | 8.0% | 8.6% | 8.6% | 8.5% | 8.3% | 8.0% |
| Depreciation & Amort. | 512 | 538 | 524 | 643 | 589 | 604 | 531 | 498 | 534 | 568 | 602 | 652 | 692 |
| % of revenue | 3.7% | 3.6% | 3.6% | 4.1% | 3.6% | 5.3% | 4.7% | 3.7% | 3.7% | 3.7% | 3.7% | 3.7% | 3.7% |
| R & D Exp. | 818 | 923 | 843 | 768 | 770 | 723 | 778 | 891 | 866 | 920 | 976 | 1058 | 1121 |
| % of revenue | 6.0% | 6.2% | 5.7% | 4.9% | 4.6% | 6.3% | 6.9% | 6.6% | 6.0% | 6.0% | 6.0% | 6.0% | 6.0% |
| Total Operating Expenses | 1846 | 2688 | 1960 | 2340 | 1875 | 1495 | 1671 | 1970 | 2106 | 2239 | 2359 | 2520 | 2617 |
| Operating Income/ EBIT | 1431 | 391 | 462 | -1142 | -1522 | -2286 | 465 | 787 | 780 | 829 | 1057 | 1181 | 1495 |
| EBITDA | 1943 | 929 | 986 | -499 | -933 | -1682 | 996 | 1285 | 1314 | 1396 | 1659 | 1833 | 2187 |
| Tax Expense | 76 | -604 | 515 | -554 | 420 | 302 | -418 | -308 | 156 | 166 | 211 | 236 | 299 |
| Effective tax rate | 5% | -154% | 111% | 49% | -28% | -13% | -90% | -39% | 20% | 20% | 20% | 20% | 20% |
| EBIAT | 1355 | 995 | -53 | -588 | -1942 | -2588 | 883 | 1095 | 624 | 663 | 846 | 945 | 1196 |
| Cashflow | |||||||||||||
| D&A | 512 | 538 | 524 | 643 | 589 | 604 | 531 | 498 | 534 | 568 | 602 | 652 | 692 |
| % of revenue | 3.7% | 3.6% | 3.6% | 4.1% | 3.6% | 5.3% | 4.7% | 3.7% | 3.7% | 3.7% | 3.7% | 3.7% | 3.7% |
| Capital Expenditure | -487 | -585 | -730 | -905 | -747 | -585 | -328 | -359 | -721 | -767 | -895 | -969 | -1028 |
| % of revenue | 3.5% | 3.9% | 5.0% | 5.8% | 4.5% | 5.1% | 2.9% | 2.7% | 5.0% | 5.0% | 5.5% | 5.5% | 5.5% |
| Change in NWC | 489 | -463 | -2910 | -344 | -107 | 1119 | 3323 | -1974 | -883 | -938 | -995 | -1078 | -1143 |
| % of revenue | 3.6% | -3.1% | -19.7% | -2.2% | -0.6% | 9.7% | 29.6% | -14.6% | -6.1% | -6.1% | -6.1% | -6.1% | -6.1% |
| Unlevered FCF | 891 | 1411 | 2651 | -506 | -1993 | -3688 | -2237 | 3208 | 1319 | 1402 | 1548 | 1706 | 2003 |
Notes regarding the values used in the forecasting edit edit source
- All historical data, such as from the income statement and cashflow statement, was taken from Capital IQ, and cross-referenced with Yahoo Finance as well as Rolls-Royce investor presentations
- Revenue projections were taken from Capital IQ, and cross-referenced with Yahoo Finance.
- Following the 2023 Half Year investor presentation by Rolls-Royce on Aug 3rd 2023, revenue projections have been updated, and these updated values have been used.
- All other independent sections* of the income statement and cashflow statement (with some exceptions) were forecast by taking an average percentage of revenue over the historical period after 2015, and assumed to be constant over the forecast period. Data for 2020 and 2021 was excluded from the average to ignore the impact of COVID-19 on the industry (and on Rolls-Royce). The Cost Of Goods Sold forecast excluded 2018, 2019 and 2020 to highlight the assumption that the COGS should be a constant fraction of the revenue, and the years -18,-19,-20 had hiked Costs of Goods Sold relative to revenue generated.
- The exceptions include the SG&A expenses gradually decreasing from the average (8.6%) down to 8.0% by the end of the forecasting period, as well as COGS slowly reducing from the average (80%) down to 78% by 2027. Both reductions are following the company's aim to reduce energy and operating costs in line with the 2030 net zero target. This is complemented by a slightly higher than average (4.2%) capital expenditure, starting at 5.0% by the end of 2023 and growing to 5.5% by 2027, highlighting the company's investments into renewable energy as well as energy efficiency. Finally, R&D costs are at a steady 6.0% of the revenue, higher than the previous average of 5.7%, following continued research into their hybrid-electric solutions within the Power Systems segment, development of the more efficient UltraFan jet engine, testing of sustainable aviation fuels, small modular reactors (SMRs) and hybrid and fully electric propulsion. These products are expected to be compatible with net-zero requirements by 2030, and all other products will reach this status by 2050. Rolls-Royce expects future investment required to deliver these technology.[13]
- The tax expense for the historical period was highly fluctuating and difficult to forecast in the same manner as other sections. Hence, a constant effective tax rate of 20% was applied throughout the forecast period, and used as the tax rate for the calculation of the WACC.
*independent sections refer to the group of sections that are required to fully characterise the income and cashflow statements. Explicitly, the independent sections are those for which the % revenue or effective rate has been calculated. For example, capital expenditure. EBITDA is not an independent section as it can be calculated from EBIT and D&A costs, the former of which is another dependent section.
Discount Rate Calculation edit edit source
| WACC | Notes | |
|---|---|---|
| Weights | ||
| Total Debt | 6079 | |
| Market Cap | 17599 | |
| Total | 23678 | |
| Wd | 26% | Weight of debt calculated as the total debt as a proportion of total capital. |
| We | 74% | Weight of equity calculated as the market cap as a proportion of total capital |
| Debt | ||
| Total Debt | 6079 | Cost of debt was calculated by taking interest expenses from the income statement and dividing this by the total debt making note of the fact that debt is a tax deductable item. |
| Interest Expense | -153 | |
| Rate | 2.5% | |
| Effective Tax Rate | 20% | |
| Rd(1-t) | 2.0% | |
| Equity | ||
| Risk Free Rate | 4.05% | Capital asset pricing model was used to calculate the cost of equity. Risk free rate of the US Treasury 10 Year was used. |
| Beta | 1.7 | Beta for the stock was found from Yahoo Finance |
| Market Rate | 10% | Current market rate was calculated as the average returns of the S&P 500 over the past 50 years. |
| Re | 14.2% | |
| Discount Rate | 11.0% | This is the value used for the WACC |
| Perpetuity Growth Rate | 2.0% | A perpetuity growth rate of 2% was used as this is sufficiently low to ensure that the company is not projected to increase in size far faster than the global economy in the very long term. |
| £ millions | 2023 | 2024 | 2025 | 2026 | 2027 | Terminal Value (Perpetuity Growth) | Notes | |
|---|---|---|---|---|---|---|---|---|
| 1319 | 1402 | 1548 | 1706 | 2003 | 22587 | The terminal value of the company was calculated using the Gordon Growth Model[14]. | ||
| FCF | ||||||||
| Present Value of FCF | 5763 |
|---|---|
| Terminal Value | 22587 |
| Net Present Value of TV | 13377 |
| Enterprise Value | 19140 |
| Net Debt | 1596 |
| Equity Value | 17544 |
| Shares Out | 8420 |
| Equity Value per Share | £2.08 |
| Current share price | £2.10 |
| Difference | -1% |
Sensitivity Analysis edit edit source
A sensitivity analysis was also conducted to reflect how changes in the discount rate and perpetuity growth rate would affect the intrinsic value of the company.
| £2.08 | Perpetuity Growth | |||||
|---|---|---|---|---|---|---|
| 1.0% | 1.5% | 2.0% | 2.5% | 3.0% | ||
| WACC | 9.5% | £2.32 | £2.44 | £2.58 | £2.74 | £2.92 |
| 10.0% | £2.17 | £2.28 | £2.40 | £2.53 | £2.69 | |
| 10.5% | £2.04 | £2.13 | £2.24 | £2.36 | £2.49 | |
| 11.0% | £1.91 | £1.99 | £2.08 | £2.18 | £2.30 | |
| 11.5% | £1.81 | £1.89 | £1.97 | £2.06 | £2.16 | |
| 12.0% | £1.72 | £1.78 | £1.85 | £1.93 | £2.02 | |
| 12.5% | £1.63 | £1.69 | £1.75 | £1.82 | £1.90 | |
Relative Valuation edit edit source
Trading comparable analysis was used to compare Rolls Royce to its competitors in the market. A range of different multiples are used to evaluate if the current share price of Rolls Royce is fairly priced or under/overvalued. [15]
| Market Cap | Price / Sales | Price/Earnings per Share | EV/EBITDA | EV/EBIT | PEG | Growth Adjusted P/S | |
|---|---|---|---|---|---|---|---|
| Rolls-Royce | 17.3B USD | 1.3 | -13.6 | 11.3 | 25.7 | - | 6.5 |
| Boeing Co | 139B USD | 1.9 | -31.2 | -115.5 | -50.9 | - | 3.6 |
| Raytheon Technologies | 123B USD | 1.7 | 22.1 | 14.8 | 24.9 | 24.3 | 6.5 |
| Airbus SE | 103B EUR | 1.8 | 29.5 | 14.9 | 24.3 | 46.1 | 4.3 |
| Lockheed Martin | 112B USD | 1.7 | 15.9 | 12.6 | 14.6 | 53.0 | 18.9 |
| Safran SA | 62.1B EUR | 3.2 | -25.2 | 15.2 | 22.9 | - | 6.7 |
| Northrop Grumman | 66.4B USD | 1.8 | 14.3 | 15.4 | 21 | -119.2 | 10.0 |
| General Dynamics | 61.2B USD | 1.5 | 18.2 | 13.5 | 16.4 | 55.2 | 7.5 |
| TransDigm Group | 49.2B USD | 8.3 | 51.3 | 23.3 | 25.7 | 37.4 | 18.9 |
| BAE Systems | 31.1B GBP | 1.5 | 19.5 | 11.5 | 15.5 | 52.7 | 5.2 |
| L3harris Technologies | 35.3B USD | 2 | 44 | 15.9 | 24.9 | 28.0 | 12.5 |
| Median | 1.8 | 18.2 | 14.8 | 22.9 | 41.8 | 6.7 | |
| Mean | 2.4 | 13.2 | 3.0 | 15.0 | 22.2 | 9.1 | |
| Lower Quartile | 1.6 | 0.4 | 12.1 | 16.0 | 27.1 | 5.8 | |
| Upper Quartile | 2.0 | 25.8 | 15.3 | 24.9 | 52.8 | 11.3 | |
| Maximum | 8.3 | 51.3 | 23.3 | 25.7 | 55.2 | 18.9 | |
| Minimum | 1.3 | -31.2 | -115.5 | -50.9 | -119.2 | 3.6 |
The valuation multiples are expressed in the bar charts with the industry median and the value of the respective multiple for Rolls Royce, highlighted using a dotted line.
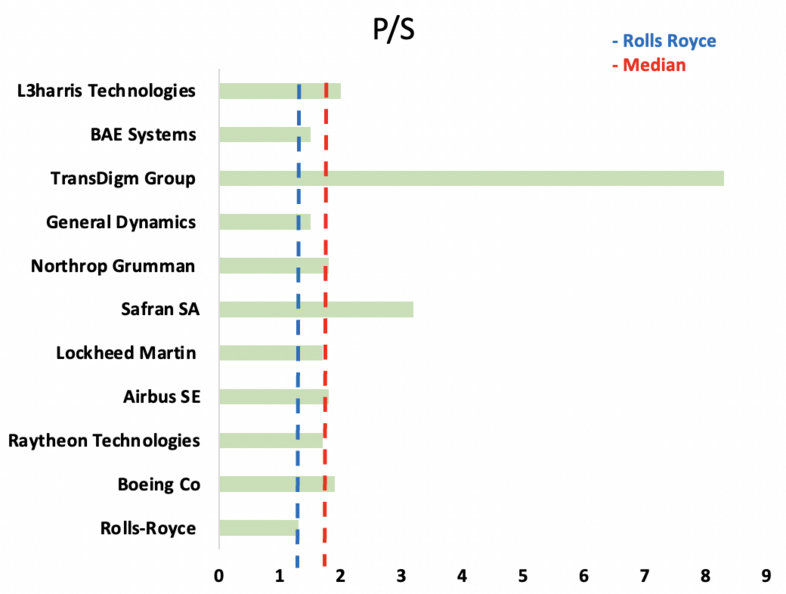
P/S – Price to Sales ratio evaluates how much an investor values each dollar of sale generated by the company. The average P/S ratio in the industry is 1.8 while the P/S ratio of Rolls Royce is 1.3. A low P/S ratio suggests that the investors are willing to pay a lower price per dollar of sale generated implying an undervaluation. The implied share price is GBX 291.05 whereas the trading share price as of 11/08/23 is GBX 207.90. [16]
Revenue of £ 13.5 billion [17]and 8.3 billion outstanding shares [18] in 2022 were considered in order to obtain the implied share price from the median P/S multiple.
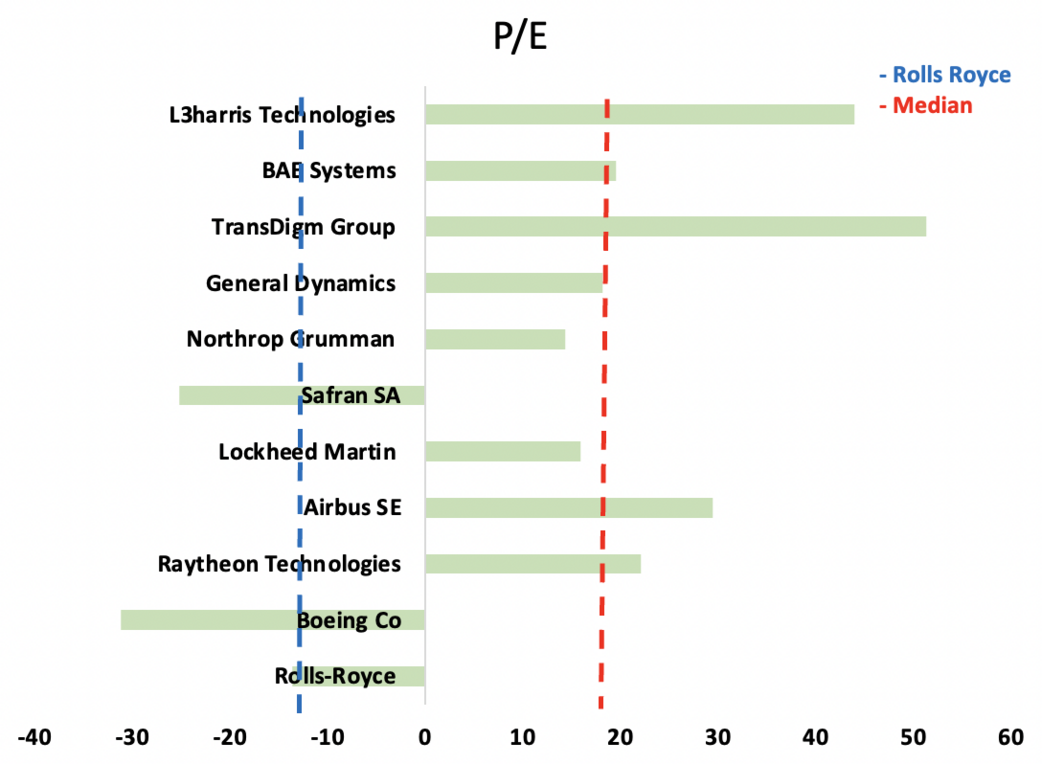
P/E – Price to Earnings ratio shows how much an investor is willing to pay per dollar of earnings generated. It portrays an investor’s expectation of the future earnings of the company. The average P/E ratio in the industry is 18.2 while the P/E ratio of Rolls Royce is -13.6. A low P/E ratio suggests that the investors are willing to pay a lower price per dollar of EPS generated implying an undervaluation. A negative P/E ratio results from the negative earnings per share. [19]
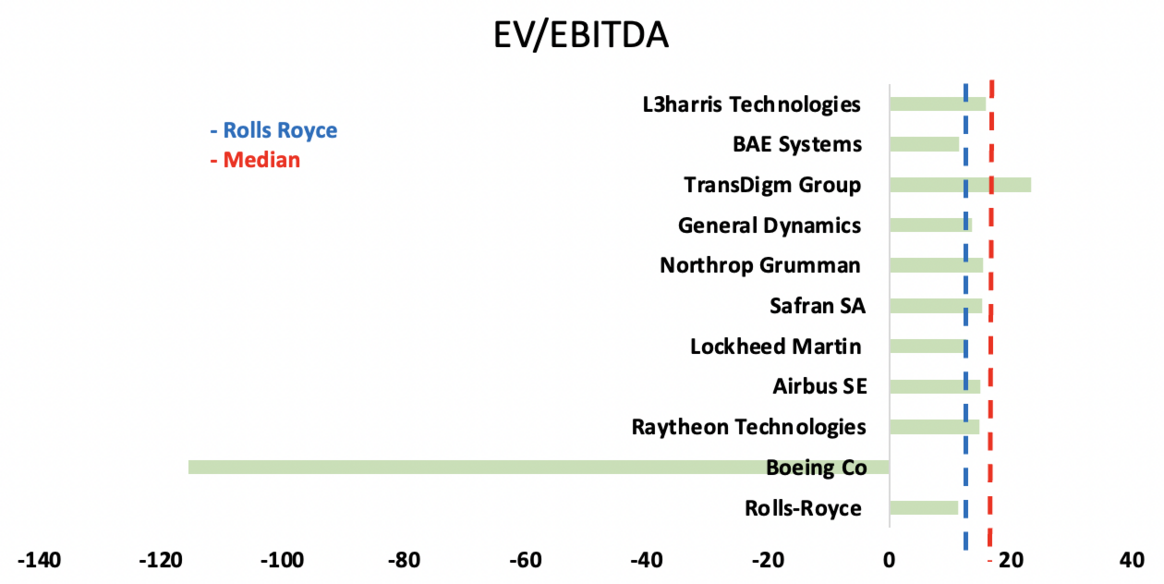
EV/EBITDA – The ratio evaluates the enterprise value of the company (considering all debts and liabilities) with respect to the operating performance of the company. The average EV/EBITDA ratio in the industry is 14.8 while the EV/EBITDA ratio of Rolls Royce is 11.3. A low EV/EBITDA ratio suggests an undervaluation. [20]
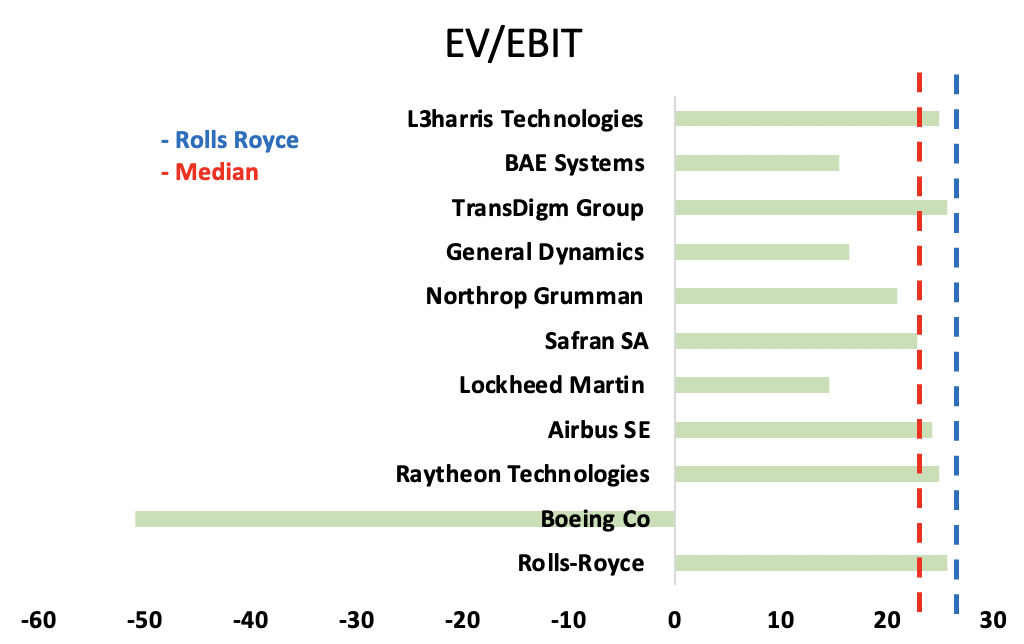
EV/EBIT – The ratio evaluates the enterprise value of the company (considering all debts and liabilities) with respect to the operating earnings of the company. The average EV/EBITDA ratio in the industry is 22.9 while the EV/EBITDA ratio of Rolls Royce is 25.7. A high EV/EBITDA ratio implies an overvaluation. [21]
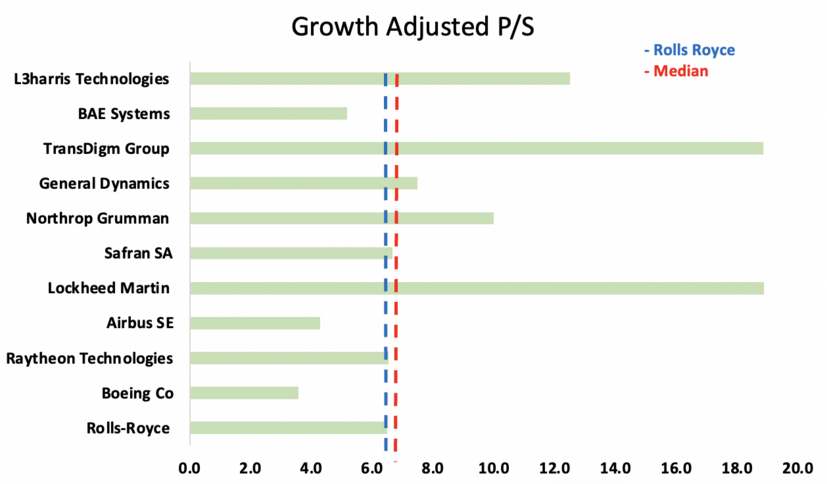
The growth adjusted P/S is the ratio of P/S to the growth in revenue. The growth adjusted P/S for Rolls Royce (6.5) is noticeably smaller than the industry median (6.7). The implied share price is GBX 215.59 while the share price as of 11/08/23 is GBX 207.90 implying an undervaluation.
Risks edit edit source
Debt & interest rates edit edit source
In 2021, Rolls Royce had a debt of £5.2 billion which reduced significantly to £3.3 billion. However, £1.49 billion (around 78%) of the total debt repayment was financed by the sale of ITP Aero and AirTanker shares. It is expected that the primary route Rolls Royce can take to further reduce its net debt is by selling more of its assets.
Higher debt can be very expensive especially as the interest rates continue to rise. [22]
Inflation edit edit source
Revenue of Rolls Royce is strongly linked to the growth of the airline industry. 44% of its income comes from the sale and servicing of civil airplane engines. High inflation is significantly denting consumer’s spending power especially on luxurious products and services including holidays abroad. [23]
New CEO edit edit source
Tufan Erginbilgic is appointed as the new CEO for Rolls Royce. He is a former executive at BP. He has been very transparent about the poor performance of the Rolls Royce compared to its competitors. The share price of Rolls Rise has dropped by two-thirds in the last 5 years. It is anticipated that under the leadership and restructuring plans of the new CEO, Rolls Royce will steer towards growth in the near future however there are concerns if Tufan Erginbilgic will be able to successfully implement his plans. [24]
High R&D costs edit edit source
To stay ahead of the competition, it is crucial for Rolls Royce to invest in researching and developing new technology that can be incorporated into its products. This often has high costs associated with it and significantly dents the company’s profits.
Failure to keep up with the latest technological advancements can result in the risk of falling behind in this competitive industry. [25]
Environmental Concerns edit edit source
Recently, the airline industry like many others aims to to reduce the carbon emission. Aircraft engines will play a crucial role in the transition towards more environment friendly air transport. Some of the earlier Rolls Royce products therefore need to be quickly replaced with more green products. [25]
UK defence quota edit edit source
Around 30% of Rolls Royce’s underlying revenue comes from the defence and military segment. It is anticipated that the demand for plane, boat, and submarine engines will fall from the Ministry of Defence considering the political factors and concerns over the rising public debt.
Liz Truss, former prime minister, aimed to spend 3% of GDP on defence by 2030 however this doesn’t seem to be the case after her term ended in Oct 2022. [23]
Currency edit edit source
Rolls Royce is a global company operating with many different currencies. It is vital for Rolls Royce to manage the risks related to exchange rates and the respective impact on its core financials and profitability. [25]
Competition edit edit source
Rolls Royce faces fierce competition from other industry players including: General Electric, Pratt & Whitney, and Siemens. Additionally, in the recent years, many new competitors have entered the market which puts pressure on pricing, reduces the market share for the market leaders and makes innovation extremely important for survival. [25]
Economy and Industry Downturns edit edit source
Recently, the profitability was significantly affected due to the Covid 19 pandemic, supply chain issues, Russia-Ukraine conflicts and other geopolitical tensions. All of these have a significant impact directly or indirectly (through the civil aerospace industry). [25]
References edit edit source
- ↑ https://www.rolls-royce.com/about/our-history.aspx
- ↑ https://www.rolls-royce.com/innovation/space.aspx
- ↑ https://www.rolls-royce.com/innovation/small-modular-reactors.aspx#/
- ↑ https://www.rolls-royce.com/innovation/net-zero/decarbonising-complex-critical-systems/hydrogen.aspx
- ↑ https://www.rolls-royce.com/media/our-stories/discover/2023/powering-urban-air-mobility.aspx
- ↑ https://www.spacex.com/vehicles/starship/
- ↑ https://www.jobyaviation.com/about/
- ↑ https://www.nuscalepower.com/en/products/voygr-smr-plants
- ↑ https://www.airbus.com/en/newsroom/stories/2023-06-at-airbus-hydrogen-power-gathers-pace
- ↑ https://www.rolls-royce.com/~/media/Files/R/Rolls-Royce/documents/investors/rr-plc-holdings-2023-half-year-results-press-release.pdf
- ↑ https://www.rolls-royce.com/~/media/Files/R/Rolls-Royce/documents/investors/rr-plc-holdings-2023-hy-results-presentation.pdf
- ↑ https://www.thetimes.co.uk/money-mentor/article/when-will-interest-rates-go-down-uk/#:~:text=So%20when%20will%20interest%20rates,over%20the%20next%20five%20years.
- ↑ https://www.rolls-royce.com/~/media/Files/R/Rolls-Royce/documents/investors/2022-full-year-results-press-release.pdf
- ↑ https://www.investopedia.com/terms/t/terminalvalue.asp
- ↑ https://www.alphaspread.com/security/otc/rycey/relative-valuation
- ↑ https://www.investopedia.com/terms/p/price-to-salesratio.asp
- ↑ https://uk.sports.yahoo.com/news/rolls-royce-holdings-full-2022-071927733.html
- ↑ https://www.macrotrends.net/stocks/charts/RYCEY/rolls-royce-holdings/shares-outstanding#:~:text=Rolls%2DRoyce%20Holdings%202022%20shares,a%2039.5%25%20increase%20from%202020.
- ↑ https://www.investopedia.com/terms/p/price-earningsratio.asp
- ↑ https://www.investopedia.com/terms/e/ev-ebitda.asp
- ↑ https://www.investopedia.com/terms/e/ebit-ev-multiple.asp
- ↑ https://investingreviews.co.uk/news/rolls-royce-shares-up-in-2023/
- ↑ 23.0 23.1 https://www.fool.co.uk/2022/10/24/4-big-reasons-to-avoid-rolls-royce-shares/
- ↑ https://www.theguardian.com/business/2023/jan/27/rolls-royce-is-a-burning-platform-that-must-transform-says-new-ceo
- ↑ 25.0 25.1 25.2 25.3 25.4 https://thestrategystory.com/blog/rolls-royce-swot-analysis/
Appendix edit edit source
Below is the income statement, balance sheet and cashflow statement, from which data for the intrinsic valuation was drawn. All values are in millions.
Note: Depreciation and Amort. was calculated as EBITDA - EBIT
| Income Statement | ||||||||
|---|---|---|---|---|---|---|---|---|
| For the Fiscal Period Ending | Reclassified
12 months Dec-31-2015 |
Reclassified
12 months Dec-31-2016 |
Restated
12 months Dec-31-2017 |
Reclassified
12 months Dec-31-2018 |
12 months
Dec-31-2019 |
Reclassified
12 months Dec-31-2020 |
12 months
Dec-31-2021 |
12 months
Dec-31-2022 |
| Currency | GBP | GBP | GBP | GBP | GBP | GBP | GBP | GBP |
| Revenue | 13,725.0 | 14,955.0 | 14,747.0 | 15,729.0 | 16,587.0 | 11,491.0 | 11,218.0 | 13,520.0 |
| Other Revenue | - | - | - | - | - | - | - | - |
| Total Revenue | 13,725.0 | 14,955.0 | 14,747.0 | 15,729.0 | 16,587.0 | 11,491.0 | 11,218.0 | 13,520.0 |
| Cost Of Goods Sold | 10,448.0 | 11,876.0 | 12,325.0 | 14,531.0 | 15,645.0 | 10,378.0 | 9,082.0 | 10,763.0 |
| Gross Profit | 3,277.0 | 3,079.0 | 2,422.0 | 1,198.0 | 942.0 | 1,113.0 | 2,136.0 | 2,757.0 |
| Selling General & Admin Exp. | 1,038.0 | 1,765.0 | 1,117.0 | 1,572.0 | 1,105.0 | 772.0 | 893.0 | 1,079.0 |
| R & D Exp. | 818.0 | 923.0 | 843.0 | 768.0 | 770.0 | 723.0 | 778.0 | 891.0 |
| Depreciation & Amort. | - | - | - | - | - | - | - | - |
| Other Operating Expense/(Income) | (10.0) | - | - | - | - | - | - | - |
| Other Operating Exp., Total | 1,846.0 | 2,688.0 | 1,960.0 | 2,340.0 | 1,875.0 | 1,495.0 | 1,671.0 | 1,970.0 |
| Operating Income | 1,431.0 | 391.0 | 462.0 | (1,142.0) | (933.0) | (382.0) | 465.0 | 787.0 |
| Interest Expense | (71.0) | (77.0) | (67.0) | (107.0) | (168.0) | (253.0) | (252.0) | (153.0) |
| Interest and Invest. Income | 12.0 | 14.0 | 11.0 | 27.0 | 31.0 | 21.0 | 7.0 | 35.0 |
| Net Interest Exp. | (59.0) | (63.0) | (56.0) | (80.0) | (137.0) | (232.0) | (245.0) | (118.0) |
| Income/(Loss) from Affiliates | 100.0 | 117.0 | 9.0 | 4.0 | 104.0 | 190.0 | 45.0 | 48.0 |
| Currency Exchange Gains (Loss) | 25.0 | (153.0) | 208.0 | 161.0 | 101.0 | (332.0) | 55.0 | (365.0) |
| Other Non-Operating Inc. (Exp.) | (33.0) | (44.0) | (54.0) | (104.0) | (158.0) | (163.0) | (132.0) | (166.0) |
| EBT Excl. Unusual Items | 1,464.0 | 248.0 | 569.0 | (1,161.0) | (1,023.0) | (919.0) | 188.0 | 186.0 |
| Restructuring Charges | - | (129.0) | (104.0) | - | - | - | - | - |
| Impairment of Goodwill | - | - | 785.0 | - | - | - | - | - |
| Gain (Loss) On Sale Of Assets | 2.0 | (3.0) | - | 358.0 | 139.0 | (14.0) | 56.0 | 81.0 |
| Asset Writedown | - | (2.0) | - | - | - | (481.0) | - | - |
| Other Unusual Items | (1,306.0) | (4,750.0) | 2,648.0 | (2,144.0) | (7.0) | (1,385.0) | (538.0) | (1,769.0) |
| EBT Incl. Unusual Items | 160.0 | (4,636.0) | 3,898.0 | (2,947.0) | (891.0) | (2,799.0) | (294.0) | (1,502.0) |
| Income Tax Expense | 76.0 | (604.0) | 515.0 | (554.0) | 420.0 | 302.0 | (418.0) | (308.0) |
| Earnings from Cont. Ops. | 84.0 | (4,032.0) | 3,383.0 | (2,393.0) | (1,311.0) | (3,101.0) | 124.0 | (1,194.0) |
| Earnings of Discontinued Ops. | - | - | - | - | - | (68.0) | (3.0) | (80.0) |
| Extraord. Item & Account. Change | - | - | - | - | - | - | - | - |
| Net Income to Company | 84.0 | (4,032.0) | 3,383.0 | (2,393.0) | (1,311.0) | (3,169.0) | 121.0 | (1,274.0) |
| Minority Int. in Earnings | (1.0) | - | (1.0) | (8.0) | (4.0) | (1.0) | (1.0) | 5.0 |
| Net Income | 83.0 | (4,032.0) | 3,382.0 | (2,401.0) | (1,315.0) | (3,170.0) | 120.0 | (1,269.0) |
| Pref. Dividends and Other Adj. | - | - | - | - | - | - | - | - |
| NI to Common Incl Extra Items | 83.0 | (4,032.0) | 3,382.0 | (2,401.0) | (1,315.0) | (3,170.0) | 120.0 | (1,269.0) |
| NI to Common Excl. Extra Items | 83.0 | (4,032.0) | 3,382.0 | (2,401.0) | (1,315.0) | (3,102.0) | 123.0 | (1,189.0) |
| Per Share Items | ||||||||
| Basic EPS | 0.05 | (2.2) | 1.84 | (1.29) | (0.69) | (0.53) | 0.01 | (0.15) |
| Basic EPS Excl. Extra Items | 0.05 | (2.2) | 1.84 | (1.29) | (0.69) | (0.52) | 0.01 | (0.14) |
| Weighted Avg. Basic Shares Out. | 1,839.0 | 1,832.0 | 1,834.0 | 1,859.0 | 1,903.9 | 5,987.0 | 8,332.0 | 8,349.0 |
| Diluted EPS | 0.04 | (2.2) | 1.84 | (1.29) | (0.69) | (0.53) | 0.01 | (0.15) |
| Diluted EPS Excl. Extra Items | 0.04 | (2.2) | 1.84 | (1.29) | (0.69) | (0.52) | 0.01 | (0.14) |
| Weighted Avg. Diluted Shares Out. | 1,851.0 | 1,832.0 | 1,840.0 | 1,859.0 | 1,903.9 | 5,987.0 | 8,352.0 | 8,349.0 |
| Normalized Basic EPS | 0.5 | 0.08 | 0.19 | (0.39) | (0.34) | (0.1) | 0.01 | 0.01 |
| Normalized Diluted EPS | 0.49 | 0.08 | 0.19 | (0.39) | (0.34) | (0.1) | 0.01 | 0.01 |
| Dividends per Share | 0.16 | 0.12 | 0.12 | 0.12 | 0.05 | NA | NA | NA |
| Payout Ratio % | 507.2% | NM | 6.3% | NM | NM | NM | 2.5% | NM |
| Shares per Depository Receipt | 1.0 | 1.0 | 1.0 | 1.0 | 1.0 | 1.0 | 1.0 | 1.0 |
| Supplemental Items | ||||||||
| EBITDA | 1,943.0 | 929.0 | 986.0 | (499.0) | (344.0) | 222.0 | 996.0 | 1,285.0 |
| EBITA | 1,570.0 | 505.0 | 542.0 | (1,013.0) | (835.0) | (267.0) | 553.0 | 855.0 |
| EBIT | 1,431.0 | 391.0 | 462.0 | (1,142.0) | (933.0) | (382.0) | 465.0 | 787.0 |
| EBITDAR | 2,164.0 | 1,118.0 | 1,227.0 | NA | (320.0) | 241.0 | 1,014.0 | 1,315.0 |
| Effective Tax Rate % | 47.5% | NM | 13.2% | NM | NM | NM | NM | NM |
| Current Domestic Taxes | 15.0 | 4.0 | 33.0 | 0 | 11.0 | 12.0 | 19.0 | 13.0 |
| Current Foreign Taxes | 134.0 | 191.0 | 234.0 | 182.0 | 225.0 | 135.0 | 163.0 | 151.0 |
| Total Current Taxes | 149.0 | 195.0 | 267.0 | 182.0 | 236.0 | 147.0 | 182.0 | 164.0 |
| Deferred Domestic Taxes | (45.0) | (779.0) | 201.0 | (608.0) | 223.0 | 440.0 | (515.0) | (423.0) |
| Deferred Foreign Taxes | (28.0) | (20.0) | 47.0 | (128.0) | (39.0) | (285.0) | (85.0) | (49.0) |
| Total Deferred Taxes | (73.0) | (799.0) | 248.0 | (736.0) | 184.0 | 155.0 | (600.0) | (472.0) |
| Normalized Net Income | 914.0 | 155.0 | 354.6 | (733.6) | (643.4) | (575.4) | 116.5 | 121.3 |
| Interest on Long Term Debt | NA | NA | NA | NA | 88.0 | 74.0 | 63.0 | 68.0 |
| Non-Cash Pension Expense | 181.0 | 507.0 | 239.0 | 329.0 | 199.0 | (67.0) | 26.0 | 29.0 |
| Filing Date | Mar-09-2017 | Mar-27-2018 | Mar-25-2019 | Mar-26-2020 | Mar-11-2021 | Mar-01-2022 | Mar-02-2023 | Mar-02-2023 |
| Restatement Type | RC | RC | RS | RC | NC | RD | NC | O |
| Calculation Type | REP | REP | REP | REP | REP | REP | REP | REP |
| Supplemental Operating Expense Items | ||||||||
| R&D Exp. | 818.0 | 918.0 | 843.0 | 768.0 | 1,111.0 | 1,557.0 | 1,144.0 | 1,250.0 |
| Net Rental Exp. | 221.0 | 189.0 | 241.0 | NA | 24.0 | 19.0 | 18.0 | 30.0 |
| Imputed Oper. Lease Interest Exp. | 44.0 | 34.3 | 37.4 | - | 6.2 | 5.8 | 4.7 | 5.3 |
| Imputed Oper. Lease Depreciation | 177.0 | 154.7 | 203.6 | - | 17.8 | 13.2 | 13.3 | 24.7 |
| Stock-Based Comp., Unallocated | 5.0 | 35.0 | 34.0 | 35.0 | 30.0 | 25.0 | 28.0 | 47.0 |
| Stock-Based Comp., Total | 5.0 | 35.0 | 34.0 | 35.0 | 30.0 | 25.0 | 28.0 | 47.0 |
| Balance Sheet | ||||||||
|---|---|---|---|---|---|---|---|---|
| Balance Sheet as of: | Dec-31-2015 | Dec-31-2016 | Restated
Dec-31-2017 |
Dec-31-2018 | Dec-31-2019 | Dec-31-2020 | Reclassified
Dec-31-2021 |
Dec-31-2022 |
| Currency | GBP | GBP | GBP | GBP | GBP | GBP | GBP | GBP |
| ASSETS | ||||||||
| Cash And Equivalents | 3,176.0 | 2,771.0 | 2,953.0 | 4,974.0 | 4,443.0 | 3,452.0 | 2,621.0 | 2,607.0 |
| Short Term Investments | 2.0 | 3.0 | 3.0 | 6.0 | 6.0 | - | 8.0 | 11.0 |
| Trading Asset Securities | - | - | - | 4.0 | 49.0 | 42.0 | - | 2.0 |
| Total Cash & ST Investments | 3,178.0 | 2,774.0 | 2,956.0 | 4,984.0 | 4,498.0 | 3,494.0 | 2,629.0 | 2,620.0 |
| Accounts Receivable | 4,791.0 | 5,459.0 | 4,654.0 | 4,737.0 | 4,525.0 | 3,989.0 | 3,666.0 | 3,900.0 |
| Other Receivables | 1,281.0 | 1,332.0 | 1,402.0 | 1,626.0 | 2,025.0 | 2,194.0 | 2,276.0 | 2,786.0 |
| Total Receivables | 6,072.0 | 6,791.0 | 6,056.0 | 6,363.0 | 6,550.0 | 6,183.0 | 5,942.0 | 6,686.0 |
| Inventory | 2,637.0 | 3,086.0 | 3,803.0 | 4,287.0 | 4,320.0 | 3,690.0 | 3,666.0 | 4,708.0 |
| Prepaid Exp. | 195.0 | 197.0 | 208.0 | 376.0 | 604.0 | 837.0 | 950.0 | 1,779.0 |
| Other Current Assets | 34.0 | 10.0 | 94.0 | 810.0 | 100.0 | 415.0 | 2,128.0 | 218.0 |
| Total Current Assets | 12,116.0 | 12,858.0 | 13,117.0 | 16,820.0 | 16,072.0 | 14,619.0 | 15,315.0 | 16,011.0 |
| Gross Property, Plant & Equipment | 6,315.0 | 7,520.0 | 8,369.0 | 8,894.0 | 11,182.0 | 11,334.0 | 10,573.0 | 11,047.0 |
| Accumulated Depreciation | (2,825.0) | (3,406.0) | (3,711.0) | (3,965.0) | (4,370.0) | (5,414.0) | (5,453.0) | (6,050.0) |
| Net Property, Plant & Equipment | 3,490.0 | 4,114.0 | 4,658.0 | 4,929.0 | 6,812.0 | 5,920.0 | 5,120.0 | 4,997.0 |
| Long-term Investments | 689.0 | 1,246.0 | 633.0 | 726.0 | 619.0 | 671.0 | 616.0 | 894.0 |
| Goodwill | 1,503.0 | 1,537.0 | 1,545.0 | 1,045.0 | 994.0 | 1,074.0 | 1,026.0 | 1,099.0 |
| Other Intangibles | 1,331.0 | 1,602.0 | 2,028.0 | 1,903.0 | 1,785.0 | 1,776.0 | 874.0 | 819.0 |
| Deferred Tax Assets, LT | 318.0 | 876.0 | 1,451.0 | 2,092.0 | 1,887.0 | 1,826.0 | 2,249.0 | 2,731.0 |
| Deferred Charges, LT | 1,811.0 | 1,941.0 | 1,992.0 | 2,347.0 | 2,663.0 | 2,295.0 | 2,141.0 | 2,180.0 |
| Other Long-Term Assets | 1,066.0 | 1,364.0 | 2,503.0 | 1,995.0 | 1,434.0 | 1,336.0 | 1,333.0 | 719.0 |
| Total Assets | 22,324.0 | 25,538.0 | 27,927.0 | 31,857.0 | 32,266.0 | 29,517.0 | 28,674.0 | 29,450.0 |
| LIABILITIES | ||||||||
| Accounts Payable | 1,397.0 | 2,249.0 | 2,057.0 | 3,155.0 | 2,822.0 | 2,001.0 | 1,758.0 | 2,302.0 |
| Accrued Exp. | 2,054.0 | 2,219.0 | 1,578.0 | 1,798.0 | 1,840.0 | 1,449.0 | 1,401.0 | 1,565.0 |
| Short-term Borrowings | - | - | 20.0 | 22.0 | 8.0 | 307.0 | 7.0 | 2.0 |
| Curr. Port. of LT Debt | 446.0 | 197.0 | 67.0 | 831.0 | 458.0 | 745.0 | 27.0 | 27.0 |
| Curr. Port. of Leases | 2.0 | 3.0 | 23.0 | 34.0 | 340.0 | 259.0 | 270.0 | 355.0 |
| Curr. Income Taxes Payable | 164.0 | 211.0 | 209.0 | 138.0 | 172.0 | 154.0 | 101.0 | 104.0 |
| Unearned Revenue, Current | 1,491.0 | 1,246.0 | 4,124.0 | 3,808.0 | 4,240.0 | 4,203.0 | 3,627.0 | 4,846.0 |
| Other Current Liabilities | 2,619.0 | 3,409.0 | 4,353.0 | 5,441.0 | 5,111.0 | 4,810.0 | 3,968.0 | 4,717.0 |
| Total Current Liabilities | 8,173.0 | 9,534.0 | 12,431.0 | 15,227.0 | 14,991.0 | 13,928.0 | 11,159.0 | 13,918.0 |
| Long-Term Debt | 2,900.0 | 3,127.0 | 3,297.0 | 3,613.0 | 2,905.0 | 4,387.0 | 6,105.0 | 4,203.0 |
| Long-Term Leases | 50.0 | 64.0 | 114.0 | 195.0 | 2,014.0 | 1,784.0 | 1,474.0 | 1,492.0 |
| Unearned Revenue, Non-Current | 516.0 | 1,024.0 | 3,689.0 | 5,421.0 | 6,683.0 | 6,311.0 | 6,749.0 | 7,378.0 |
| Pension & Other Post-Retire. Benefits | 1,140.0 | 1,375.0 | 1,387.0 | 1,303.0 | 1,378.0 | 1,580.0 | 1,373.0 | 1,033.0 |
| Def. Tax Liability, Non-Curr. | 839.0 | 776.0 | 1,071.0 | 962.0 | 618.0 | 494.0 | 451.0 | 286.0 |
| Other Non-Current Liabilities | 3,690.0 | 7,774.0 | 5,005.0 | 6,188.0 | 7,031.0 | 5,908.0 | 5,999.0 | 7,156.0 |
| Total Liabilities | 17,308.0 | 23,674.0 | 26,994.0 | 32,909.0 | 35,620.0 | 34,392.0 | 33,310.0 | 35,466.0 |
| Common Stock | 367.0 | 367.0 | 368.0 | 379.0 | 386.0 | 1,674.0 | 1,674.0 | 1,674.0 |
| Additional Paid In Capital | 180.0 | 181.0 | 195.0 | 268.0 | 319.0 | 1,012.0 | 1,012.0 | 1,012.0 |
| Retained Earnings | 4,405.0 | 389.0 | (395.0) | (3,114.0) | (5,299.0) | (8,914.0) | (8,525.0) | (9,816.0) |
| Treasury Stock | - | - | - | - | - | - | - | - |
| Comprehensive Inc. and Other | 62.0 | 925.0 | 762.0 | 1,393.0 | 1,218.0 | 1,331.0 | 1,177.0 | 1,080.0 |
| Total Common Equity | 5,014.0 | 1,862.0 | 930.0 | (1,074.0) | (3,376.0) | (4,897.0) | (4,662.0) | (6,050.0) |
| Minority Interest | 2.0 | 2.0 | 3.0 | 22.0 | 22.0 | 22.0 | 26.0 | 34.0 |
| Total Equity | 5,016.0 | 1,864.0 | 933.0 | (1,052.0) | (3,354.0) | (4,875.0) | (4,636.0) | (6,016.0) |
| Total Liabilities And Equity | 22,324.0 | 25,538.0 | 27,927.0 | 31,857.0 | 32,266.0 | 29,517.0 | 28,674.0 | 29,450.0 |
| Supplemental Items | ||||||||
| Total Shares Out. on Filing Date | 1,838.0 | 1,838.8 | 1,840.0 | 1,895.7 | 1,918.5 | 8,327.7 | 8,338.2 | 8,356.2 |
| Total Shares Out. on Balance Sheet Date | 1,838.0 | 1,838.8 | 1,840.0 | 1,895.7 | 1,918.5 | 8,327.7 | 8,338.2 | 8,356.2 |
| Book Value/Share | 2.73 | 1.01 | 0.51 | (0.57) | (1.76) | (0.59) | (0.56) | (0.72) |
| Tangible Book Value | 2,180.0 | (1,277.0) | (2,643.0) | (4,022.0) | (6,155.0) | (7,747.0) | (6,562.0) | (7,968.0) |
| Tangible Book Value/Share | 1.19 | (0.69) | (1.44) | (2.12) | (3.21) | (0.93) | (0.79) | (0.95) |
| Total Debt | 3,398.0 | 3,391.0 | 3,521.0 | 4,695.0 | 5,725.0 | 7,482.0 | 7,883.0 | 6,079.0 |
| Net Debt | 220.0 | 617.0 | 565.0 | (289.0) | 1,227.0 | 3,988.0 | 5,254.0 | 3,459.0 |
| Debt Equiv. of Unfunded Proj. Benefit Obligation | (349.0) | (468.0) | (1,198.0) | (1,060.0) | (212.0) | 217.0 | (175.0) | 87.0 |
| Debt Equivalent Oper. Leases | 1,768.0 | 1,512.0 | 1,928.0 | NA | 192.0 | 152.0 | 144.0 | 240.0 |
| Total Minority Interest | 2.0 | 2.0 | 3.0 | 22.0 | 22.0 | 22.0 | 26.0 | 34.0 |
| Equity Method Investments | 576.0 | 844.0 | 375.0 | 412.0 | 402.0 | 394.0 | 404.0 | 422.0 |
| Inventory Method | FIFO | FIFO | NA | NA | FIFO | FIFO | FIFO | FIFO |
| Raw Materials Inventory | 509.0 | 529.0 | 558.0 | 553.0 | 522.0 | 417.0 | 376.0 | 479.0 |
| Work in Progress Inventory | 905.0 | 1,217.0 | 1,398.0 | 1,551.0 | 1,652.0 | 1,139.0 | 1,135.0 | 1,633.0 |
| Finished Goods Inventory | 1,173.0 | 1,312.0 | 1,818.0 | 2,168.0 | 2,119.0 | 2,111.0 | 2,146.0 | 2,593.0 |
| Other Inventory Accounts | 50.0 | 28.0 | 29.0 | 15.0 | 27.0 | 23.0 | 9.0 | 3.0 |
| Land | 1,375.0 | 1,667.0 | 1,842.0 | 1,916.0 | 2,020.0 | 1,994.0 | 1,865.0 | 1,936.0 |
| Machinery | 4,233.0 | 5,090.0 | 5,756.0 | 6,263.0 | 6,373.0 | 6,467.0 | 6,032.0 | 6,224.0 |
| Construction in Progress | 707.0 | 763.0 | 771.0 | 715.0 | 390.0 | 443.0 | 292.0 | 392.0 |
| Full Time Employees | 50,000 | 49,900 | 50,000 | 54,500 | 51,700 | 48,200 | 44,000 | 41,800 |
| Order Backlog | 76,399.0 | 80,910.0 | 55,000.0 | 63,100.0 | 60,900.0 | 52,900.0 | 50,600.0 | 60,200.0 |
| Filing Date | Mar-09-2017 | Mar-27-2018 | Mar-25-2019 | Mar-26-2020 | Mar-11-2021 | Mar-01-2022 | Mar-02-2023 | Mar-02-2023 |
| Restatement Type | NC | NC | RS | NC | NC | NC | RC | O |
| Calculation Type | REP | REP | REP | REP | REP | REP | REP | REP |
| Cash Flow | ||||||||
|---|---|---|---|---|---|---|---|---|
| For the Fiscal Period Ending | 12 months
Dec-31-2015 |
12 months
Dec-31-2016 |
Restated
12 months Dec-31-2017 |
12 months
Dec-31-2018 |
12 months
Dec-31-2019 |
Reclassified
12 months Dec-31-2020 |
12 months
Dec-31-2021 |
12 months
Dec-31-2022 |
| Currency | GBP | GBP | GBP | GBP | GBP | GBP | GBP | GBP |
| Net Income | 83.0 | (4,032.0) | 3,382.0 | (2,401.0) | (1,315.0) | (3,170.0) | 120.0 | (1,269.0) |
| Depreciation & Amort. | 373.0 | 424.0 | 444.0 | 514.0 | 890.0 | 835.0 | 715.0 | 700.0 |
| Amort. of Goodwill and Intangibles | 139.0 | 114.0 | 80.0 | 129.0 | 98.0 | 115.0 | 88.0 | 68.0 |
| Depreciation & Amort., Total | 512.0 | 538.0 | 524.0 | 643.0 | 988.0 | 950.0 | 803.0 | 768.0 |
| Other Amortization | 268.0 | 292.0 | 263.0 | 252.0 | 220.0 | 208.0 | 193.0 | 184.0 |
| (Gain) Loss From Sale Of Assets | 8.0 | 5.0 | 11.0 | 11.0 | (13.0) | 37.0 | 9.0 | 18.0 |
| (Gain) Loss On Sale Of Invest. | 2.0 | - | 14.0 | 6.0 | 1.0 | 24.0 | 7.0 | 75.0 |
| Asset Writedown & Restructuring Costs | 30.0 | 224.0 | 6.0 | 191.0 | 107.0 | 1,297.0 | 13.0 | 52.0 |
| (Income) Loss on Equity Invest. | (100.0) | (117.0) | (9.0) | (4.0) | (104.0) | (191.0) | (45.0) | (48.0) |
| Stock-Based Compensation | 5.0 | 35.0 | 34.0 | 35.0 | 30.0 | 25.0 | 28.0 | 47.0 |
| Net Cash From Discontinued Ops. | - | - | - | - | - | (109.0) | (43.0) | 86.0 |
| Other Operating Activities | 1,060.0 | 3,722.0 | (3,126.0) | 1,268.0 | 265.0 | 655.0 | (55.0) | 1,984.0 |
| Change in Acc. Receivable | (836.0) | 54.0 | (239.0) | (581.0) | 1,810.0 | (2,396.0) | (641.0) | 1,697.0 |
| Change In Inventories | 63.0 | (161.0) | (194.0) | (616.0) | (43.0) | 588.0 | (169.0) | (887.0) |
| Change in Acc. Payable | 242.0 | 234.0 | 398.0 | 1,732.0 | - | - | - | - |
| Change in Unearned Rev. | - | - | 1,399.0 | 1,419.0 | - | - | - | - |
| Change in Other Net Operating Assets | (243.0) | 617.0 | (951.0) | 271.0 | 351.0 | (927.0) | (479.0) | (857.0) |
| Cash from Ops. | 1,094.0 | 1,411.0 | 1,512.0 | 2,226.0 | 2,297.0 | (3,009.0) | (259.0) | 1,850.0 |
| Capital Expenditure | (487.0) | (585.0) | (730.0) | (905.0) | (747.0) | (585.0) | (328.0) | (359.0) |
| Sale of Property, Plant, and Equipment | 33.0 | 8.0 | 4.0 | 43.0 | 50.0 | 23.0 | 61.0 | 48.0 |
| Cash Acquisitions | (5.0) | (6.0) | 263.0 | - | (43.0) | (106.0) | - | - |
| Divestitures | 2.0 | 7.0 | - | 573.0 | 453.0 | 23.0 | 99.0 | 1,398.0 |
| Sale (Purchase) of Intangible assets | (404.0) | (623.0) | (640.0) | (667.0) | (627.0) | (347.0) | (226.0) | (229.0) |
| Invest. in Marketable & Equity Securt. | (21.0) | (179.0) | (51.0) | (19.0) | (4.0) | (18.0) | (34.0) | (32.0) |
| Net (Inc.) Dec. in Loans Originated/Sold | - | - | - | - | - | - | - | - |
| Other Investing Activities | (113.0) | 15.0 | - | - | - | - | - | - |
| Cash from Investing | (995.0) | (1,363.0) | (1,154.0) | (975.0) | (918.0) | (1,010.0) | (428.0) | 826.0 |
| Short Term Debt Issued | - | - | - | - | - | - | - | - |
| Long-Term Debt Issued | 1,150.0 | 93.0 | 309.0 | 1,054.0 | 22.0 | 4,774.0 | 2,005.0 | 1.0 |
| Total Debt Issued | 1,150.0 | 93.0 | 309.0 | 1,054.0 | 22.0 | 4,774.0 | 2,005.0 | 1.0 |
| Short Term Debt Repaid | - | - | - | - | - | - | - | - |
| Long-Term Debt Repaid | (55.0) | (438.0) | (166.0) | (60.0) | (1,407.0) | (3,168.0) | (1,339.0) | (2,242.0) |
| Total Debt Repaid | (55.0) | (438.0) | (166.0) | (60.0) | (1,407.0) | (3,168.0) | (1,339.0) | (2,242.0) |
| Issuance of Common Stock | 32.0 | 1.0 | 21.0 | 1.0 | 24.0 | 1,972.0 | - | - |
| Repurchase of Common Stock | (435.0) | (21.0) | (24.0) | (1.0) | (15.0) | (1.0) | - | - |
| Common Dividends Paid | (421.0) | (301.0) | (214.0) | (216.0) | (220.0) | (91.0) | (3.0) | (1.0) |
| Total Dividends Paid | (421.0) | (301.0) | (214.0) | (216.0) | (220.0) | (91.0) | (3.0) | (1.0) |
| Special Dividend Paid | - | - | - | - | - | - | - | - |
| Other Financing Activities | (50.0) | (73.0) | (53.0) | (76.0) | (196.0) | (462.0) | (751.0) | (624.0) |
| Cash from Financing | 221.0 | (739.0) | (127.0) | 702.0 | (1,792.0) | 3,024.0 | (88.0) | (2,866.0) |
| Foreign Exchange Rate Adj. | (6.0) | 286.0 | (69.0) | 66.0 | (104.0) | 56.0 | (82.0) | 156.0 |
| Net Change in Cash | 314.0 | (405.0) | 162.0 | 2,019.0 | (517.0) | (939.0) | (857.0) | (34.0) |
| Supplemental Items | ||||||||
| Cash Interest Paid | 60.0 | 86.0 | 67.0 | 97.0 | 192.0 | 162.0 | 269.0 | 303.0 |
| Cash Taxes Paid | 160.0 | 157.0 | 180.0 | 248.0 | 175.0 | 231.0 | 185.0 | 174.0 |
| Levered Free Cash Flow | 255.0 | 316.3 | 2,607.9 | (1,078.6) | (717.1) | (1,264.9) | (2,719.9) | 2,781.3 |
| Unlevered Free Cash Flow | 299.4 | 364.4 | 2,649.8 | (1,011.8) | (612.1) | (1,106.8) | (2,562.4) | 2,876.9 |
| Change in Net Working Capital | 489.0 | (463.0) | (2,910.0) | (344.0) | (107.0) | 1,119.0 | 3,323.0 | (1,974.0) |
| Net Debt Issued | 1,095.0 | (345.0) | 143.0 | 994.0 | (1,385.0) | 1,606.0 | 666.0 | (2,241.0) |
| Net Cash From Discontinued Ops. - Investing | (121.0) | - | - | - | - | - | - | - |
| Filing Date | Mar-09-2017 | Mar-27-2018 | Mar-25-2019 | Mar-26-2020 | Mar-11-2021 | Mar-01-2022 | Mar-02-2023 | Mar-02-2023 |
| Restatement Type | NC | NC | RS | NC | NC | RD | NC | O |
| Calculation Type | REP | REP | REP | REP | REP | REP | REP | REP |