Safran SA
 | |
 | |
| Type | Société Anonyme |
|---|---|
| Euronext: SAF CAC 40 Component | |
| Industry | Aerospace Defense |
| Predecessor | Snecma, Sagem |
| Founded | 2005 |
| Headquarters | , |
Key people | Olivier Andriès (CEO) Ross McInnes (Chairman) |
| Products | Aircraft engines, equipment, and interiors, defence electronics, avionics, navigation system, communications systems, satellites |
| Revenue | |
| Total assets | |
| Total equity | |
Number of employees | 81,000 (2020) |
| Subsidiaries | OEMServices Safran Aero Boosters Safran Aerosystems Safran Aircraft Engines Safran Cabin Safran Ceramics Safran Electrical & Power Safran Electronics & Defense Safran Helicopter Engines Safran Landing Systems Safran Nacelles Safran Passenger Solutions Safran Seats Safran Transmission Systems ArianeGroup (50% ownership) |
| Website | |
Safran is committed to catalyzing aviation safety and sustainability with innovative solutions.[1]
The company is renowned for its commitment to innovation and excellence. Operating across aircraft propulsion, aircraft equipment, and defense segments, Safran delivers cutting-edge solutions that cater to the evolving needs of the aviation and defense industries worldwide. With a strong focus on research and development, the company continuously pushes the boundaries of technology, striving to enhance the performance, efficiency, and sustainability of its products while fostering collaborative industry partnerships to drive progress in these domains.[1]
Assuming that Safran implements certain growth strategies and other relevant assumptions, the expected return of an investment in the company over the next five years is approximately 5.21%. This translates to an annual return of around 1.04%. In practical terms, a £100,000 investment in Safran is projected to grow to approximately £105,210 in five years' time.
Operations edit edit source
Company history[2] edit edit source
- 1896: Maurice Mallet, Antonino Mélandri, and Paul Simard de Pitray found "Mallet, Mélandri et de Pitray," later merged with Zodiac in 2018.
- 1905: The Seguin brothers establish "Société des moteurs Gnome" for rotary airplane engines, leading to the merger with "Société des moteurs Le Rhône" in 1915, thus forming "Société des Moteurs Gnome & Rhône."
- 1911: Hispano-Suiza settles in Levallois, France, producing automobiles and later venturing into aircraft engine manufacturing.
- 1920: Messier Automobiles is founded, evolving into SFMA and later Messier, specializing in aircraft landing gear.
- 1930: Messier achieves a major milestone by developing the world's first automatic aircraft brake.
- 1938: Joseph Szydlowski establishes Turbomeca, specializing in aircraft engine compressors.
- 1945: Gnome & Rhône is nationalized and renamed Snecma (Société Nationale d'Etude et de Construction de Moteurs d'Aviation), consolidating most French aero-engine manufacturers.
- 1955: Turbomeca's "Artouste" engine powers the Alouette II, the world's first mass-produced turbine helicopter.
- 1961: Sagem achieves a significant milestone with the successful flight of the first French satellite, guided by their innovative inertial reference system.
- 1968: Hispano-Suiza joins Snecma, adding its expertise in aircraft equipment manufacturing, and shortly after, Messier also becomes part of Snecma.
- 1974: Snecma enters the commercial aviation engine market by partnering with General Electric Aircraft Engines to develop the CFM56 turbofan engine, one of the best-selling aircraft engines globally.
- 2005: The merger of Snecma and Sagem gives birth to Safran, a major aerospace, defense, and security group, unifying their strengths and expertise to provide innovative solutions to the industry.
What's the mission of the company? edit edit source
Safran's purpose is to design, build, and support high-tech solutions that contribute to a safer, more sustainable world. They strive to make air transport environmentally friendly, comfortable, and accessible while addressing critical needs like defense and space exploration.[3]
Offerings edit edit source
Safran's core offerings are centered around two primary segments: (1) Aerospace Propulsion and (2) Electronics & Defense.[4]
Aerospace Propulsion edit edit source
The Aerospace Propulsion segment includes the production of aircraft engines, propulsion systems, landing gear, avionics systems, and aircraft interiors, along with providing after-sales services and aircraft electrical systems. Here we will present the different civil engines:
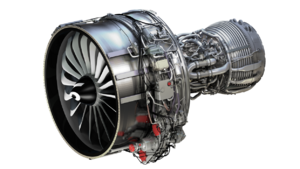
CFM56 edit edit source
The CFM International CFM56 series, hailed as the world's best-selling engine in aviation history, also known as the F108 in the U.S. military, represents a collaborative family of high-bypass turbofan aircraft engines produced by CFM International (CFMI). These engines offer a versatile thrust range, spanning from 18,500 to 34,000 lbf (82 to 150 kN), making them suitable for a wide array of aviation applications.[5]
LEAP ("Leading Edge Aviation Propulsion") edit edit source
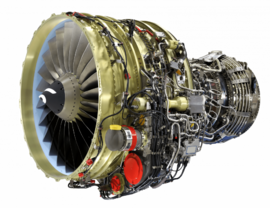
The CFM International LEAP is a cutting-edge high-bypass turbofan engine manufactured by CFM International, which is a 50-50 joint venture between GE Aviation from the United States and Safran Aircraft Engines (formerly Snecma) from France. As an evolutionary successor to the CFM56 engine, the LEAP engine directly competes with the Pratt & Whitney PW1000G to provide powerful propulsion options for narrow-body aircraft. With its advanced technology and design, the LEAP engine offers exceptional performance and efficiency, positioning itself as a leading choice for modernizing and enhancing the capabilities of commercial aircraft.[5]
LEAP-X & CFM56-5/7 comparison [6] edit edit source
The LEAP (Leading Edge Aviation Propulsion) series engine, an upgraded version of the CFM56-5/7 series. This engine is designed to provide power for the next generation of single-aisle commercial jets.
| Engine series | LEAP-X | CFM56-5/7 |
|---|---|---|
| Fan | 18 blades | 36 blades |
| LPC | 3 stages | 4/3 stages |
| HPC | 10 stages | 9 stages |
| Combustor | Twin Annular Premixing Swirler (TAPS II) | conventional |
| HPT | 2 stages | 1 stage |
| LPT | 7/5 stages | 4 stages |
| Total core stages | 22 stages | 18 stages |
| Model | Application | Thrust range | In service |
|---|---|---|---|
| LEAP-1A | Airbus A320 neo family | 24,500-35,000 lbf (109-156 kN) | Aug 2016 |
| LEAP-1B | Boeing 737 MAX family | 23,000-28,000 lbf (100-120 kN) | May 2017 |
| LEAP-1C | COMAC C919 | 27,980-31,000 lbf (124.5-137.9 kN) | 2020/2021 |
| Model | Fan diameter | Bypass ratio | Weight (wet) | Thrust to weight (wet) ratio |
|---|---|---|---|---|
| LEAP-1A | 78 in (198 cm) | 11:1 | 6.632 lb (3.008 kg) | 5.3 |
| LEAP-1B | 69.4 in (176 cm) | 9:1 | 6.128 lb (2780 kg) | 4.5 |
| LEAP-1C | 78 in (198 cm) | 11:1 | 6.632 lb (3.008 kg) | 4.6 |
Rival comparison[6] edit edit source
The primary competitor engines of the LEAP is the Pratt & Whitney's PW1000G (also known as the PurePower PW1000G) series. The PW1000G engine is part of Pratt & Whitney's geared turbofan (GTF) technology, which aims to improve fuel efficiency, reduce emissions, and lower noise levels. Both the LEAP and PW1000G engines are designed to power the next generation of single-aisle commercial aircraft and are competitors in the market for narrow-body jet engines.
| Engine series | LEAP-X | PW1000G |
|---|---|---|
| Fan | 18 blades | 20 blades (PW1100G) |
| Fan gear | - | The reduction gear box (5 planetary gears) |
| LPC | 3 stages | 3/2 stages |
| HPC | 10 stages | 8 stages |
| Combustor | Twin Annular Premixing Swirler (TAPS II) | Lean-burn (TalonX) |
| HPT | 2 stages | 2 stages |
| LPT | 7/5 stages | 3 stages |
| Total core stages | 22 stages | 16 stages |
| Criteria | LEAP-X Engine | PW1000G Engine |
|---|---|---|
| Propulsive Efficiency | Larger fan diameter allows higher bypass ratio, leading to improved propulsive efficiency and fuel savings. | Gear system optimizes fan and LP spool rotation, potentially enhancing propulsive efficiency. |
| Thermal Efficiency | New generation combustion system and advanced materials increase thermal efficiency. Higher operating temperatures require additional cooling systems and materials. | New generation combustion system and advanced materials improve thermal efficiency. Higher operating temperatures necessitate additional cooling systems and materials. |
| Noise Reduction | Designed with noise reduction in mind. Centrifugal FOD ejection system helps protect against debris-induced noise. | Gear system allows for lower fan rotation speeds, contributing to noise reduction. |
Electronics[1] edit edit source
Avionics and Flight Control Systems: Safran leads in avionics development, offering advanced flight control systems, fly-by-wire technology, and cockpit displays for commercial and military aircraft. Their systems ensure precise control, enhancing safety and pilot awareness. Renowned flight management systems optimize paths, reducing fuel consumption and operational costs for airlines.
Electro-Optics and Infrared Systems: Safran excels in electro-optics and infrared systems, enabling day and night vision for defense and security applications. These systems support surveillance, reconnaissance, and target acquisition, providing critical data in challenging environments. Widely used in UAVs, Safran's technology enhances intelligence gathering.
Communication and Data Security: In the Electronics & Defense sector, Safran offers secure communication and data solutions for military and government entities. Encrypted systems protect sensitive information, guarding against cyber threats. Safran's commitment to data security ensures critical military communications are safeguarded in an interconnected world.
Defense[1] edit edit source
Navigation and Identification Systems: Safran's defense solutions encompass advanced navigation systems that provide accurate and reliable positioning for military platforms, ensuring precise mission execution and effective deployment of resources. Additionally, their identification systems play a pivotal role in friend-or-foe recognition, minimizing the risk of friendly fire incidents during operations and enhancing overall combat safety.
Optronics and Targeting Systems: Safran's optronics solutions are deployed across various military platforms, offering superior target acquisition and tracking capabilities. These systems, integrated into armored vehicles, helicopters, and UAVs, provide enhanced situational awareness and increased accuracy for precision strikes, thus bolstering the effectiveness of military missions.
Drone Solutions: Safran's drone technologies cater to both military and civilian applications. Their unmanned aerial systems (UAS) offer intelligence, surveillance, and reconnaissance capabilities for defense operations, providing real-time data and enhancing the tactical decision-making process. Safran's expertise in drone technology makes them a key player in the rapidly evolving field of unmanned systems.
Research and development edit edit source
Open rotor edit edit source
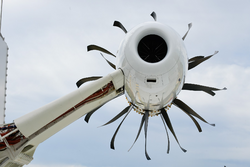
Safran's commitment to research and development is exemplified by its groundbreaking work on the Open Rotor, an innovative aircraft engine design. The Open Rotor project, featuring two counter-rotating propellers and no thrust reversers, represents a transformative approach to enhance fuel efficiency and reduce carbon emissions in the aviation sector. By pushing the boundaries of technology and collaborating with industry partners, Safran has demonstrated the feasibility of the Open Rotor concept through successful testing and research, positioning itself at the forefront of sustainable aviation solutions.[7]
Safran's dedication to the Open Rotor project underscores its vision for the future of aviation, striving to meet the industry's environmental challenges head-on. As the company continues to explore and develop this revolutionary engine architecture, Safran's R&D efforts highlight its commitment to driving innovation and shaping a greener, more sustainable aviation landscape for generations to come.
Hydrogen engine edit edit source
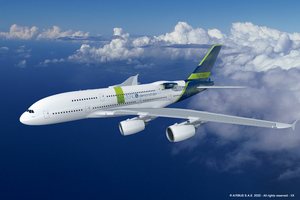
CFM International, in collaboration with Airbus, is at the forefront of pioneering hydrogen combustion technology in the aviation industry. The joint effort aims to ground and flight test a hydrogen-fueled direct combustion engine, with the ultimate goal of developing a zero-emission aircraft for commercial service by 2035. By modifying the GE PassportTM turbofan engine to run on hydrogen and using an A380 flying testbed equipped with liquid hydrogen tanks, the partnership showcases a commitment to environmental sustainability and making significant strides towards achieving net-zero carbon emissions in aviation.[8]
The groundbreaking collaboration between CFM International and Airbus represents a crucial step in ushering in a new era of hydrogen-powered flight. With both companies' expertise and resources combined, they form an ideal team to successfully demonstrate hydrogen propulsion capabilities, reaffirming the aviation industry's dedication to environmentally friendly solutions. This ambitious project not only aligns with Airbus' commitment to net-zero carbon emissions but also highlights the industry's collective efforts to accelerate the development and adoption of hydrogen technology for a greener and more sustainable aviation future.
ESG Performance and Sustainability Analysis edit edit source
Sustainalytics conducts sustainability assessments for listed companies, evaluating their environmental, social, and governance performance. The assigned rating is derived from an ESG risk assessment, where the lowest score signifies the best extra-financial performance.
| Total ESG Risk Score | 23 (Medium risk) |
|---|---|
| Environmental Risk Score | 6.9 |
| Social Risk Score | 10.2 |
| Governance Risk Score | 5.8 |
In the "Aerospace & Defense" sector, Safran has achieved an impressive rank, securing the 3rd position out of 89 companies. Notably, among companies with a market capitalization between $51 and $103 billion, Safran holds the 1st rank. This progress signifies an improvement from 2019, when Safran was ranked 6th out of 82 companies in the same sector.[10]
Market edit edit source
Total Addressable Market edit edit source
The Total Addressable Market (TAM) for Safran SA is defined as the global aerospace and defense market. According to industry reports, the global aerospace and defense market was valued at $855.62 billion in 2023 and is projected to reach $1076.56 billion by 2027, experiencing a compound annual growth rate (CAGR) of 5.9%.[11]
Serviceable Available Market edit edit source
The Serviceable Available Market (SAM) for Safran SA is focused on the commercial aviation segment within the global aerospace and defense market. The Commercial Aviation Market is anticipated to experience significant growth, projected to increase from $218.97 billion in 2023 to $271.96 billion by 2028, representing a Compound Annual Growth Rate (CAGR) of 4.43% during the forecast period from 2023 to 2028.[12]
Serviceable Obtainable Market edit edit source
The Serviceable Obtainable Market (SOM) for Safran SA is focused on the commercial aviation engine market, which represents a significant segment within the broader commercial aviation industry. The global aircraft engine market size is projected to hit USD 112.61 billion by 2029, with a forecasted Compound Annual Growth Rate (CAGR) of 10.87% during the forecast period from 2023 to 2028. The market size stood at USD 54.70 billion in 2022.[13]
Competition edit edit source
Competitors[14] edit edit source
Competitive advantage edit edit source
Safran's competitive advantages lie in its technological expertise, diverse product portfolio, global presence, strong partnerships, sustainability focus, and financial stability, positioning the company as a leading aerospace and defense solutions provider.
Team edit edit source
Board of Directors edit edit source
Chief Executive Officer and Director edit edit source
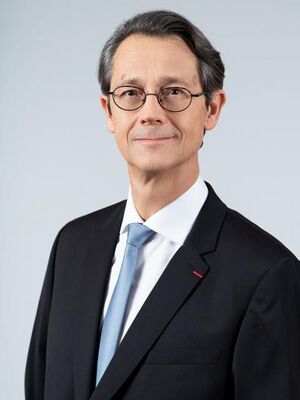
Olivier Andriès' illustrious career has seen him play significant roles in prominent companies, encompassing distinguished positions at the French Ministry of Finance's Treasury department and the prestigious Lagardère group. In the year 2000, he embarked on a transformative journey when he joined Airbus as Vice President, subsequently elevating to the position of Executive Vice President of Strategy. His strategic vision and exceptional performance caught the industry's attention, propelling him further along the path of success.
In 2008, Olivier Andriès set his sights on new horizons, making a strategic move to Safran, where he assumed the crucial role of Executive Vice President of Strategy and Development. His leadership prowess was undeniable, leading to his subsequent appointment as CEO of Turbomeca and Safran Aircraft Engines, solidifying his status as a key decision-maker within the organization. Recognized for his unparalleled acumen and transformative approach, Andriès was the natural choice to be appointed as Safran's next CEO in 2019, with his tenure set to begin on January 1st, 2021.[15]
Chairman of the Board edit edit source
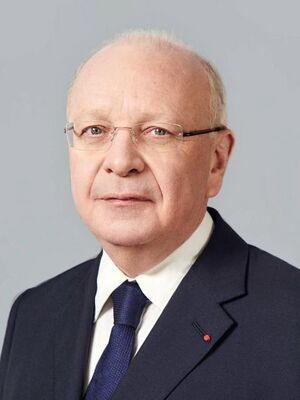
Ross McInnes, born in 1954, holds the distinction of having dual French and Australian nationality. His distinguished career has seen him play significant roles in prominent companies, making valuable contributions in various executive positions. After Oxford University, he started his career in 1977 at Kleinwort Benson, gaining valuable experience in London and Rio de Janeiro. In 1980, he joined Continental Bank (now Bank of America), contributing significantly in corporate finance in Chicago and Paris.
Ross McInnes joined Eridania Beghin-Say in 1989, becoming CFO in 1991 and a Board member in 1999. He later joined Thomson-CSF (now Thales) in 2000 as EVP and CFO, playing a crucial role in the group's transformation.
Having demonstrated exceptional leadership and expertise, Ross McInnes joined Safran in March 2009 as Executive Vice President for Economic and Financial Affairs. His outstanding performance led to his appointment as a member of the Executive Board from July 2009 to April 2011 and later as Deputy Chief Executive Officer until April 2015. On April 23, 2015, he was appointed Chairman of the Board of Safran.[15]
Financials edit edit source
Historic edit edit source
Most recent year edit edit source
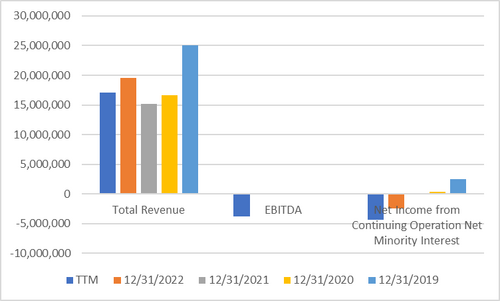
In fiscal year 2022, Safran reported a significant increase in revenue, reaching €19.52 billion, which represents a remarkable growth of approximately 29% compared to the previous year's revenue of €15.13 billion. However, despite the revenue surge, the company also incurred a net loss of €2.46 billion during the same period.
Previous Four Years edit edit source
Over the past four years, Safran's revenue has fluctuated, starting at $25.1 billion in 2019 and reaching $19.52 billion in 2022. During this period, the net income varied significantly, from $2.45 billion to a loss of $2.46 billion. These fluctuations reflect the challenges and changes in the aerospace industry.
Financial Performance Analysis edit edit source
Safran has experienced a downturn in its financial performance over the last few years, and several factors may have contributed to this decline.
The first significant cause contributing to Safran's recent poor results is the Covid-19 pandemic, which led to a drastic shutdown in air traffic. As international travel and aviation activities were severely restricted, demand for aircraft engines and related products declined substantially, affecting Safran's revenue and profitability.
Another factor impacting Safran's financials is the increase in costs, particularly in raw materials. The rising costs of essential inputs for their manufacturing processes put pressure on their profit margins, making it challenging to maintain previous levels of profitability.
Additionally, currency fluctuations between the euro and the US dollar have played a role in the company's adverse results. Safran operates in a global market and conducts business in multiple currencies. Fluctuations in exchange rates can lead to uncertain revenues and costs, making financial planning and forecasting more challenging.
It's worth noting that these challenges are not unique to Safran alone, as the aerospace industry, like many others, has been significantly affected by the global economic disruptions caused by the pandemic.
Risks edit edit source
Market Risk edit edit source
Demand Fluctuations: Changes in demand for commercial aircraft, defense equipment, and services due to economic conditions, geopolitical tensions, and technological advancements.
Cyclical Nature: Variations in sales and profits as the aerospace and defense industry experiences ups and downs in the economic cycle.
Regulatory and Political Risk edit edit source
Export Control Regulations: Compliance with export controls and potential restrictions on selling certain technologies and equipment to specific countries.
Political Instability: Geopolitical tensions, conflicts, or changes in government policies in regions where Safran operates affecting business operations.
Environmental Regulations: Compliance with environmental regulations that may lead to additional costs for Safran and its operations.
Operational Risk edit edit source
Supply Chain Disruptions: Risks associated with the complexity of Safran's supply chain for aerospace and defense products, leading to potential disruptions or delays.
Project Execution: Challenges in executing large-scale projects that could result in cost overruns and delays.
Safety Incidents: Risks associated with any safety-related incidents involving Safran's products or services, potentially leading to reputational damage and legal liabilities.
Technological and Competitive Risk edit edit source
Rapid Technological Changes: The need to adapt to new technologies and maintain a competitive edge in the fast-paced aerospace and defense industry.
Intense Competition: Facing competition from both established and emerging companies in the aerospace and defense industry.
Cybersecurity Risk: Vulnerability to cyberattacks and data breaches due to the increasing reliance on digital technologies in aerospace and defense.
Valuation edit edit source
What's the Current Value of Safran? edit edit source
As of 26th July 2023, the stock of Safran closed at 144.82€ per share, demonstrating a steady recovery from the impact of the Covid-19 pandemic. The current stock price is approaching its historical peak value of 148.45€, which was recorded in November 2019, indicating positive momentum in the market.
| Safran Current Valuation - July 2023 | |||
|---|---|---|---|
| Share Price (@30/07) | [€] | 144.82 | |
| Shares Outstanding | [#M] | 426.5 | |
| Equity Value | [€B] | 61.77 | |
| Add:
Net Debt at Dec. 31, 2022 |
[€M] | 14 | |
| Enterprise Value | [€B] | 61.78 | |
In our analysis of Safran's valuation, we employed three distinct methods:
- Discounted Cashflow: With a discount rate of 8.7% and a long-term growth rate of 1.7%, the Perpetuity approach values Safran shares at 152.32€, while the EBITDA approach results in a valuation of 140.35€. Given Safran's current stock price of 144.82€, it appears undervalued relative to the discounted cash flow (DCF) model valuation.
- Trading Comps: The negative income and EBITDA figures made it impractical to apply the P/E or EV/EBITDA ratios in this case. This straightforward analysis makes it evident that the company is considered overvalued when utilizing the PB ratio. The current market value per share is 144.82€, whereas our analysis, based on the PB ratio, estimates it to be 101.87€.
- Dividend Discount Model: In 2019, Safran encountered challenges that led to the inability to pay dividends. However, the company has demonstrated a consistent track record of paying fair dividends in the preceding years. To assess Safran's valuation, we utilized the Gordon Growth Model (GGM) by projecting the past dividend growth rate to estimate the 2023 dividend. The GGM valuation resulted in a per-share value of 19.67€. Assuming market efficiency, i.e. the current share price is correct, the adequate cost of equity of Safran would be 2.64%.
What's the expected return of an Investment in the Company? edit edit source
Based on our DCF model and the current market value, the Stockhub users estimate that the expected return of an investment in Safran over the next five years is approximately 5.21%. In practical terms, this means that a £1,000 investment in Safran is projected to grow to £1,052.10 in five years' time.
Assuming that a suitable return level over five years is 10% per year and achieves its expected return level (of 5.21%), then an investment in the company is considered to be an 'unsuitable' one.
Monte Carlo Simulations edit edit source
Data edit edit source
Introducing our cutting-edge Monte Carlo simulation for Safran's stock price analysis! By harnessing the power of this advanced computational method, we aim to provide you with invaluable insights into the potential behavior of Safran's stocks over time.
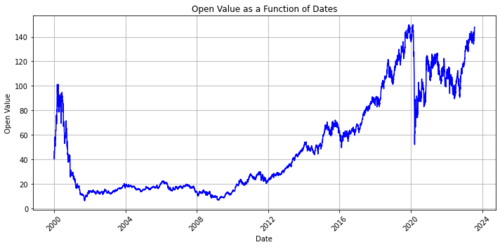
Our Monte Carlo simulation involves running thousands of random simulations based on a variety of input variables, including historical price data, volatility, and other essential market factors. Through this approach, we generate a comprehensive probability distribution of possible outcomes, enabling you to assess the potential risk and returns associated with investing in Safran.
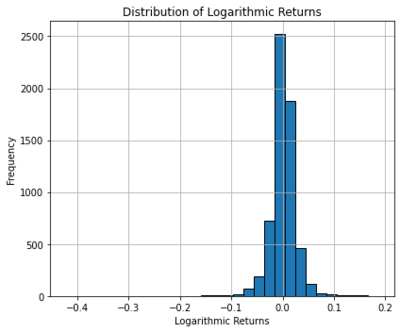
Simulations edit edit source
With our simulation, you can make data-driven decisions and gain a deeper understanding of the uncertainty surrounding the stock's performance. Embrace the future of equity research and explore the vast range of possibilities to optimize your investment strategies effectively.
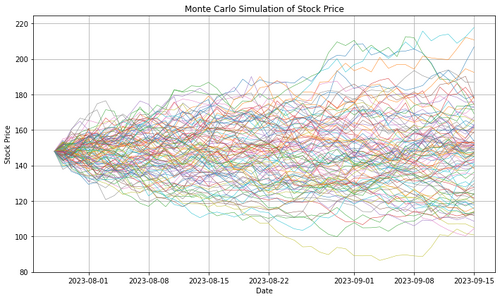
Through our Monte Carlo simulations, we have the ability to visualize numerous paths for 100 simulations, offering a glimpse into the potential outcomes. However, to gain a deeper and more comprehensive understanding of the results, we recommend running a larger number of simulations. By doing so, we can effectively construct probability distributions that highlight the likelihood of Safran's stock price being at certain levels. This will provide a more accurate and insightful analysis, enabling you to make informed decisions with confidence.
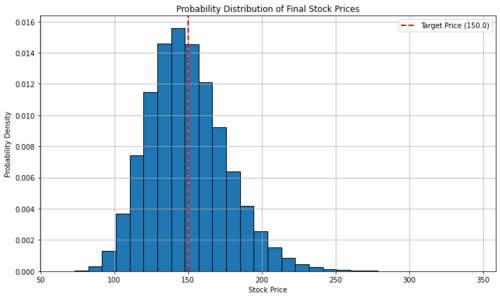
From this analysis, it becomes evident that the current valuation on the 28th of July 2023, at 147.98€, appears to be somewhat inflated when we examine the Gaussian curve. The distribution of prices is skewed towards the left side of the curve, indicating a higher concentration of lower price points.
Please note that we utilized the article "Monte Carlo Simulations for Stock Price Predictions [Python]" authored by Elias Melul as a reference to develop our Python code for running the simulations. You can find the complete Python code in the appendix section.[16]
Appendix edit edit source
Financial statements edit edit source
Income Statement (In €) edit edit source
| Year end date | TTM | 12/31/2022 | 12/31/2021 | 12/31/2020 | 12/31/2019 |
|---|---|---|---|---|---|
| Total Revenue | 17,039,000 | 19,523,000 | 15,133,000 | 16,631,000 | 25,098,000 |
| Cost of Revenue | 8,628,000 | 10,145,000 | 7,855,000 | 9,016,000 | 13,581,000 |
| Gross Profit | 8,411,000 | 9,378,000 | 7,278,000 | 7,615,000 | 11,517,000 |
| Operating Expense | 6,456,000 | 6,663,000 | 6,098,000 | 6,193,000 | 7,943,000 |
| Operating Income | 1,955,000 | 2,715,000 | 1,180,000 | 1,422,000 | 3,574,000 |
| Net Non Operating Interest Income Expense | -80,000 | -39,000 | -103,000 | -2,000 | -19,000 |
| Pretax Income | -5,722,000 | -3,120,000 | 268,000 | 570,000 | 3,474,000 |
| Tax Provision | -1,356,000 | -694,000 | 200,000 | 184,000 | 962,000 |
| Net Income Common Stockholders | -4,393,000 | -2,459,000 | 43,000 | 352,000 | 2,447,000 |
| Diluted NI Available to Com Stockholders | -4,393,000 | -2,459,000 | 43,000 | 352,000 | 2,447,000 |
| Basic EPS | - | -5.76 | 0.10 | 0.83 | 5.69 |
| Diluted EPS | - | -5.76 | 0.10 | 0.80 | 5.63 |
| Basic Average Shares | - | 426,681 | 426,650 | 426,036 | 429,723 |
| Diluted Average Shares | - | 440,160 | 440,087 | 440,460 | 434,977 |
| Total Operating Income as Reported | 1,584,000 | - | 864,000 | 927,000 | 3,837,000 |
| Total Expenses | 15,084,000 | 16,808,000 | 13,953,000 | 15,209,000 | 21,524,000 |
| Net Income from Continuing & Discontinued Operation | -4,393,000 | -2,459,000 | 43,000 | 352,000 | 2,447,000 |
| Normalized Income | 804,692 | -1,833,568 | 304,660 | 787,440 | 2,421,692 |
| Interest Income | 20,000 | 67,000 | 15,000 | 22,000 | 48,000 |
| Interest Expense | 85,000 | 94,000 | 109,000 | 108,000 | 120,000 |
| Net Interest Income | -80,000 | -39,000 | -103,000 | -2,000 | -19,000 |
| EBIT | -5,637,000 | -3,026,000 | 377,000 | 678,000 | 3,594,000 |
| EBITDA | -3,771,000 | - | - | - | - |
| Reconciled Cost of Revenue | 8,628,000 | 10,145,000 | 7,855,000 | 9,016,000 | 13,581,000 |
| Reconciled Depreciation | 1,866,000 | 1,615,000 | 1,642,000 | 1,565,000 | 1,589,000 |
| Net Income from Continuing Operation Net Minority Interest | -4,393,000 | -2,459,000 | 43,000 | 352,000 | 2,447,000 |
| Total Unusual Items Excluding Goodwill | -6,812,000 | -804,000 | -356,000 | -643,000 | 35,000 |
| Total Unusual Items | -6,812,000 | -804,000 | -356,000 | -643,000 | 35,000 |
| Normalized EBITDA | 3,041,000 | -607,000 | 2,375,000 | 2,886,000 | 5,148,000 |
| Tax Rate for Calcs | 0 | 0 | 0 | 0 | 0 |
| Tax Effect of Unusual Items | -1,614,308 | -178,568 | -94,340 | -207,560 | 9,692 |
Balance Sheet (In €) edit edit source
| Year end date | 12/31/2022 | 12/31/2021 | 12/31/2020 | 12/31/2019 |
|---|---|---|---|---|
| Total Assets | 46,828,000 | 41,716,000 | 39,531,000 | 42,808,000 |
| Total Liabilities Net Minority Interest | 35,962,000 | 28,446,000 | 26,781,000 | 30,060,000 |
| Total Equity Gross Minority Interest | 10,866,000 | 13,270,000 | 12,750,000 | 12,748,000 |
| Total Capitalization | 15,610,000 | 17,750,000 | 16,363,000 | 15,507,000 |
| Common Stock Equity | 10,411,000 | 12,841,000 | 12,349,000 | 12,371,000 |
| Capital Lease Obligations | 587,000 | 609,000 | 608,000 | 729,000 |
| Net Tangible Assets | -2,679,000 | -609,000 | -1,387,000 | -2,307,000 |
| Working Capital | -2,479,000 | 755,000 | -838,000 | -2,804,000 |
| Invested Capital | 16,781,000 | 19,373,000 | 18,758,000 | 18,926,000 |
| Tangible Book Value | -2,679,000 | -609,000 | -1,387,000 | -2,307,000 |
| Total Debt | 6,957,000 | 7,141,000 | 7,017,000 | 7,284,000 |
| Net Debt | - | 1,285,000 | 2,662,000 | 3,923,000 |
| Share Issued | 427,246 | 427,242 | 427,236 | 427,234 |
| Ordinary Shares Number | 424,559 | 426,786 | 426,917 | 424,684 |
| Treasury Shares Number | 2,687 | 456.165 | 319.284 | 2,550 |
Cash Flow (In €) edit edit source
| Year end date | TTM | 12/31/2022 | 12/31/2021 | 12/31/2020 | 12/31/2019 |
|---|---|---|---|---|---|
| Operating Cash Flow | 3,478,000 | 3,545,000 | 2,436,000 | 1,866,000 | 3,145,000 |
| Investing Cash Flow | -870,000 | -1,288,000 | -738,000 | -799,000 | -1,105,000 |
| Financing Cash Flow | -368,000 | -815,000 | -268,000 | 68,000 | -1,740,000 |
| End Cash Position | 6,167,000 | 6,687,000 | 5,247,000 | 3,747,000 | 2,632,000 |
| Changes in Cash | 2,240,000 | 1,442,000 | 1,430,000 | 1,135,000 | 300,000 |
| Effect of Exchange Rate Changes | 41,000 | 2,000 | 70,000 | -20,000 | 2,000 |
| Beginning Cash Position | 3,927,000 | 5,247,000 | 3,747,000 | 2,632,000 | 2,330,000 |
| Other Cash Adjustment Outside Change in Cash | -4,000 | -4,000 | - | - | - |
| Capital Expenditure | -834,000 | -879,000 | -756,000 | -793,000 | -1,162,000 |
| Issuance of Capital Stock | 0 | 0 | 1,000 | - | - |
| Issuance of Debt | 509,000 | 510,000 | 2,146,000 | 1,595,000 | 24,000 |
| Repayment of Debt | -613,000 | -671,000 | -1,367,000 | -778,000 | -875,000 |
| Repurchase of Capital Stock | 0 | -270,000 | -73,000 | - | - |
| Free Cash Flow | 2,644,000 | 2,666,000 | 1,680,000 | 1,073,000 | 1,983,000 |
Discounted Cashflow model (DCF) edit edit source
Key inputs edit edit source
| Description | Value | Commentary |
|---|---|---|
| Discount rate (%) | 8.2% | The application of the weighted average cost of capital (WACC) formula was used to compute the discount rate for future cash flows. |
| Long term growth rate (%) | 1.7% | We used the growth rate of you Dividend Discount Model. |
| Corporate Tax Rate (%) | 25% | According to the new French legislation, the Corporate Tax Rate should be at 25%
as from 1 January 2022.[17] |
For this model, we use the WACC model to compute the discount rate for the future cash flows.
| Cost of equity | 8.68% |
|---|---|
| Cost of debt | 5.00% |
| Tax rate | 25.00% |
| Debt | 6,957 |
| Equity (Current market cap) | 65,010 |
| D/(D+E) | 10% |
| E/(D+E) | 90% |
| WACC | 8.20% |
Safran Unlevered Free Cash Flows edit edit source
| Period (t) | 2019A | 2020A | 2021A | 2022A | 2023P | 2024P | 2025P | 2026P | 2027P |
|---|---|---|---|---|---|---|---|---|---|
| EBITDA | 5830 | 2962 | 2825 | 3,498 | 3,673 | 3,857 | 4,049 | 4,252 | 4,464 |
| EBIT | 4,695 | 1,706 | 1,489 | 1,958 | 1,950 | 1,928 | 1,892 | 1,838 | 1,763 |
| Tax rate | 26.30% | 27.50% | 34.40% | 31.4% | 25.0% | 25.0% | 25.0% | 25.0% | 25.0% |
| EBIT (1-t) | 3,460 | 1,237 | 977 | 1,343 | 1,462 | 1,446 | 1,419 | 1,378 | 1,322 |
| D&A | 1135 | 1256 | 1336 | 1,540 | 1,723 | 1,928 | 2,157 | 2,414 | 2,701 |
| NWC | 2,804 | 838 | (755) | 2,479 | 2,256 | 2,053 | 1,868 | 1,700 | 1,547 |
| Capital expenditures | (1,162) | (793) | (756) | (879) | (919) | (960) | (1,003) | (1,048) | (1,095) |
| Unlevered free cash flows (UFCF) | 6,237 | 2,538 | 802 | 4,483 | 4,523 | 4,467 | 4,441 | 4,444 | 4,475 |
| Discount rate (r) | 8.7% | 8.7% | 8.7% | 8.7% | 8.7% | ||||
| PV of UFCFs | 4,180 | 3,816 | 3,506 | 3,242 | 3,018 | ||||
| Stage 1: Sum of present values | 17,762 | ||||||||
Terminal value - growth in perpetuity approach edit edit source
| Long term growth rate | 1.7% |
|---|---|
| 2022 FCF x (1+g) | 4,551 |
| Terminal value in 2022 | 69,979 |
| Stage 2: PV of TV | 47,187 |
| Enterprise value (stage 1 + 2) | 64,949 |
Terminal value - EBITDA multiple approach edit edit source
| EBITDA multiple | 14.0x |
|---|---|
| Terminal value in 2022 | 62,413 |
| Stage 2: PV of TV | 42,085 |
| Enterprise value (stage 1 + 2) | 59,847 |
Net debt edit edit source
| Data as of: | 29/07/2023 |
| Net debt | (14) |
|---|
Equity valuations edit edit source
| Perpetuity approach | EBITDA approach | |
|---|---|---|
| Equity value | 152.32 € | 140.35 € |
Sensitivity analysis edit edit source
| Constant Growth rate | ||||||
|---|---|---|---|---|---|---|
| 0.7% | 1.2% | 1.7% | 2.2% | 2.7% | ||
| WACC | 7.0% | 162.61 € | 173.56 € | 186.49 € | 202.31 € | 221.70 € |
| 7.4% | 152.93 € | 162.42 € | 173.51 € | 186.89 € | 203.02 € | |
| 7.8% | 144.35 € | 152.64 € | 162.22 € | 173.66 € | 187.26 € | |
| 8.2% | 136.68 € | 143.97 € | 152.32 € | 162.20 € | 173.80 € | |
| 8.6% | 129.79 € | 136.24 € | 143.58 € | 152.17 € | 162.16 € | |
| 9.0% | 123.56 € | 129.30 € | 135.78 € | 143.32 € | 151.99 € | |
| 9.4% | 117.90 € | 123.04 € | 128.80 € | 135.45 € | 143.04 € | |
Trading Comparables (Comps) edit edit source
As mentioned earlier, the negative income and EBITDA figures make it impractical to use the P/E or EV/EBITDA ratios in this case. Different valuation approaches and more comprehensive analyses are needed to accurately assess the company's financial health and potential.
For that matter we decided to use the Price-to-Book (PB) ratio, we collected the PB ratio for similar companies operting in the aerospace and defense sector. Rolls-Royce having a negative PB ratio, we left it out of our analysis.
| Company Name | PB ratio |
|---|---|
| Airbus SE (EPA: AIR) | 7.32 |
| Thales Group (EPA: HO) | 3.86 |
| General Electric Company (NYSE: GE) | 3.8 |
| Average | 4.99 |
| Median | 3.86 |
We can then deduce the price per share using the median PB ratio.
| Calculating the price based on PB ratio | |||||
|---|---|---|---|---|---|
| Price | Shares Outstanding | Book value | Total assets | Intangible assets | Total liabilities |
| 101.87 € | 426,500,000 | 11,256,000,000.00 € | 46,828,000,000.00 € | 8,096,000,000.00 € | 27,476,000,000.00 € |
Based on this straightforward analysis, it becomes evident that the company is deemed overvalued, given its current market value per share of 144.82€ in contrast to the value of 101.87€ calculated through our analysis. However, if we solely rely on the Airbus PB (Price-to-Book) ratio, the estimated price per share would be 193.19 €, indicating an even higher level of overvaluation in this instance.
This demonstrates the limited usefulness of the Comps analysis in accurately determining the company's true value and highlights the need for incorporating multiple valuation metrics and methodologies to gain a more comprehensive understanding of its market worth.
Dividend Discount Model (DDM) edit edit source
Equity valuation edit edit source
In the following table, we present the key values used in a DDM (Dividend Discount Model) analysis, including the CAPM model, risk-free rate of return, beta, market rate of return, and the corresponding cost of equity.
| CAPM model | Values |
|---|---|
| Risk-free rate of return (Euro short-term rate (€STR)) | 3.41% |
| Beta (5Y Monthly, levered) | 1.35 |
| Market rate of return (European Stocks Portfolio) | 7.31% |
| Cost of equity | 8.7% |
The graphical representation below illustrates the dividend history of Safran over the past years, showcasing the annual dividends paid, including the notable occurrence of zero dividends in the year 2019.
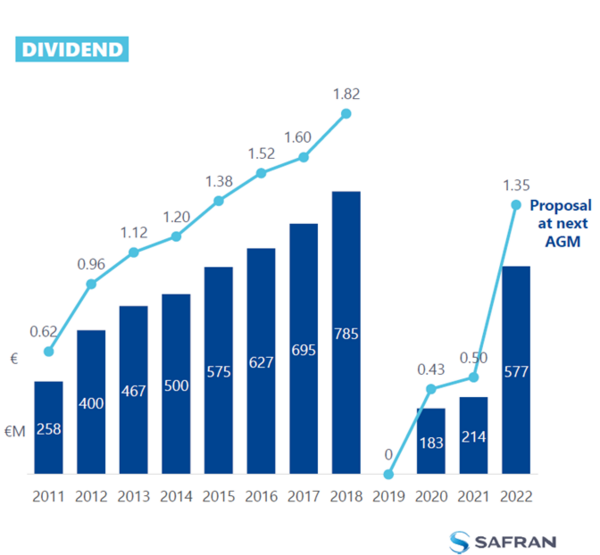
| Year | 2011 | 2012 | 2013 | 2014 | 2015 | 2016 | 2017 | 2018 | 2019 | 2020 | 2021 | 2022 |
|---|---|---|---|---|---|---|---|---|---|---|---|---|
| Dividend per share | 0.62 | 0.96 | 1.12 | 1.20 | 1.38 | 1.52 | 1.60 | 1.82 | 0.00 | 0.43 | 0.50 | 1.35 |
To evaluate Safran's valuation, we applied the Gordon Growth Model (GGM), projecting the historical dividend growth rate from 2011 to 2018 to estimate the current growth rate starting from 2022. By doing so, we can make an estimation of the 2023 dividend.
| Period | / | 2011-
2012 |
2012-2013 | 2013-2014 | 2014-2015 | 2015-2016 | 2016-2017 | 2017-2018 |
|---|---|---|---|---|---|---|---|---|
| Dividend Growth Rate | / | 0.55 | 0.17 | 0.07 | 0.15 | 0.10 | 0.05 | 0.14 |
| Average Growth Rate | 0.18 | |||||||
| CAGR | 0.14 | |||||||
| Constant growth rate | 0.017 | |||||||
The DDM value of 19.67 € suggests that, according to the model's assumptions, the stock is overvalued relative to its intrinsic worth. On the other hand, the market value of 144.82 € reflects the collective perception of investors in the open market, which may be influenced by a variety of short-term and long-term factors.
| Value per Share (DDM) | 19.67 € |
|---|---|
| Market value per share | 144.82 € |
We also performed a sensitivity analysis.
| Constant Growth rate | ||||||||
|---|---|---|---|---|---|---|---|---|
| Cost of equity | 1.1% | 1.3% | 1.5% | 1.7% | 1.9% | 2.1% | 2.3% | |
| 6.5% | 25.37 € | 26.40 € | 27.51 € | 28.72 € | 30.04 € | 31.47 € | 33.04 € | |
| 7.5% | 21.39 € | 22.13 € | 22.91 € | 23.75 € | 24.65 € | 25.62 € | 26.66 € | |
| 8.5% | 18.49 € | 19.05 € | 19.63 € | 20.25 € | 20.91 € | 21.60 € | 22.35 € | |
| 8.7% | 18.01 € | 18.53 € | 19.08 € | 19.67 € | 20.29 € | 20.95 € | 21.65 € | |
| 8.9% | 17.54 € | 18.04 € | 18.57 € | 19.12 € | 19.71 € | 20.33 € | 20.99 € | |
| 9.9% | 15.54 € | 15.94 € | 16.35 € | 16.78 € | 17.24 € | 17.72 € | 18.22 € | |
| 10.9% | 13.96 € | 14.27 € | 14.61 € | 14.96 € | 15.32 € | 15.70 € | 16.10 € | |
Inverse problem edit edit source
In this section, our objective is to calculate the necessary growth rate of Safran's stock to achieve its market value, assuming market efficiency. To achieve this, we will simply reverse the GGM formula to derive the cost of equity.
| Inverse problem | |
| Market value per share | 144.82 € |
|---|---|
| Expected dividend per share | 1.37 € |
| Dividend growth rate | 1.70% |
| Cost of equity | 2.64% |
The cost of equity of 2.64% for Safran represents the expected return or required rate of return that investors demand for holding the company's stock. A low cost of equity, such as 2.64%, indicates that investors perceive Safran as a relatively safe and stable investment.
Monte Carlo Simulations for Stock Price Predictions - Python Code edit edit source
"""
Created on Thu Jul 27 18:31:35 2023

@author: Jérémy Archier
"""

import csv
import matplotlib.pyplot as plt
import numpy as np
from datetime import datetime, timedelta
from scipy.stats import norm

# Step 1: Load data from the CSV file
csv_file_path = "SAF.PA.csv"

dates = []
opens = []

with open(csv_file_path, newline="") as csvfile:
    csv_reader = csv.DictReader(csvfile)

    for row in csv_reader:
        # Check if the 'Open' value is 'null' or empty or 0
        if row['Open'].strip() == '' or row['Open'].lower() == 'null' or float(row['Open']) == 0:
            # Skip the data point if there is no valid 'Open' value
            continue

        # Convert the 'Open' value to a float
        open_value = float(row['Open'])

        # Convert the 'Date' value to a datetime object
        date_value = datetime.strptime(row['Date'], '%Y-%m-%d')

        # Append the 'Date' and 'Open' values to their respective lists
        dates.append(date_value)
        opens.append(open_value)

# Step 2: Compute the logarithmic returns of the stock
log_returns = np.log(np.array(opens[1:]) / np.array(opens[:-1]))

# Plot the previous prices
plt.figure(figsize=(10, 5))
plt.plot(dates, opens, linestyle='-', color='b')
plt.xlabel('Date')
plt.ylabel('Open Value')
plt.title('Open Value as a Function of Dates')
plt.xticks(rotation=45)
plt.grid(True)
plt.tight_layout()
plt.show()

# Plot the log returns
plt.figure(figsize=(6, 5))
plt.hist(log_returns, bins=30, edgecolor='k')
plt.xlabel("Logarithmic Returns")
plt.ylabel("Frequency")
plt.title("Distribution of Logarithmic Returns")
plt.grid(True)
plt.tight_layout()
plt.show()

# Step 3: Compute the Drift
u = log_returns.mean()
var = log_returns.var()
drift = u - (0.5 * var)

# Step 4: Compute the Variance and Daily Returns
stdev = log_returns.std()
days = 50
trials = 1000000  # Reduce the number of trials to 100 for faster computation
Z = norm.ppf(np.random.rand(days, trials))  # days, trials
daily_returns = np.exp(drift + stdev * Z)

# Step 5: Calculating the stock price for every trial
price_paths = np.zeros_like(daily_returns)
price_paths[0] = opens[-1]
for t in range(1, days):
    price_paths[t] = price_paths[t - 1] * daily_returns[t]

# Step 6: Calculate the probability of reaching the target price
target_price = 150.0  # Replace this with the desired target price

# Count how many times the stock price reaches or exceeds the target price in each trial
success_count = np.sum(price_paths[-1, :] >= target_price)

# Calculate the probability as the ratio of successful trials to total trials
probability = success_count / trials

# Print the probability
print(f"The probability of the stock reaching or exceeding {target_price} is: {probability:.2%}")

# Step 7: Plot the histogram of final stock prices
final_prices = price_paths[-1, :]
plt.figure(figsize=(10, 6))
plt.hist(final_prices, bins=30, edgecolor='k', density=True)
plt.axvline(x=target_price, color='r', linestyle='dashed', linewidth=2, label=f'Target Price ({target_price})')
plt.xlabel('Stock Price')
plt.ylabel('Probability Density')
plt.title('Probability Distribution of Final Stock Prices')
plt.legend()
plt.grid(True)
plt.tight_layout()
plt.show()

# Step 8: Plot the price paths for each trial
plt.figure(figsize=(10, 6))
for trial in range(trials):
    trial_dates = [dates[-1] + timedelta(days=i) for i in range(days)]
    plt.plot(trial_dates, price_paths[:, trial], linewidth=0.5)
plt.xlabel('Date')
plt.ylabel('Stock Price')
plt.title('Monte Carlo Simulation of Stock Price')
plt.tight_layout()
plt.grid(True)
plt.show()
References edit edit source
- ↑ 1.0 1.1 1.2 1.3 https://www.safran-group.com/
- ↑ https://www.safran-group.com/group/history-and-heritage/timeline
- ↑ https://www.safran-group.com/news/safran-unveils-its-purpose-statement-2020-06-23
- ↑ https://www.safran-group.com/pressroom/safran-reports-full-year-2022-results-2023-02-17
- ↑ 5.0 5.1 https://www.safran-group.com/products-services?category%5B0%5D=342-commercial-aircraft-engines
- ↑ 6.0 6.1 https://www.linkedin.com/pulse/rivalry-new-generation-engines-lepa-x-pure-power-pw1000g-daugilis/
- ↑ https://www.safran-group.com/fr/actualite/quel-avenir-lopen-rotor-2019-03-28
- ↑ https://www.safran-group.com/pressroom/cfm-and-airbus-pioneer-hydrogen-combustion-technology-2022-02-22
- ↑ https://fr.finance.yahoo.com/quote/SAF.PA/sustainability/
- ↑ https://www.safran-group.com/news/constantly-improving-esg-extra-financial-ratings-2021-06-03
- ↑ https://www.researchandmarkets.com/reports/5781267/aerospace-and-defense-global-market-report
- ↑ https://www.mordorintelligence.com/industry-reports/commercial-aircraft-market
- ↑ https://www.fortunebusinessinsights.com/industry-reports/aircraft-engine-market-101766
- ↑ https://craft.co/safran-aircraft-engines/competitors
- ↑ 15.0 15.1 https://www.safran-group.com/group/profile/governance
- ↑ https://medium.com/analytics-vidhya/monte-carlo-simulations-for-predicting-stock-prices-python-a64f53585662
- ↑ https://www.economie.gouv.fr/files/files/Actus2018/dp_plf2019.pdf
