Talk:Supply@ME Capital
Questions edit edit source
- As of today, how many Supply@ME warrants and options are outstanding?
- Since Supply@ME’s most recent results (i.e. the results for the six months ended 30th June 2022), how much cash has the company raised in 1) equity and 2) in debt, and how much existing debt has been repaid?
- As of today, how much cash does the company have?
- As of today, how much debt does the company have?
- As of today, what's the net current liabilities position?
- As of today, what's the net liabilities position?
- Who would are the company’s three closest competitors (perhaps TraxPay, Demica and PrimeRevenue)?
- In regards to the company debts, what are the expiry dates and interest rates?
- It seems to me that the company’s flagship product uses an inventory repurchase (repo) agreement, and according to the IMF, with an inventory repurchase (repo) agreement, “what appears to be a sale and buy-back is in fact not recognized as a true sale by the accounting bodies” (source: https://www.imf.org/-/media/Files/Publications/WP/2019/wpiea2019165-print-pdf.ashx). I was wondering whether the company is indeed using an inventory repurchase (repo) agreement or whether it’s using some other mechanism to enable companies to finalise their inventory?
- “Clients receive a cash payment based on the book value of the inventory minus a refundable deposit (15% by value) which is withheld as deferred price, repayable at the end of the standard contract term of three years.“ What is meant here by deferred price?
- Part of the reasons Greensill failed is because the invoices were found to be incorrect or made-up. How does Supply@ME ensure that the inventory actually exists, and that if it exists, the value of the inventory is correct?
- What is the cost of the cash to the client (i.e. the manufacturing company that is selling its inventory for cash).
- Inventory is normally held for around 60 days. Isn’t three years too long?
Other edit edit source
Operational and principal activities edit edit source
Recently introduced significant new products or services edit edit source
Since 31th December 2021 (being the date to which the last published audited financial statements for the company and the group were made up), the group announced the execution of a strategic alliance agreement on 28th June 2022 (the "VeChain Agreement") with the VeChain Foundation ("VeChain"), a blockchain enterprise service provider focused on supply chain and sustainability, to fund the first inaugural IM transaction and kick off the "Web3" stream.
The objective of the VeChain Agreement is to create a sustainable Web3 environment that will allow direct participation in the IM journey combining traditional finance with the blockchain space. According to Messari research, the top 100 digital assets in circulation capitalise over US$1.2 trillion, of which approximately 60% are currencies, like Bitcoin, and stablecoins, like Tether.
The VeChain Agreement has two phases, both in terms of investment opportunities and technology development.
In Phase One, a proof-of-concept real transaction involving a client company already selected by SYME from its existing Italian portfolio, with the VeChain Foundation serving as provider of its VeChain Thor blockchain and non-fungible token ("NFT") investor.
Following the successful completion of the first transaction and an assessment of the innovative process designed to link digital assets to the real economy, Phase Two will build up an "IM Platform 3.0" with an expected roadmap of Web3 features, including the issuance of NFTs, digital ownership and B2B marketplaces, decentralised finance (DEFI) and, overall, a governance protocol. For this phase, to be completed by end of December 2022, it’s expected the IM transactions will be also funded by further multiple liquidity providers (crypto asset managers and direct IM investors through liquidity pools partnerships).
The commitment budgeted by VeChain within the VeChain Agreement to directly subscribe the Inventory (NFT-based) Monetisation Transactions is up to US$10m, of which approximately US$1.6m immediately releasable to fund the available eligible inventory of the first Italian client selected and the rest, during the Phase Two, for one or more further client companies, also including the current UK portfolio.
Recent commercial developments edit edit source
On 12th September 2022, the company announced the execution of the group's first IM transaction in connection with Phase One of the VeChain Agreement. The client company to this inaugural IM transaction is a well-established business with significant market presence in Europe (mainly in Italy), Africa and the United States. The client company is involved in the design and manufacture of industrial and specialised vehicles as well as electronic systems, electrical wiring, and other components.
The inaugural IM transaction has been structured as follows:
- a StockCo, an overview of which was given in the SYME Business Model Canvas in the 2021 Annual Report, entered into the commercial contractual package, with a duration of three years, with the client company to execute the inaugural IM transaction. The total value of the initial warehoused goods to be monetised is approximately €1.6m;
- with reference to the fully owned SYME subsidiaries:
- Supply@ME Italy, acting as originator and servicer, signed an operating agreement with StockCo which includes an annual inventory servicing fee and, additionally, will charge the client company an up-front origination fee;
- NewCoTech, owner of the IM intellectual property rights and acting as platform provider, has signed a license agreement with the StockCo and will charge an annual platform fee. The platform will be used by the client company to upload inventory to be monetised (and, accordingly, minting the NFTs), integrate and transfer the Enterprise-Resource-Planning data to allow the necessary monitoring and inspection activities by the StockCo, supported by Supply@ME Italy; and
- StockCo, in turn, mints NFTs to be subscribed by VeChain under the VeChain Agreement. Each NFT represents a basket of rights over the inventory, including the opportunity to achieve monthly returns generated by the inventory trading activities performed by the StockCo and the right of the NFT holder, as ultimate owner of the goods, to take possession of the physical goods if certain conditions are met.
Other edit edit source
Clients receive a cash payment based on the book value of the inventory minus a refundable deposit (15% by value) which is withheld as deferred price, repayable at the end of the standard contract term of three years.
The SPSC's servicing fee (typically 6-8%) is passed on to the SPSC's investors after deducting Supply@ME's platform royalties of 2%.
The three-year inventory funding "package" is offered to investors as an asset backed note or other form of security with funders receiving a coupon of 4-6% per annum. Supply@ME has attracted funding from banks, hedge funds, family offices and other similar financial institutions. For Supply@ME, the greater the access to funds, the greater its ability to grow.
Interesting/useful extract/information
Trade finance is the backbone of international trade for entities ranging from a small businesses to multi-national corporations. An estimated 80 percent of world trade relies on this form of finance (WTO, 2017). Despite its systemic importance and rapid growth, data availability is only partial. During the 2008 financial crisis, policy makers, notably the G20 recognized that the absence of comprehensive trade finance data posed a significant hurdle for policy-makers to make informed, timely decisions. This paper proposes a standalone dataset to reflect the scope, dynamic and recent innovations of the trade finance market to support macroeconomic policy analysis.
Blockchain and smart contracts are considered a “game changer technology that can transform trade finance processes.[1]
There is, therefore, a close relationship between a company’s management of supply chain activities and its financial performance.
Working Capital is the Starting Point for Trade Financing edit edit source
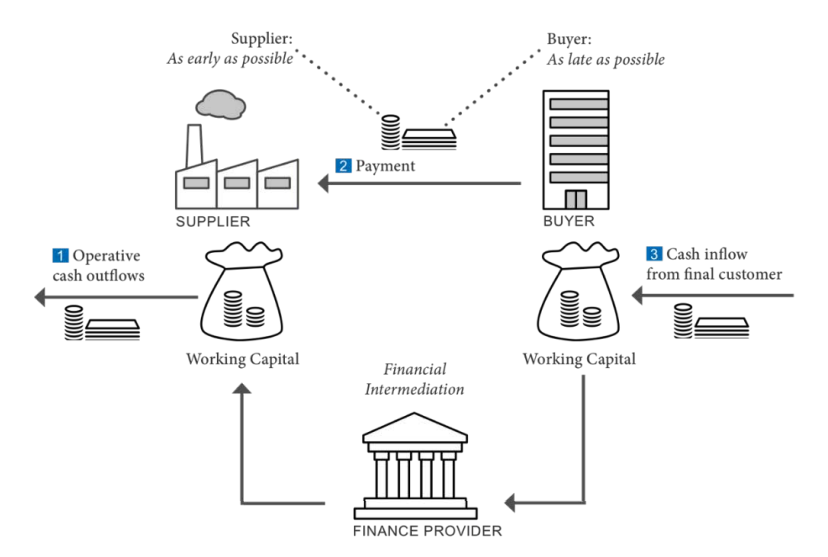
The working capital ratio (current assets/current liabilities) indicates whether a company has enough short-term assets to cover its short-term debt. Balanced cash management in a business is essential because insufficient cash and no alternative funding means there are not enough funds to meet obligations such as buying raw materials or paying wages and overheads. Too much cash, on the other hand, means a company has idle funds for which it foregoes investment. Holding too much inventory has implications for the financial performance of a business in the form of costs for storage, handling, insurance, etc., and cash tied up that could be used otherwise. The right balance is a trade-off between liquidity versus profitability. As illustrated in the diagram below, suppliers need to get paid as early as possible, while buyers want to pay as late as possible. When the cash collection of suppliers slows down, suppliers have limited practical alternatives. They can extend the credit line or take out short-term debt with their local bank; they can use the accounts receivable as collateral to raise cash; or extend their payables. Depending on the size, location, and credit-worthiness of the suppliers, only limited options may be available—if alternative financing is not feasible, they may need to slow down their business. The underlying friction between suppliers’ and buyers’ objectives was severely magnified during the 2008 financial crisis.
Source: IMF Staff.
Micro, small and medium-sized enterprises, especially in developing countries, are often faced with a mixture of structural constraints and are required to set aside large collaterals against trade loans or pay high fees. Long waiting times, the combination of costs with high coordination efforts, foreign currency risks and time restrictions, make L/Cs cumbersome especially for this group of enterprises. The availability of trade finance often depends on the extent to which the local banking sector is developed and internationally networked.[2]
L/Cs and other short-term pre-shipment trade loans and guarantees ensure payment for suppliers, on time and for the correct amount, before the actual change of ownership occurs and financial assets and liabilities are created. This is in contrast to trade credit and advances, when financial instruments are created concurrently with the change of ownership. Once the conditions of the L/C are met, the supplier receives payment, and the buyer receives the documents needed to claim ownership.
Rejected trade finance requests from SMEs, and the global financial and economic crisis, exposed an incomplete trade finance market with demand exceeding supply, alarming new businesses, market observants and political leaders.[3]
SCF solutions refer to instruments allowing the largest company of a supply chain to use its superior credit rating to give its lower-rated suppliers access to financing at more favourable rates than they would obtain otherwise. Benefits include lengthening payment terms for buyers and shortening them for suppliers, thus improving working capital for both. New SCF solutions are offered by SCF providers (Fintechs) or directly by banks that have SCF in their service portfolio.
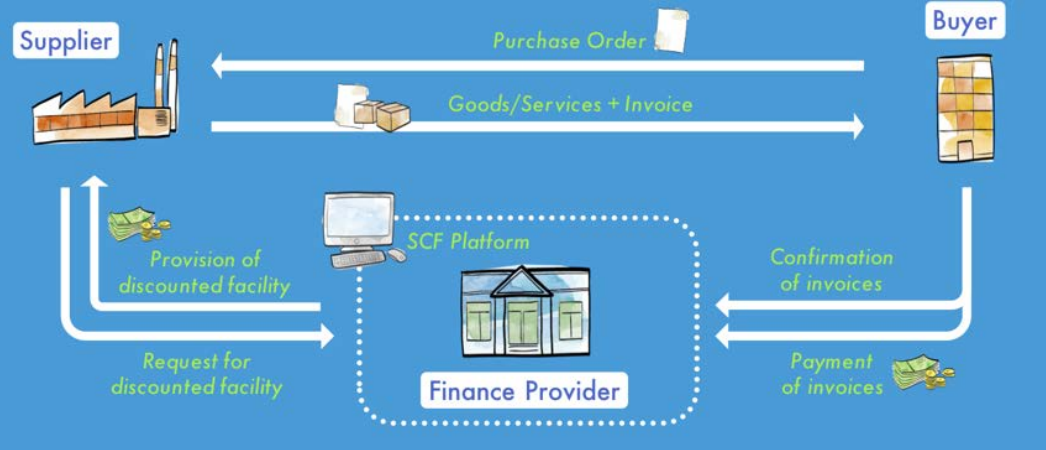
SCF is enabled through integrated technology platforms – SCF portals– that make it possible to extend payment terms to buyers while accelerating payment to suppliers (see Figure 3). Suppliers of all sizes upload their invoices directly to the portal or send their invoice using specific accounting software. The buyer approves the invoice for early payment by the SCF provider and the full invoice amount less a financing fee is transferred to the supplier’s bank account. At maturity of the invoice period (with or without extension), the buyer will pay the due amount directly to the finance provider (if the supplier has sold the invoice) or to the supplier’s bank account (if the supplier has not sold the invoice).
Programs are connected with multi-funding sources to deal with multiple currencies and jurisdictions as well as to work with non-investment-grade or unrated companies. Globally operating banks see SCF as an important new area of their activity and focal point of current research and development. It is expected that the Internet of Things (IoT) and smart contracts will allow real-time tracking of goods which could become a powerful big data source for real-time data.
In developing economies, supply chain financing could enable financial intermediaries to provide funding to SMEs without having to accept their risk, basing the risk assessment on the creditworthiness of the onboarding buyers. The African Development Bank estimated that Africa has an unmet demand for trade finance of more than US$90bn and Asia of $425bn annually.[4]
Source: IMF Staff.
Special cases of SCF are (i) loan or advances against inventory – an asset-based financing instrument where the finance provider obtains title over the goods as collateral (e.g., Finetrading); (ii) inventory repurchase (repo) agreements, or buy-back agreements where the buyer/supplier temporarily “sells” its inventory to a financing entity, and “buys’ it back after a predetermined time; however, the inventory stays on the balance sheet and the funds received are recorded as liability until the repurchase takes place within the pre-agreed upon period.
Finetrading, in contrast, is not considered a financial transaction because the Finetrader acquires the goods and not the claim. Finetrading combines ‘Finance’ and ‘Trading’ especially by SMEs. The Finetrader takes ownership and pre-finances the goods on behalf of the buyer for a defined financing period. For the buyer, the benefits are reduced inventory and improved working capital, while the supplier gets paid immediately. Finetrading is a trade finance tool typically provided by intermediaries other than banks.
Secondary markets
Because of the difficulties SMEs often face with obtaining credit through regular channels, securitization (in addition to SCF) could enhance the financial base by enabling risk-transfer from banks to a wider pool of investors beyond the banking sector. Depending on the size of the market, SCF and securitization may also contribute to a decrease in financial stability.
Currently, there is no comprehensive global dataset separately covering trade finance statistics.
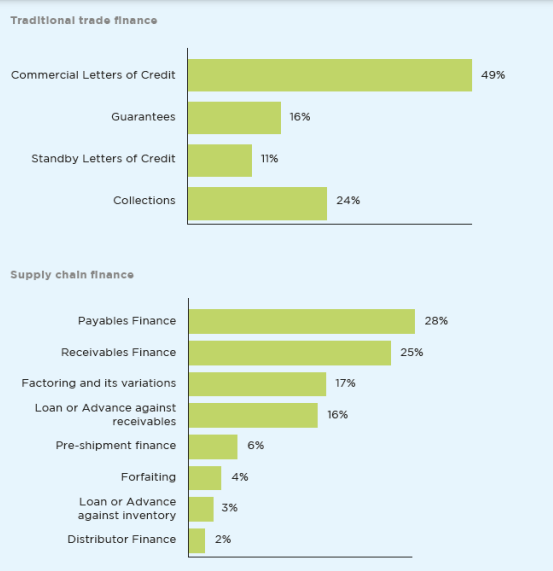
trade finance encompasses a wider range of instruments at the financiers’ disposal (see Figure 4)—these financial instruments require additional breakdowns to the standard financial account classifications and components.
Traditional L/Cs are not included in the macroeconomic statistics because they are considered contingent instruments, therefore off-balance sheet and not recorded as financial assets. Therefore, extensions are required to the current macro-statistical frameworks to facilitate an accurate measurement of domestic and cross-border trade finance.
Most Used Instruments in Traditional Trade and Supply Chain Finance
Source: Source: ICC Global Survey on Trade Finance 2018
The G20 acknowledged that international statistics produce insufficient data on trade finance and asked to “coordinate and establish a comprehensive and regular collection of trade credit in a systematic fashion.”
To fill the data gap during the latest global financial crisis, the IMF and the Bankers' Association for Finance and Trade (BAFT) conducted four ad hoc surveys of banks between 2008 and 2010 on volume, prices, and drivers of trade finance.[5]
New Supply Chain Finance (SCF) Instruments edit edit source
SCF Definition Established by the Global Supply Chain Finance (GSCF) Forum
Supply Chain Finance is defined as the use of financing and risk mitigation practices and techniques to optimize the management of the working capital and liquidity invested in supply chain processes and transactions.
SCF is typically applied to open account trade and is triggered by supply chain events. Visibility of underlying trade flows by the finance provider(s) is a necessary component of such financing arrangements which can be enabled by a technology platform. […]
[The buyers and sellers] often have objectives to improve supply chain stability, liquidity, financial performance, risk management, and balance sheet efficiency. SCF is not a static concept but is an evolving set of practices.
Accounts Receivable Centric
SCF Category Accounts or trade receivables refer to the outstanding invoices that a supplier has vis-à-vis the buyer of its goods and services. Receivables are recorded separately on the balance sheet as short-term claims. Using a receivables purchase program, the supplier sells all or parts of these outstanding claims to a financial intermediary or SCF service provider which takes full legal and economic ownership (and not just a security interest in the collateral); in return, it provides the supplier with working capital in form of advance payments less the financial service charge (called discount), reducing the days sales outstanding (DSO) and providing much needed liquidity the company can work with.
The following three techniques on the market are seller (supplier)-led programs.
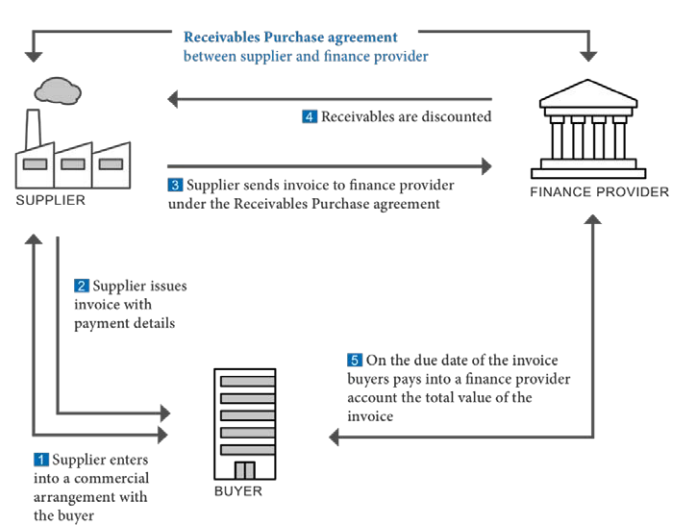
(1) Receivables Discounting (Annex Figure 1) allows suppliers with outstanding short-term invoices mostly vis-à-vis multiple buyers to sell their receivables to a financial provider at a discount. This instrument is usually reserved to investment-grade suppliers that have a minimum credit rating. This allows the finance provider to offer this program on a full or partly “without recourse”[6] basis; i.e., the supplier can remove the accounts receivables'' completely or partly from its balance sheet, and the finance provider bears the risk in case the buyers fail to perform their payments. A trade credit insurance can limit the risk exposure of the finance provider. This financing transaction between the supplier and a finance provider can be made with or without the knowledge of the buyers; and depending on the situation in some cases, the buyers may be asked to validate their accounts payables.
Source: IMF Staff.
At maturity, the buyers pay the amounts of the invoices into the bank account (i) of the supplier, with limited access rights of the supplier; (ii) of the finance provider (the finance provider does not have to be a bank); or (iii) of the supplier without restriction, adding an additional element of risk for the finance provider.
The buyer benefits from extended credit terms in a stable supply chain environment. The supplier profits from increased short-term liquidity. And the finance provider provides services in a relatively stable non-speculative financial environment.
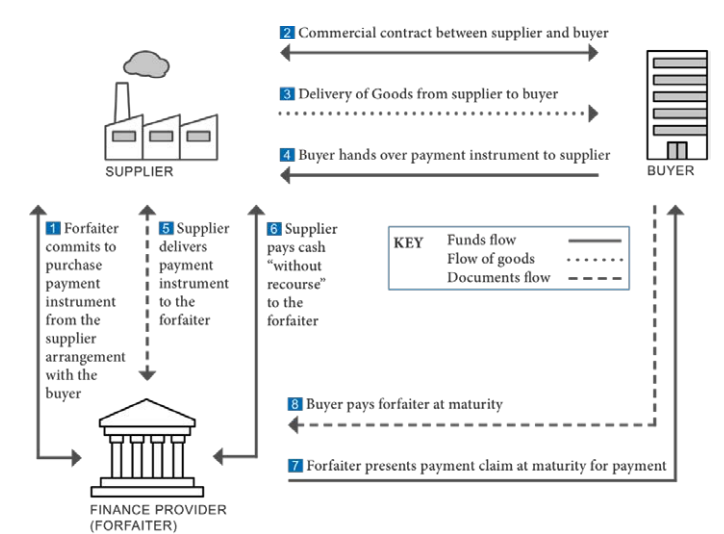
(2) Forfaiting (Annex Figure 2) is an export-oriented form of supply chain finance where a forfaiter (finance provider) purchases from the supplier, without recourse, future payment obligations and trades these as negotiable debt instruments in the form of bills of exchange, promissory notes, or Letters of Credit (L/Cs) on the secondary forfaiting market. These payment instruments are legally independent from the underlying trade and require a guarantee by a third party (normally the buyer’s bank).
Source: IMF Staff.
In the secondary market, forfaiters deal with financial investors. In the primary market, the supplier approaches the forfaiter before signing the contract with the buyer. The buyer obtains a bank guarantee and provides the documents that the supplier requires to complete the forfaiting. After receiving 100 percent cash payment against delivery of the payment (debt) obligation, the supplier has no further interest in the transaction, because the forfaiter must collect the future payments plus forfaiting costs (included in the invoice price) via the guarantor from the buyer. Forfaiting involves mostly medium-to-long-term maturities, and is most commonly used in large, international sales of capital goods.
Forfaiting helps suppliers trade with buyers of countries with high levels of risks, and obtain a competitive advantage by being able to extend credit terms to their customers. While the without-recourse-sale eliminates all risks for the supplier, the forfaiter charges for credit risks as well as for covering the political, commercial, and transfer risk related to the importing country, which is also linked to the length of the loan, the currency of transaction, and the repayment structure. The costs are higher than commercial bank financing, but more cost effective than traditional trade finance tools. Forfaiting is only used in international trade financing.
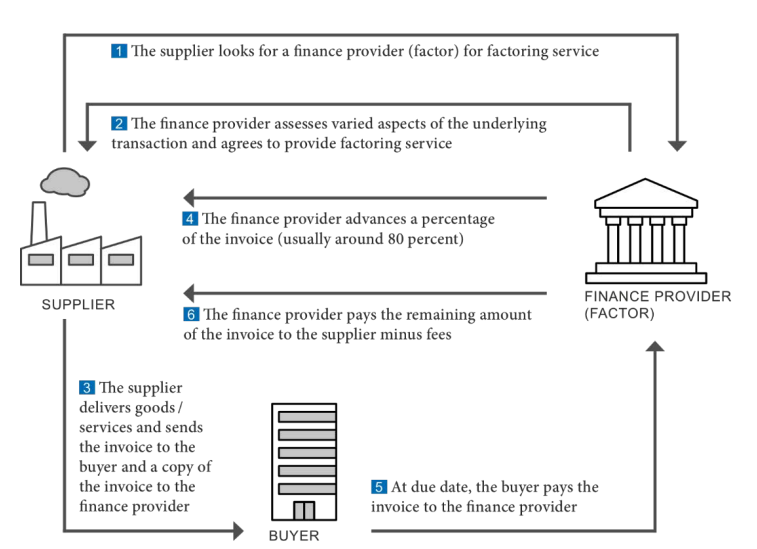
(3) Factoring (Annex Figure 3) targets the domestic and international market, whereby the latter often includes two “factors,” one in each country. The suppliers, often SMEs, receive around 80 percent of the invoice value from the factor as advance payment, and a remaining, but discounted, value when payment is due by the buyer. The fees and discounts are borne by the supplier in return for the factor’s services of advancing funds and managing the collecting of the receivables from the buyer. Because factoring is available with and without recourse, depending on the circumstances in the market, the factoring institution may add a credit insurance. Factoring provides suppliers with working capital, albeit discounted, allowing them to continue trading, while the factor receives margins from rendering the service.
Source: IMF Staff.
Asset-based financing linked to the physical supply chain is not a new concept. There are a variety of traditional techniques for accessing finance both pre- and post-shipment. However, traditional factoring is often not fit for purpose for small businesses, as it typically entails long-term, complex contracts with fixed volumes.[7] The innovations with SCF are the automated business processes and e-invoicing tools that are based on a central technology platform simultaneously accessed by buyers, sellers, and SCF providers.[8]
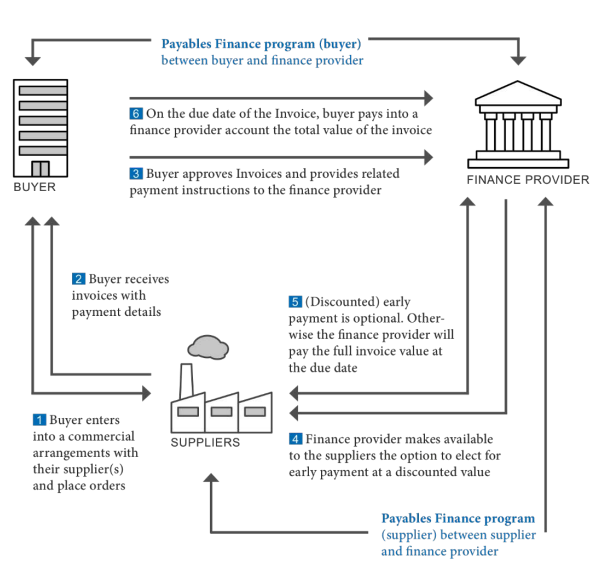
(4) Reverse Factoring, also known as Approved Payables Finance,[9] is a buyer-led and arranged financing program for designated suppliers in the supply chain (Annex Figure 4). The buyer’s creditworthiness allows the supplier to receive an early discounted payment for the accounts receivables, typically without recourse. The buyer will later pay the due amount directly to the finance provider. Buyers can be large and medium-sized and at times even near non-investment grade (given, an established buyer-finance provider relationship exists); however, buyers only arrange the financing, they are not part of the financing transaction. As with previous cases, the assets are changing ownership from the suppliers to the financial intermediary. The early financing is for 100 percent of the receivables less a discount, which is lower than with conventional trade financing. As before, the buyer receives an extended term for payment in a secured supply chain environment.
Source: IMF Staff.
(4a) Dynamic Discounting is a variation to (4), where buyers use their own funds in to decide how and when to pay their suppliers in exchange for a discount on the purchased goods. The earlier the payment, the larger the discount. The buyers can use their own access liquidity to generate additional income, while the supplier can optimize the days outstanding and the working capital.
Dynamic discounting is a typical example where Fintech companies[10] entered the market as providers of web-based platforms that allow both parties to upload, view, and approve invoices for early payment. For the buyers, there is no additional cost; the suppliers are charged a fee once they request early payment of the approved invoices.
Overall, in this category of Accounts Receivable Financing the financial claims move from the suppliers’ books to the SCF providers (the service provider or directly to the finance provider); hence, no new financial debt is created in the books of the suppliers for receiving early payment, in return for new liquidity. On the creditor side, SCF programs[11] can be self-funded by the buyers, or composed of a mixed program where financing is shared by the buyers, capital markets, and financial institutions.
Loan/Advance based SCF category
The second SCF category is based on loans and advances, where financing is usually provided in return for rights to a collateral, and the loan is recorded as a liability in the beneficiaries’ balance sheet.
(5) The new edge to an existing instrument called Distributor Financing (or Channel Financing) is that large Multinational corporations [MNCs (as suppliers)] are using this instrument increasingly for expanding into emerging markets. The MNCs support the financing of a geographically important (network of) established distributors against their retail inventory, and the distributors repay their debt once the inventory is sold. Although the finance provider (e.g., local bank) is providing the funds and taking on the risks, often MNCs subsidize the financing by absorbing part of the interest margins or engaging in other forms of risk-sharing arrangements, and through reputational support. MNCs directly benefit from their suppliers’ sales of goods to these distributors (buyers), and indirectly, because a sound supply chain allows end-customers to profit from products that can be delivered without delay. Distributor Financing has limited impact on MNCs balance sheets compared to foreign direct investment. Therefore, Distributor Financing can be an alternative to direct investment and preferred to establishing inventory-carrying subsidiaries abroad. Through the engagement of the MNCs, distributors profit from better loan prices and bridging liquidity gaps. The collateral for the finance providers is usually an assignment of rights over the inventory.
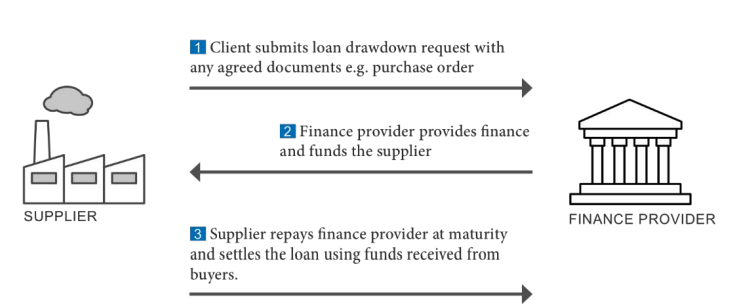
(6) With Loan or Advance against Receivables (Annex Figure 5), the financial intermediary provides advances or loans to suppliers that are collateralized with future or current receivables, while collateralization may be formalized or accepted informally. The suppliers repay the loans upon maturity and interest on an accrual basis.
Source: IMF Staff.
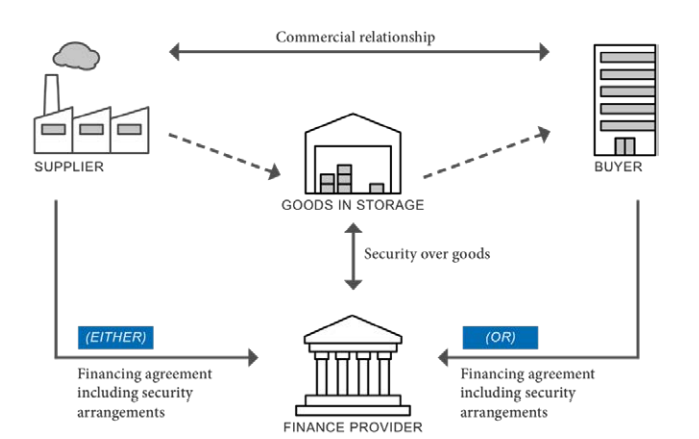
(7) Loan or Advance against Inventory (Annex Figure 6) is an asset-based financing instrument in form of a credit line for suppliers and buyers along the physical supply chain to raise funds “instead of locking unused value inside a warehouse.” The finance providers obtain title over the goods as collateral and utilize on-site inspections and property insurance for risk mitigation. Furthermore, finance providers base their lending on the inventory’s appraised value, which is usually lower than the market value, and finance about 80 percent of this amount. For finished goods or work-in-progress, finance providers may also require purchase orders (on behalf of the buyers) or purchase contracts (on behalf of an end customer). The transactions are settled regularly at the time inventory is used for production or sold off to customers. Although inventory financing is more expensive than other SCF instruments, for a certain market, it still provides advantageous terms, such as the ability to accumulate inventory and optimize working capital for lower rates than conventional bank financing.
Source: IMF Staff.
(7a) Financing of “toll manufacturing” of the inventory is a variation of (7); toll manufacturing is what the System of National Accounts (SNA) calls “manufacturing services on physical inputs owned by others” (as opposed to contract manufacturing, where the manufacturer owns and provides the raw materials).
(7b) Inventory repurchase (repo) agreement or buy-back agreement is a special case of inventory financing when the buyer/supplier temporarily “sells” its inventory to a financing entity, and “buys’ it back after a predetermined time. What appears to be a sale and buy-back is in fact not recognized as a true sale by the accounting bodies. Therefore, the inventory stays on the balance sheet and the funds received are recorded as liability until the repurchase takes place within the pre-agreed upon period (usually 30, 60 or 90 days).
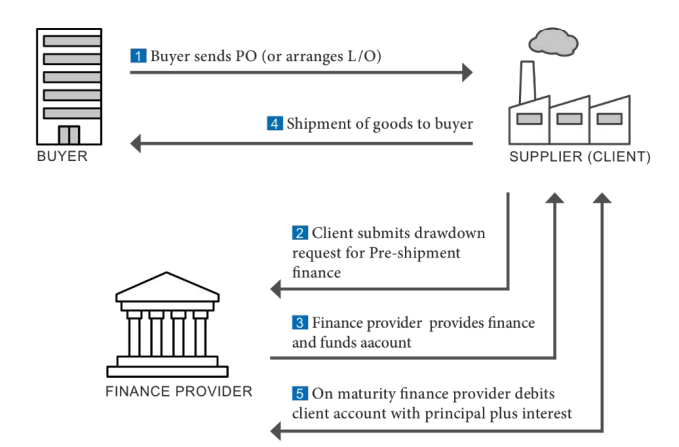
(8) Pre-Shipment Financing (sometimes called “Packing credit”) is illustrated in Annex Figure 7). A manufacturer receives financial assistance for purchasing raw materials, processing, and packing the finished goods for exporting. Although the financial transaction is between the manufacturer and the finance provider, the creditworthiness and reliability of the buyer play a role in negotiations, and so does the manufacturer’s reputation to perform and deliver. A prerequisite for granting the financing may often be (i) a specific kind of L/C from the buyer and their bank or a confirmed and irrevocable purchase order (PO) for the export of goods; (ii) the documents relating to the raw materials may be pledged to the finance provider as collateral; and (iii) the granting of inspections to the finance provider during the manufacturing cycle.
Source: IMF Staff.
Although trade credit contracts are common, the cost of finance to small firms to fund the working capital gap is much higher compared to large firms because of their typically higher credit risk. And in practice the timing of the payment may be longer than a typical 30-day term, especially when the buyer is a large corporate-sized firm and the supplier is an SME, due to the greater bargaining power of the former (Fabbri and Klapper, 2016; Cho et al., 2019). The timing of the payment may be stretched out even further by practices of late or extended payments by some large buyers to hold onto cash longer, or improve their financial performance (Randall and Farris, 2009; Paul and Boden, 2011).
Payback inventory finance is costlier than factoring or invoice discounting (Tanrisever et al., 2017).
Much less attention has been given to SMEs, who are often claimed to be the main beneficiaries of SCF arrangements.
Working capital gap or Cash Conversion Cycle (CCC) (Adapted from Richards and Laughlin, 1980, p. 35)
File:Working capital gap or Cash Conversion Cycle (CCC).png
The lower the Cash Conversion Cycle (CCC), the better, all other things being equal. Firms can reduce their working capital gap or CCC by 1) lowering inventories held; 2) reducing accounts receivable by requesting customers to pay early or shorten customer payment terms; and/or 3) increasing accounts payable by paying their suppliers late or extending supplier payment terms (Randall and Farris, 2009).
Reverse factoring is currently the most popular and most cited SCF mechanism due to its potential to help reduce payment tensions between buyers and suppliers in managing cash flow and working capital (Randall and Farris, 2009). Nevertheless, reverse factoring may not be the right financing option for every business. This popular SCF practice is currently available to large corporate firms and their strategic suppliers, but there are several SCF mechanisms that can be used to finance working capital gaps.
According to Gelsomino et al. (2016a), both trade credit and working capital management are closely linked to SCF.
Trade credit is a form of short-term finance with no interest, extended by a supplier to its buyer primarily to win business or enhance sales (Fabbri and Klapper, 2016). Trade credit accounts for about 40 percent of the current liabilities of firms (Borde and McCarty, 1998).
Trade credit would be a practical source of short-term finance for downstream supply chain members if the supplier were a large company that had cash reserves (i.e. internal source) or had relatively easy access to inexpensive bank credit (i.e. external source). However, many suppliers are SMEs (Small and Medium-sized Enterprises), but still have to provide trade credit to large buying firms in order to win business, build relationships with buyers, or signal the quality of their goods and the strength of their financial status (Peel et al., 2000). Such providers, therefore, need finance (SCF) to fund the gap.
Credit terms or payments terms can vary widely among different industry sectors, generally ranging from 30 to 90 days.
Key SCF actors
SCF arrangements typically involve either two or three main actors. The two main parties in SCF relationships are primary supply chain members: suppliers (sellers) and buyers. The third actor is an external funder, a bank or a non-bank financial institution such as the recently collapsed Greensill Capital (Ramnarayan, 2021). In recent years, another actor ─ a technology (platform) provider ─ has played an increasingly significant role in SCF arrangement. The main role of technology providers, generally known as FinTechs (financial technology firms), is to provide an online transaction platform (i.e. an SCF platform) to facilitate the exchange of information between buyers, suppliers and, external funders, especially in two SCF arrangements ─ reverse factoring and dynamic discounting, as displayed in Table 2-2 (Deutsche Bank, 2018). A fifth potential actor is a credit insurer who provides credit risk mitigation in some SCF arrangements such as distributor finance (Global Business Intelligence Corp, 2012).
| Platform provider (Fintech) | SCF mechanism | ||
|---|---|---|---|
| Reverse factoring | Dynamic discounting | Distributor finance | |
| TradeIX | √ | ||
| Kyriba | √ | √ | |
| Demica | √ | ||
| Taulia | √ | √ | |
| Orbian | √ | ||
| PrimeRevenue | √ | ||
Banks may own the platform or utilise a third-party platform provider. For example, Barclays and PrimeRevenue are partnering to offer reverse factoring to Barclays’ customers such as the Co-op food company (PrimeRevenue, 2020). The potential benefit of using a third-party platform provider is that corporate customers can choose between using their own funds, or single or multiple external funders. Alternatively, some firms may develop their own platforms (PrimeRevenue, 2014). Table 2-3 shows the three types of platform used to facilitate SCF transactions together with the involved SCF actors. The table comes from the cited source, and it is not completely clear what the relationships is between the corporate firm and platform provider in the case of ‘in-house development platforms’.
| Type of platform | Firm | Platform provider | Funder |
|---|---|---|---|
| Bank proprietary platforms | Nestle | Citi | |
| Unilever | Santander | ||
| Third-party platform | Sainsbury’s | PrimeRevenue | RBS |
| Co-op | Demica Citadel | Multiple | |
| In-house developed platform | Carrefour | Santander, BNP Paribas, Unibanco | |
| Metro Group | Deutsche Bank |
The basic mechanics of the common SCF mechanisms, as explained later in Section 2.5, are based on a simplified model of a single bank providing funding. In practice, there are several funding models available through a combination of funders (banks or non-banks) and platform providers (in-house or outsourced). These funding models are outlined in Table 2-4.
Using a longitudinal case study of a focal firm, Motorola, Blackman et al. (2013) explore the concept of FSC and find that sharing financial data with suppliers helps generate cost savings for both parties and improves the payment process as well as reducing risk. Two studies emphasize collaboration and the network features of SCF.
Regarding reasons to adopt SCF, the primary objective is to extend payment terms or Days Payable Outstanding (DPO) (Van der Vliet et al., 2015; Liebl et al., 2016). Some firms aim to reduce risk in supply chains (Caniato et al., 2016; Liebl et al., 2016) while only a few adopt SCF for the purpose of process simplification (Liebl et al., 2016).
The results show the benefits for the buyers in providing three SCF practices: around 70% of the total benefits come from inventory finance, 29% from RF while only 1% from dynamic discounting (Gelsomino et al., 2019). This is in line with Huff and Rogers (2015) who find that a change of inventory strategy (Days Inventory Outstanding: DIO) has a larger impact on financial performance than change of payment terms (Days Sales Outstanding: DSO or Days Payable Outstanding: DPO).
| Factoring | Invoice Discounting | Reverse factoring | Distributor finance | |
|---|---|---|---|---|
| Year ended 31 December 2019 | Year ended 31 December 2020 | Year ended 31 December 2021 | |
|---|---|---|---|
| (£'000) | (£'000) | ||
| Revenue | 4 | 1,147 | 538 |
| Cost of sales | (767) | (739) | (804) |
| Gross (loss)/profit | (763) | 408 | (266) |
| Administrative expenses | (98) | (1,904) | (4,165) |
| Other operating income | 174 | 53 | 0 |
| Operating loss before deemed cost of listing and acquisition related costs and impairment charge | 0 | (1,443) | (4,431) |
| Deemed cost of listing | 0 | (1,376) | 0 |
| Transaction costs | 0 | 0 | (2,009) |
| Amortisation of intangible assets arising on acquisition | 0 | 0 | (391) |
| Acquisition related earn-out payments | 0 | 0 | (1,410) |
| Impairment of charges | 0 | 0 | (2,573) |
| Operating loss | (687) | (2,819) | (10,814) |
| Finance costs | 0 | 0 | (1,341) |
| Loss before tax | (687) | (2,819) | (12,155) |
| Income tax | 133 | (145) | (332) |
| Loss for the year | (551) | (2,964) | (12,487) |
| As at 31 December 2019 | As at 31 December 2020[12] | As at 31 December 2021 | |
|---|---|---|---|
| (£'000) | (£'000) | ||
| Non-current assets | 390 | 1,236 | 7,895 |
| Intangible assets and goodwill | 0 | 2 | 17 |
| Tangible assets | 422 | ||
| Deferred tax asset | 1,660 | 7,912 | |
| Total non-current assets | 390 | ||
| Current assets | |||
| Trade and other receivables | 919 | 1,113 | 896 |
| Cash and cash equivalents | 143 | 552 | 1,727 |
| Total current assets | 1,062 | 1,665 | 2,623 |
| Total assets | 1,452 | 3,325 | 10,535 |
| Current liabilities | |||
| Trade and other payables | 1,810 | 3,373 | 3,500 |
| Derivative financial instruments | 0 | 24 | |
| Loan notes | 0 | 0 | 5,732 |
| Total current liabilities | 1,810 | 3,397 | 9,232 |
| Net current liabilities | (748) | (1,732) | (6,609) |
| Non-current liabilities | |||
| Long-term borrowings | 0 | 22 | 1,284 |
| Provisions | 199 | 358 | 340 |
| Deferred tax liabilities | 1,104 | ||
| Total non-current liabilities | 199 | 380 | 2,728 |
| Net liabilities | (557) | (452) | (1,425) |
| Total equity | (557) | (452) | (1,425) |
| As at 31 December 2019 | As at 31 December 2020[13] | As at 31 December 2021 | |
|---|---|---|---|
| (£'000) | (£'000) | (£'000) | |
| Cash flows from operating activities | |||
| Loss for the year | (687) | (2,819) | (10,814) |
| Adjustments for non-cash costs relating deemed cost of listing and acquisition related costs and impairment charge | |||
| Deemed cost of listing in reverse acquisition | 0 | 1,376 | |
| Acquisition related transaction costs | 1,900 | ||
| Acquisition related earn-out payments | 1,410 | ||
| Amortisation of intangible assets arising on acquisition | 391 | ||
| Impairment charges | 2,573 | ||
| 0 | 1,376 | 6,274 | |
| Other non-cash adjustments | 0 | 16 | (70) |
| Other depreciation and amortisation | 94 | 203 | 396 |
| Increase to provisions | 0 | 40 | 52 |
| Decrease/(increase) in accrued income | (46) | ||
| Decrease/(increase) in trade receivables | (1) | (717) | 505 |
| Increase/(decrease) in trade and other payables | (119) | 296 | 77 |
| Other decreases/(increases) in net working capital | 967 | 686 | (158) |
| Net cash flows from operations | 275 | (919) | (3,784) |
| Finance costs paid in cash | (2) | ||
| Income taxes paid in cash | 0 | (19) | (89) |
| Other collections | 0 | 6 | |
| Net cash flow from operating activities | 275 | (932) | (3,875) |
| Cash flows from investing activities | |||
| Cash from reverse acquisition of Abal plc | 0 | 93 | |
| Acquisition of property, plant and equipment | 0 | (2) | (7) |
| Acquisition of intangible assets | (132) | (1,026) | (1,020) |
| Cash consideration on acquisition of Tradeflow, net of cash acquired | (3,523) | ||
| Net cash flows from investing activities | (132) | (935) | (4,550) |
| Cash flows from financing activities | |||
| Increase/(decrease) in long-term borrowings | (2) | 22 | |
| Net cash inflow from Mercator loan notes | 6,629 | ||
| Other finance costs paid in cash | (25) | ||
| Cash inflow from Negma convertible loan notes | 5,000 | ||
| Cash repayment to Negma convertible loan notes | (2,016) | ||
| Proceeds from issue of ordinary shares, net of allowable issue costs | 0 | 2,230 | |
| Net cash flows from financing activities | (2) | 2,252 | 9,588 |
| Net increase in cash and cash equivalents | 141 | 385 | 1,163 |
| Foreign exchange differences to cash and cash equivalents on consolidation | 0 | 24 | 12 |
| Cash and cash equivalents at 1 January | 2 | 143 | 552 |
| Cash and cash equivalents at 31 December | 143 | 552 | 1,727 |
Peers
Supply chain finance
| Bloomberg ticker | Company name | Primary exchange | Market capitalisation ($) | Adjusted EV/sales |
|---|---|---|---|---|
| 9959 HK Equity | Linklogis Inc | Hong Kong | 7,424,976,896 | |
| TRE SJ Equity | Trencor Ltd | Johannesburg | 954,440,704 | |
| NISN US Equity | NiSun International Enterprise | Nasdaq Capital Market | 18,756,078 | |
| SSIF LN Equity | Secured Income Fund plc | London | 7,899,053 | |
| XPTFX US Equity | Federated Hermes Project & Trade Finance Tender Fund | Nasdaq Global Market |
| Bloomberg ticker | Company name | Primary exchange | Market capitalisation ($) | Adjusted EV/sales |
|---|---|---|---|---|
| CGCL IN Equity | Capri Global Capital Ltd | Natl India | 130,470,649,856 | |
| LOFC SL Equity | LOCL Finance PLC | Colombo | 117,433,139,200 | |
| BDFIN BD Equity | Bangladesh Finance And Investment Co., Ltd. | Dhaka | 8,301,219,328 | |
| GILF IN Equity | Gilada Finance & Investments Limited | BSE India | 284,496,288 | |
| VANI IN Equity | Vani Commercials Limited | BSE India | 186,088,832 | |
| UFCI OM Equity | United Finance Co SAOG | Muscat | 22,345,242 | |
| PROB MB Equity | BC Procredit Bank SA | Moldova | ||
| ILFC NK Equity | International Leasing & Finance Company Ltd. | Nepal Stock | ||
| AEFL NK Equity | Alpic Everest Finance Company Ltd. | Nepal Stock | ||
| EBL NK Equity | Everest Bank Ltd. | Nepal Stock |
| Bloomberg ticker | Company name | Primary exchange | Market capitalisation ($) | EV/sales | Adjusted EV/sales |
|---|---|---|---|---|---|
| 4733 JP Equity | OBIC BUSINESS | 336,301,850,624 | |||
| VENTANA CI Equity | VENTANAS | 170,808,934,400 | |||
| 072700 KF Equity | DOUZONE HOLDINGS | 127,448,203,264 | |||
| ZOFRI CI Equity | ZOFRI | 97,343,832,064 | |||
| 600153 CH Equity | XIAMEN C & D-A | 43,064,098,816 | |||
| 9629 JP Equity | PCA CORP | 30,307,201,024 | |||
| EBAY US Equity | EBAY INC | 24,441,364,480 | |||
| 4659 JP Equity | AJIS CO LTD | 22,070,188,032 | |||
| 9145 JP Equity | BEING HOLDINGS C | 10,591,254,528 | |||
| 4428 JP Equity | SINOPS INC | 7,595,841,024 | |||
| KULC HB Equity | KEY-SOFT COMPUTE | 6,899,999,744 | |||
| CLASB SS Equity | CLAS OHLSON-B SH | 5,238,159,872 | |||
| NETBAY TB Equity | NETBAY PCL | 4,960,000,000 | |||
| SPSC US Equity | SPS COMMERCE INC | 4,757,506,048 | |||
| 9326 JP Equity | KANTSU CO LTD | 4,641,994,752 | |||
| 9060 JP Equity | JAPAN LOGISTIC S | 4,502,673,920 | |||
| 300531 CH Equity | SHENZHEN UROVO-A | 4,371,670,016 | |||
| HTTBT TI Equity | HITIT BILGISAYAR | 3,603,150,080 | |||
| 3840 JP Equity | PATH CORP | 2,797,461,504 | |||
| 300240 CH Equity | JIANGSU FEILIK-A | 2,691,648,256 | |||
| 9327 JP Equity | E-LOGIT CO LTD | 2,352,000,000 | |||
| USAC US Equity | USA COMPRESSION | 1,804,090,240 | |||
| CPCS IN Equity | COMPUCOM SOFTWAR | 1,705,147,776 | |||
| WABC US Equity | WESTAMERICA BANC | 1,641,661,696 | |||
| SVLL IN Equity | SHREE VASU LOGIS | 1,605,240,064 | |||
| OBASE TI Equity | OBASE BILGISAYAR | 1,363,180,032 | |||
| ACVA US Equity | ACV AUCTIONS-A | 1,238,821,376 | |||
| PUBM US Equity | PUBMATIC INC-A | 812,146,880 | |||
| LINK TI Equity | LINK BILGISAYAR | 742,499,968 | |||
| DKSH MK Equity | DKSH HOLDINGS M | 696,848,704 | |||
| JETCON JA Equity | JETCON CORP LTD | 636,014,976 | |||
| EINC CN Equity | E AUTOMOTIVE | 308,959,968 | |||
| Y CN Equity | YELLOW PAGES LTD | 260,843,024 | |||
| SIF SP Equity | SING INV&FIN | 230,133,616 | |||
| OSP2 GR Equity | USU SOFTWARE AG | 202,582,576 | |||
| AGR GR Equity | AGROB IMMOBILIEN | 159,435,920 | |||
| SRL US Equity | SCULLY ROYALTY L | 117,450,952 | |||
| 540 HK Equity | SPEEDY GLOBAL HO | 87,600,000 | |||
| GMNG CN Equity | GAMELANCER MEDIA | 62,834,980 | |||
| FCAP IN Equity | FRONTIER CAPITAL | 62,355,248 | |||
| UGRO US Equity | URBAN-GRO INC | 48,388,860 | |||
| BEST US Equity | BEST INC - ADR | 40,232,960 | |||
| ALPRG FP Equity | PROLOGUE - REG | 20,101,946 | |||
| GRNQ US Equity | GREENPRO CAPITAL | 8,663,394 | |||
| KSPN US Equity | KASPIEN HOLDINGS | 3,289,285 | |||
| UP CN Equity | UPSNAP INC/CANAD | 843,211 | |||
| TKX CN Equity | TRACKX HOLDINGS | 694,363 | |||
| ONCI US Equity | ON4 COMMUNICATIO | 9,916 | |||
| ERBB US Equity | AMERICAN GREEN I | 6,370 | |||
| CIMPCA CR Equity | ILG INT - COMM A | ||||
| ACBCQ US Equity | ALBINA COMM BNCP | ||||
| CLTY US Equity | CELERITY SOLUTIO | ||||
| DLAD US Equity | DEALERADVANCE IN | ||||
| SMAA US Equity | SMA ALLIANCE INC | ||||
| ENAB US Equity | ENABLE HOLDINGS | ||||
| SYME LN Equity | SUPPLY@ME CAPITA | ||||
| AXCP US Equity | ALLIXON INTERNA | ||||
| AJIA US Equity | AJIA INNOGROUP H | ||||
| HSI/H CN Equity | H-SOURCE HOLDING | ||||
| TAATFFB KY Equity | TA-ASIA TRD 2-B | ||||
| CPLC MX Equity | CENTURION |
| Bloomberg ticker | Company name | Primary exchange | Market capitalisation ($) | EV/next year sales | Sales growth rate | Adjusted EV/sales |
|---|---|---|---|---|---|---|
| 8697 JP Equity | JAPAN EXCHANGE G | 1,065,349,873,664 | 6.52 | 3.79 | ||
| 4385 JP Equity | MERCARI INC | 464,123,854,848 | 2.16 | 41.70 | ||
| ABNB US Equity | AIRBNB INC-A | 61,218,545,664 | 5.75 | 17.94 | ||
| 601933 CH Equity | YONGHUI SUPERS-A | 28,677,115,904 | 0.55 | 8.90 | ||
| JSE SJ Equity | JSE LTD | 9,043,957,760 | 2.63 | 4.62 | ||
| ZG US Equity | ZILLOW GROUP I-A | 8,358,716,928 | 3.63 | 82.81 | ||
| 4017 JP Equity | CREEMA LTD | 3,387,434,496 | 0.29 | 25.89 | ||
| VIIA3 BZ Equity | VIA S/A | 3,340,721,408 | 0.44 | 4.69 | ||
| CCOI US Equity | COGENT COMMUNICA | 2,776,900,864 | 6.00 | 4.27 | ||
| XMTR US Equity | XOMETRY INC-A | 1,951,685,376 | 3.67 | |||
| SSTK US Equity | SHUTTERSTOCK INC | 1,825,134,976 | 2.15 | 7.46 | ||
| SEAT US Equity | VIVID SEATS IN-A | 1,424,404,096 | 2.32 | |||
| KAR US Equity | KAR AUCTION SERV | 1,420,158,336 | 1.49 | -15.78 | ||
| FVRR US Equity | FIVERR INTERNATI | 1,269,222,144 | 2.95 | 57.97 | ||
| NORTHM DC Equity | NORTH MEDIA AS | 1,243,410,048 | 0.69 | -3.35 | ||
| CARS US Equity | CARS.COM INC | 921,888,064 | 2.01 | |||
| VTEX US Equity | VTEX -CLASS A | 714,846,784 | 2.41 | |||
| WDH US Equity | WATERDROP INC | 633,221,376 | 0.69 | |||
| BKKT US Equity | BAKKT HOLDINGS I | 430,377,440 | 21.79 | |||
| EINC CN Equity | E AUTOMOTIVE | 294,041,344 | 1.50 | |||
| BVB RO Equity | BURSA DE VALORI | 270,454,656 | 3.87 | |||
| POWW US Equity | AMMO INC | 243,120,992 | 1.03 | |||
| FRGE US Equity | FORGE GLOBAL HOL | 239,834,048 | 0.43 | |||
| ZOO LN Equity | ZOO DIGITAL GROU | 158,394,672 | 1.66 | |||
| REAL US Equity | REALREAL INC/THE | 143,176,032 | 0.64 | |||
| FPAY US Equity | FLEXSHOPPER INC | 22,838,344 | 0.93 | |||
| HYRE US Equity | HYRECAR INC | 18,713,888 | 0.18 |
Additional cash since half year
| # | Cash | Loan | Date | Outstanding Open Offer Warrants | Nominal-cost share options | Outstanding Ordinary shares | Deferred Shares | 2018 Deferred Shares | Mercator Repayment Option | Venus Warrants | Exercise price | Expiry date | Comment |
|---|---|---|---|---|---|---|---|---|---|---|---|---|---|
| 1 | £333.08 | 22/11/2022 | 271,908,563 | 56,621,006,384 | https://www.investegate.co.uk/supply--me-capital/rns/exercise-of-warrants--issue-of-equity--and-tvr/202211220700091843H/ | ||||||||
| 2 | £399.96 | 7/11/2022 | 272,421,017 | 56,620,493,930 | |||||||||
| 3 | 2/11/2022 | 897,424,157 | https://www.investegate.co.uk/supply--me-capital/rns/grant-of-awards-under-long-term-incentive-plan/202211020700089984E/ | ||||||||||
| 4 | 1/11/2022 | 56,619,878,595 | 63,084,290 | 224,193,710 | |||||||||
| 5 | (£3,536,553) | 21/10/2022 | https://www.investegate.co.uk/supply--me-capital/rns/repayment-of-mercator-facility-in-cash/202210211401377574D/ | ||||||||||
| 6 | £1,423.80 | 21/10/2022 | 273,036,352 | 56,619,878,595 | https://www.investegate.co.uk/supply--me-capital/rns/issue-of-equity/202210210700036893D/ | ||||||||
| 7 | €1m | 13/10/2022 | Loan. Repayment over a 5-year term, including the initial six months of interest only repayments, followed by 54 months of combined principal and interest repayments. (https://www.investegate.co.uk/supply--me-capital/rns/new-banking-facility/202210130700047718C/) | ||||||||||
| 8 | £4,365,000 + £20,084.24 | (£417,500) | 10/10/2022 | 56,617,688,143 | 2,115,000,000 | 0.065p | 31 December 2025 | ||||||
| 9 | (£1,500,000) | 3/10/2022 | Admission Shares | ||||||||||
| 10 | 30/9/2022 | 43,959,306,348 | |||||||||||
| £675,000 | 18/7/2022 | 1,350,000,000 new shares were issued. 5,585,000,000 new warrants issued to Venus Capital | |||||||||||
| Share warrants | Exercise price | Expiry date | ||
|---|---|---|---|---|
| 30/06/2022 | 7,154,383,065 | |||
| 18/7/2022 | 5,585,000,000 | 0.065p | 31/12/2025 | Venus Capital Warrants (third tranche?) |
| 18/8/2022 | 320,855,041 | Open Offer Warrants | ||
| 31/8/2022 | (5,064,230) | Open Offer Warrants | ||
| 5/9/2022 | 475,000,000 | 0.065p | 31/12/2025 | Venus Capital Warrants (fifth tranche?) |
| 14/9/2022 | (8,058,388) | Open Offer Warrants | ||
| Cash | Comment | ||
|---|---|---|---|
| 18/7/2022 | £675,000 | ||
| 22/7/2022 | £320,855 | Ne proceed is £269,855.04. | |
| 31/8/2022 | £3,289.79 | In relation to the Open Offer Warrants. | |
| 5/9/2022 | £475,000 | In relation to The Fifth Tranche. | |
| 14/9/2022 | £5,237.96 | ||
| Loan | Interest rate | Expiry date | |
|---|---|---|---|
| 18/7/2022 | £100,000 | 10% per annum | 31/12/2025 |
| 18/7/2022 | £308,500 | 10% per annum | 31/12/2025 |
| 5/9/2022 | £47,500 | 10% per annum | 31/12/2025 |
SWOT analysis edit edit source
Strengths edit edit source
- Sharia-compliant inventory finance platform.
- Experienced management team with extensive network of people/contacts.
- Publicly listed company, making it easier to raise finances.
Weaknesses edit edit source
- Financially less strong than other players.
Opportunities edit edit source
- Muslims.
- Technologies and database(s) focused on automation and better finance making decisions.
- DLT
- Smart contracts
- IoT
- Big data
- Machine learning.
Threats edit edit source
- Lack of innovation.
- Local government(s) may have a different view about the classification of the company's finance product/platform.
Off-balance sheet (OBS) transaction edit edit source
An off-balance sheet (OBS) transaction is a type of financial arrangement in which a company does not record certain assets or liabilities on its balance sheet. The main benefit of an OBS transaction is that it can help a company to manage its financial statements in a way that makes its financial position appear stronger than it would if the assets or liabilities were recorded on its balance sheet.
One of the primary benefits of OBS transactions is that they can help a company to manage its level of debt and leverage, by allowing it to keep certain liabilities off its balance sheet. This can make the company's debt-to-equity ratio appear lower, which can be attractive to investors and creditors.
Another benefit of OBS transactions is that they can help a company to manage its level of risk. By keeping certain assets or liabilities off its balance sheet, a company can limit its exposure to certain types of risk. For example, if a company enters into an OBS transaction to finance a project, it can limit its exposure to the project's risks by not recording the project's assets and liabilities on its balance sheet.
It's important to note that while OBS transactions can provide certain benefits to companies, they can also be a source of financial risk, and can make it difficult for investors and analysts to understand a company's true financial position.
Additionally, the accounting standards have been updated to provide more transparency for off-balance sheet transactions and to ensure that these transactions are not used to deliberately mislead the investors.
How does a supply chain finance platform works and what is the main benefit of the platform? edit edit source
The main role of technology providers, generally known as FinTechs (financial technology firms), is to provide an online transaction platform (i.e. an SCF platform) to facilitate the exchange of information between buyers, suppliers and external funders.
Banks may own the platform or utilise a third-party platform provider. The potential benefit of using a third-party platform provider is that corporate customers can choose between using their own funds, or single or multiple external funders.
Using a longitudinal case study of a focal firm, Motorola, Blackman et al. (2013) explore the concept of financial supply chain (FSC) and find that sharing financial data with suppliers helps generate cost savings for both parties and improves the payment process as well as reducing risk. Two studies emphasize collaboration and the network features of SCF.
Regarding reasons to adopt SCF, the primary objective is to extend payment terms or Days Payable Outstanding (DPO) (Van der Vliet et al., 2015; Liebl et al., 2016). Some firms aim to reduce risk in supply chains (Caniato et al., 2016; Liebl et al., 2016) while only a few adopt SCF for the purpose of process simplification (Liebl et al., 2016).
Other edit edit source
Accountants will often require a legal opinion confirming that a true sale of the receivables has been achieved from a legal perspective before a transaction can be classified as off-balance sheet.[14]
https://www.huntonak.com/en/insights/true-sale-or-not-true-sale-that-is-the-question.html
In consequence, as one commentary put it, "defining true sale is the holy grail of the securitization market."
SABB launches new sharia-compliant inventory financing solution: https://www.gtreview.com/news/mena/sabb-launches-new-sharia-compliant-inventory-financing-solution/
SABB rolls out new sharia-compliant SCF product: https://www.gtreview.com/news/mena/sabb-rolls-out-new-sharia-compliant-scf-product/
https://thepaypers.com/e-invoicing-supply-chain-finance/liquidx-completes-first-sharia-transaction--775316
https://pitchbook.com/profiles/company/42924-88#timeline
References and notes edit edit source
- ↑ See for instance: TradeIX https://tradeix.com/ Rewiring Trade and Working Capital Finance.
- ↑ Brandi, C. and B. Schmitz, (2015).
- ↑ See: ICC. 2017. which notes that “Fintechs, many in startup phase, have identified significant opportunities in the financing of international trade, and have the potential to play an important role … [to] close, the global trade finance gap [of $1.6 trillion] because it is increasingly clear that banks will be unable to materially do so.”
- ↑ 6 See African Development Bank. Second Trade Finance in Africa Survey Report: Trade Finance in Africa: Overcoming Challenges. Cote D’Ivoire. 2017.
- ↑ Asmundson, I., Dorsey, et al. Trade and Trade Finance in the 2008-09 Financial Crisis. IMF WP/11/16 https://iccwbo.org/publication/global-survey-2018-securing-future-growth/: 251 banks participated in the 2018 Global Survey, from 91 countries.
- ↑ Without recourse means: without subsequent liability. As a legal term, it signifies that the finance provider (and not the seller) of an asset is assuming the risk of non-payment of the asset.
- ↑ World Economic Forum. 2015.
- ↑ This overall elevated collaboration between the parties to the financial transaction and the visibility of the underlying trade flows may be the reason why SCF outperforms traditional financing. Additionally, SCF is based on buyer-led financing (financing provided by large buyers to their smaller suppliers) rather than supplier-led financing. Once the supplier has agreed, the buyer approves the invoice, and a cascade of processes takes place on the SCF provider’s platform.
- ↑ This SCF program currently has various names; most commonly, “reverse factoring.” There may be slight differences in the execution of the programs.
- ↑ For instance: PrimeRevenue. What is Dynamic Discounting? https://primerevenue.com/what-is-dynamicdiscounting/.
- ↑ For instance: PrimeRevenue. “Supply Chain Finance 101 What is Supply Chain Finance?” https://primerevenue.com/what-is-supply-chain-finance/.
- ↑ To more accurately reflect the nature of certain items in the balance sheet, the prior year comparatives include the a reclassification of bank borrowings of £22,000 from Trade and other payables to Long-term borrowings. In addition, the prior year comparative deferred tax asset balance of £422,000 has been reclassified from Trade and other receivables to non-current assets to comply with IAS 1 (“Presentation of Financial Statements”.
- ↑ In addition, to better reflect the nature of certain cash flow items the prior year comparatives include a reclassification of bank borrowings of £22,000 from Trade and other payables to Long-term borrowings.
- ↑ https://www.simmons-simmons.com/en/publications/ck0alkdv2neex0b85znrdvrue/19-true-sale-of-receivables
