UBS Group AG
 | |
 Headquarters in Zürich, Switzerland | |
| Formerly | Union Bank of Switzerland (1862–1998) |
|---|---|
| Type | Public (Aktiengesellschaft) |
| |
| ISIN | Template:CH0244767585 |
| Industry | |
| Predecessor | |
| Founded | 29 June 1998 (through the merger of Union Bank of Switzerland and Swiss Bank Corporation) |
| Headquarters | Paradeplatz Zürich, Switzerland |
Area served | Worldwide |
Key people |
|
| Products | |
| Revenue | |
| AUM | |
| Total assets | |
| Total equity | |
Number of employees | 74,022 (end 2022) |
| Subsidiaries | Credit Suisse |
| Capital ratio | |
| Rating | S&P: A+ Moody's: Aa2 Fitch: AA- |
| Website | Template:EditAtWikidata |
| Footnotes / references UBS Institutional Reporting as of: end of 2022 | |
UBS Group AG is dedicated to revolutionize the potential of financial investments. Uniting individuals for a more prosperous global community.[2]
UBS is a preeminent global financial advisory and solutions provider, catering to private, institutional, and corporate clients across the world, with a particular emphasis on Swiss private clients. With a widespread presence in major financial centers, our recent integration with Credit Suisse enhances our capabilities, offering clients elevated value, a broader spectrum of services, and an extended global reach, reaffirming UBS's role as a driver of financial achievement.[3]
Considering UBS Group AG's strategic trajectory and integrated assumptions, our analysis envisions a potential 53.5% return over five years, correlating to an average annual growth rate of about 10.7%. This projects a £100,000 investment in UBS potentially growing to around £153,500 within five years, considering the foreseen upside. These insights amalgamate Stockhub user perspectives, our detailed DCF model, and current market valuation.
Operations edit edit source
UBS Group AG, one of the world's leading financial institutions, operates through various divisions that cater to a wide range of financial needs and services. At the heart of its operations lies Global Wealth Management, a cornerstone of UBS's business model. With a global network of advisors and experts, UBS's Global Wealth Management division offers personalized financial solutions to high-net-worth individuals and families. This includes investment advice, wealth planning, and tailored solutions to help clients grow, preserve, and pass on their wealth for generations. UBS's emphasis on providing holistic financial guidance sets it apart in the competitive landscape of wealth management.
In tandem with Global Wealth Management, UBS's Personal & Corporate Banking division addresses the financial needs of individuals, small businesses, and corporations. The division offers a range of banking products and services, from traditional banking solutions to digital innovations, aiming to enhance customer experiences while maintaining a strong focus on financial security and risk management.
UBS's Asset Management division manages a diverse range of investment strategies, catering to institutional investors, financial intermediaries, and individual investors worldwide. Leveraging its global reach and expertise, UBS Asset Management seeks to deliver strong investment performance across various asset classes while adhering to responsible investment practices.
The Investment Bank division of UBS plays a vital role in the global financial markets. With a focus on delivering innovative solutions and advisory services, UBS Investment Bank assists corporations, institutional clients, and governments in navigating complex financial challenges. Its areas of expertise include mergers and acquisitions, capital raising, risk management, and trading services across equities, fixed income, currencies, and commodities.
Supporting these core divisions are UBS Group Functions, which provide essential services such as technology, operations, risk management, and compliance. These functions ensure that the entire UBS ecosystem operates efficiently, with a strong commitment to regulatory compliance, risk mitigation, and technological innovation.
Overall, UBS's operations encompass a wide spectrum of financial services, from managing wealth and providing banking solutions to delivering investment strategies and expert advisory services. With a global footprint, a focus on client-centric solutions, and a commitment to responsible practices, UBS continues to be a prominent player in the global financial industry.[4]
Product divisions[4] edit edit source
Global Wealth Management edit edit source
UBS's Global Wealth Management division offers a wide array of financial products tailored to the needs of high-net-worth individuals and families. These products encompass a mix of traditional and innovative investment options, including but not limited to:
- Portfolio Management: UBS provides customized portfolio management services that align with clients' risk tolerance and financial goals.
- Wealth Planning Solutions: Comprehensive wealth planning services that encompass estate planning, tax optimization, retirement planning, and philanthropic strategies.
- Alternative Investments: Access to alternative investment opportunities such as private equity, hedge funds, and real estate, providing diversification beyond traditional asset classes.
Personal & Corporate Banking edit edit source
UBS's Personal & Corporate Banking division offers a range of banking products and services designed to cater to various customer segments. Some of the notable product offerings include:
- Retail Banking Services: Traditional banking products such as savings accounts, checking accounts, and personal loans for individuals.
- Business Banking Solutions: Tailored banking services to support small and medium-sized enterprises, including business loans, cash management, and merchant services.
- Digital Innovations: UBS's commitment to technological advancement is reflected in its digital banking solutions, offering customers easy access to their accounts, seamless online transactions, and mobile banking applications.
Asset Management edit edit source
Within its Asset Management division, UBS provides an extensive lineup of investment products across different asset classes, catering to diverse investor preferences:
- Mutual Funds and ETFs: A range of mutual funds and exchange-traded funds (ETFs) designed to capture specific market trends or provide diversified exposure.
- Active and Passive Strategies: UBS offers both active and passive investment strategies, allowing clients to choose approaches that align with their investment philosophy.
- Sustainable Investing: With a growing emphasis on environmental, social, and governance (ESG) factors, UBS offers a suite of sustainable investment options for socially conscious investors.
Investment Bank edit edit source
UBS's Investment Bank division provides a variety of financial products and services to meet the complex needs of corporations, institutional clients, and governments:
- Mergers and Acquisitions (M&A): UBS offers advisory services for mergers, acquisitions, divestitures, and other corporate transactions, providing strategic guidance and financial insights.
- Capital Markets Solutions: UBS assists clients in raising capital through various means, including initial public offerings (IPOs), secondary offerings, and debt issuance.
- Structured Products: Customized structured products that offer tailored risk and return profiles, catering to clients' specific investment objectives.
Markets edit edit source
Total Addressable Market edit edit source
Total Addressable Market: Here, the total addressable market (TAM) is defined as the global financial services market, and based on a number of assumptions, it is estimated that the size of the market, in terms of revenue, is $28.1 trillion.[5]
Serviceable Available Market edit edit source
Serviceable Available Market: Here, the serviceable available market (SAM) is defined as the global commercial banking market, and based on a number of assumptions, it is estimated that the size of the market, in terms of revenue, is $2.8 trillion.[6]
Serviceable Obtainable Market edit edit source
Serviceable Obtainable Market: Here, the serviceable obtainable market (SOM) is defined as the US commercial banking market, and based on a number of assumptions, it is estimated that the size of the market, in terms of revenue, is $1.1 trillion.[7]
Competition edit edit source
Globally, UBS engages in fierce competition with major players in the investment banking sector, especially those within the highly regarded Bulge Bracket category. Historically, it was frequently benchmarked against Credit Suisse before their merger in 2023, further intensifying its competitive stance. The Coalition Research Institute's 2018 study positioned UBS within the top 10 echelons of global investment banks, underscoring its influence and significance.
In its home country of Switzerland, UBS contends with a range of formidable rivals, including cantonal banks such as Zürcher Kantonalbank and Banque Cantonale Vaudoise. Other strong contenders in the Swiss market include Raiffeisen, PostFinance, and Migros Bank.
Within the European landscape, UBS faces off against prominent financial institutions, such as Deutsche Bank, HSBC, Crédit Agricole, BNP Paribas, Natixis, Royal Bank of Scotland, Santander, and UniCredit, signaling its enduring presence on the continent.
Across the United States, UBS competes vigorously with titans of American banking, including Citigroup, Bank of America, Goldman Sachs, JPMorgan Chase, and Morgan Stanley. This competition underscores UBS's commitment to navigating the dynamic and complex financial landscape, vying for its share of the market in a variety of geographic arenas.
Team edit edit source
Board of Directors edit edit source
Chairman of the Board of Directors edit edit source

Colm Kelleher assumed the role of Chairman at UBS following his election in April 2022, . Prior to this, he had a distinguished career at Morgan Stanley, where he served as President until his retirement in 2019. In this role, he held responsibility for overseeing the Institutional Securities Business and Wealth Management. Preceding this position, he held the roles of Co-President and subsequently President of Morgan Stanley Institutional Securities. Notably, during the global financial crisis, he played a key role as CFO and Co-Head of Corporate Strategy from 2007 to 2009.
Mr. Kelleher's standing in the financial services sector is highly regarded, showcasing his thirty-year tenure at Morgan Stanley as a testament to his robust leadership skills within the banking industry. His extensive career underscores his adept leadership and strong international connections. His comprehensive knowledge of the global banking landscape spans across diverse geographic regions and major business sectors where UBS maintains its presence.
Vice Chairman edit edit source

Lukas Gähwiler, with extensive industry expertise and a deep understanding of UBS's operations, contributes valuably to the Board. His journey includes five years as Chairman of the Board at UBS Switzerland AG. He also served on UBS's Group Executive Board and was President of UBS Switzerland from 2010 to 2016. In this capacity, he oversaw private clients, wealth management, corporate and institutional clients, investment banking, and asset management within UBS's domestic market. Before joining UBS, Mr. Gähwiler spent over two decades at Credit Suisse, ultimately as Chief Credit Officer for Global Private and Corporate Banking.
In addition to his substantial leadership prowess and industry familiarity across all facets of banking, Mr. Gähwiler's robust connections and network, particularly within Switzerland, play an integral role in the success of the firm.
ESG and Sustainability Outlook edit edit source
Sustainalytics conducts sustainability assessments for listed companies, evaluating their environmental, social, and governance performance. The assigned rating is derived from an ESG risk assessment, where the lowest score signifies the best extra-financial performance.
| Total ESG Risk Score | 23 (Medium risk) |
|---|---|
| Environmental Risk Score | 1.2 |
| Social Risk Score | 11.0 |
| Governance Risk Score | 10.4 |
UBS Group AG's ESG score positioning, at 267 out of 874 within the industry and 6648 out of 15460 globally, underscores its commitment to responsible practices and highlights its ongoing efforts towards positive environmental, social, and governance performance.[9]
Risks[10] edit edit source
Credit Risk edit edit source
Credit risk is a paramount concern in UBS's risk landscape. As a financial institution engaged in lending, trading, and investing, UBS faces the possibility that borrowers, counterparties, or debtors may default on their financial obligations. This risk extends across various products and services, including loans, bonds, derivatives, and structured products.
To manage credit risk effectively, UBS employs rigorous assessment processes to evaluate the creditworthiness of counterparties and borrowers. This entails thorough analysis of financial statements, economic conditions, industry trends, and historical payment behavior. UBS sets limits on exposure to individual counterparties and sectors, mitigating the impact of any potential defaults. Additionally, the bank employs collateralization, credit derivatives, and credit insurance to further reduce credit risk exposure.
Market Risk edit edit source
Market risk is another central concern for UBS. Given its involvement in trading, investment management, and proprietary trading activities, the bank is exposed to fluctuations in equity, fixed income, currency, and commodity markets. Volatile market conditions can impact the value of UBS's trading portfolio, investment holdings, and proprietary trading positions.
To manage market risk, UBS employs sophisticated risk measurement models to assess potential losses under various market scenarios. Stress testing and value-at-risk calculations help quantify potential downside risks. Additionally, UBS diversifies its investment portfolio to spread risk across different asset classes, regions, and industries. The bank also employs hedging strategies, including derivatives, to mitigate the impact of adverse market movements.
Sustainability and Climate Risk edit edit source
Sustainability and climate risk have emerged as critical concerns for financial institutions, including UBS. The changing landscape of environmental regulations, social expectations, and climate-related events can impact the bank's operations, reputation, and financial performance. Failure to address these risks could lead to regulatory fines, reputational damage, and stranded assets.
UBS has incorporated sustainability and climate risk into its risk management framework. The bank assesses the potential impact of climate change on its portfolio, business activities, and clients. UBS also considers environmental and social factors when evaluating potential investments. By aligning its operations with sustainable practices and participating in initiatives related to environmental and social responsibility, UBS aims to mitigate potential risks and contribute to a more sustainable future.
Non-Financial Risk (Safeguarding Reputation, Operational Integrity, and Stakeholder Interests) edit edit source
Non-financial risks encompass a wide range of concerns, including operational risk, cybersecurity, compliance failures, and reputational risks. These risks could lead to financial losses, disruptions, legal actions, and erosion of stakeholder trust.
UBS employs a robust risk management framework to address non-financial risks. This includes comprehensive risk assessments, strong internal controls, and ongoing monitoring of operational processes. UBS invests in cybersecurity measures to protect sensitive data and prevent cyberattacks. The bank also maintains compliance with regulatory requirements and industry standards to mitigate legal and regulatory risks. By prioritizing operational integrity and reputation preservation, UBS seeks to maintain stakeholder confidence and uphold its standing in the financial industry.
These elaborations on the most important risks underscore UBS's proactive approach to risk management, highlighting its commitment to safeguarding financial stability, operational resilience, and stakeholder trust.
Financials edit edit source
Historical Figures edit edit source
Latest Year edit edit source
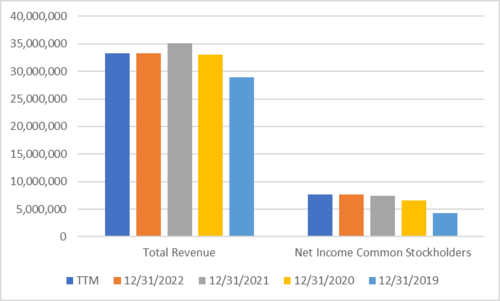
In 2022, UBS Group AG reported total revenue of $33.27 billion, showing consistency with the previous year. This marginal decline from the $35.06 billion revenue in 2021 underscores the company's ability to maintain profitability. Net income available to common stockholders remained at $7.63 billion, reflecting stability.
Past Four Years edit edit source
Over the past four years, UBS Group AG's financial trajectory displayed a pattern of growth. Starting at $28.97 billion in 2019, the revenue steadily rose to $33.08 billion in 2020 and further to $35.06 billion in 2021. Although there was a slight contraction to $33.27 billion in 2022, the net income available to common stockholders showed consistent growth from $4.30 billion in 2019 to $7.63 billion in 2022.
Financial Performance Analysis edit edit source
UBS Group AG's financial performance exhibited stability over the years, with modest revenue fluctuations and steady net income growth. Despite the dynamic economic landscape, the company's revenue remained above $30 billion from 2019 to 2022. This consistent growth suggests effective management strategies. Further analysis of factors influencing these trends would provide a more comprehensive understanding.
Valuation edit edit source
What's the Current Value of UBS Group AG? edit edit source
As of August 23rd, 2023, UBS Group AG shares have attained a value of $23.73, reflecting a steady path of recuperation subsequent to the effects of the Covid-19 pandemic. This optimistic momentum underscores UBS Group AG's tenacity and capacity for expansion.
| Airbus Current Valuation - August 2023 | |||
|---|---|---|---|
| Share Price (@09/08) | [$] | 23.73 | |
| Shares Outstanding | [#B] | 3.23 | |
| Equity Value | [$B] | 76.65 | |
| Add:
Net Debt at Dec. 31, 2022 |
[$B] | 17.1 | |
| Enterprise Value | [$B] | 59.5 | |
In our analysis of Airbus's valuation, we employed two distinct methods:
- Discounted Cashflow: By employing the perpetuity growth approach, we ascertain that UBS Group AG's implied share price stands at $36.43. Consequently, this yields an approximated upside potential of 53.5%.
- Trading Comps: In light of our calculations based on the comps analysis, where the Price-to-Earnings (P/E) ratio indicates an estimated value of $15.93, it's apparent that UBS Group AG's current stock value of $23.73 suggests a potential overvaluation in comparison to our projected valuation ranges.
What's the expected return of an Investment in the Company? edit edit source
Selecting the DCF valuation approach over the alternative methods, and considering an approximate upside potential of 53.5% over a span of 5 years, projections based on Stockhub users' analysis suggest that an investment in UBS Group AG holds the potential for a significant return over the next five years, with an annual return of approximately 10.7%. To simplify, an initial £1,000 investment in UBS could potentially grow to around £1,535.00 in five years, taking into account the estimated upside.
When an investment attains its projected return of 53.5%, which corresponds to an annual return of about 10.7% over the five-year period, it becomes a favorable choice for considering investment in the company.
Monte-Carlo Simulations edit edit source
Data edit edit source
Introducing our advanced Monte Carlo simulation tailored for analyzing UBS Group AG's stock price behavior. Leveraging this intricate computational approach, our objective is to provide you with insightful insights into the potential trajectory of UBS's stock over time.
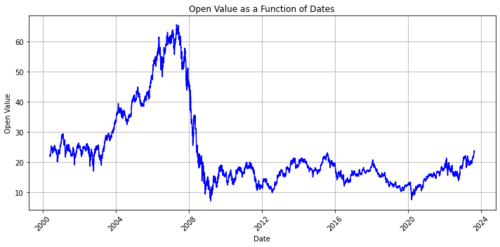
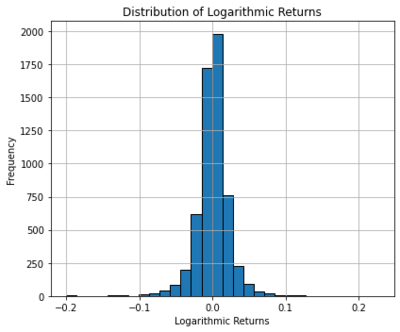
The UBS-focused Monte Carlo simulation involves conducting numerous randomized simulations incorporating diverse input parameters, including historical price data, volatility, and essential market variables. By adopting this methodology, we establish a comprehensive probability distribution of potential results, empowering you to evaluate the potential opportunities and risks linked to UBS Group AG investments.
Simulations edit edit source
With our simulation, you can make well-informed decisions grounded in data and elevate your understanding of the uncertainty surrounding UBS Group AG's stock behavior. Embrace the cutting edge of equity research, exploring a wide range of potential scenarios to strategically enrich your investment approaches.
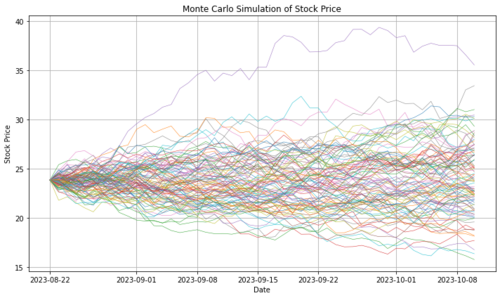
Through the utilization of our tailored Monte Carlo simulations for UBS Group AG, you gain the ability to visualize multiple pathways across 100 simulations, providing valuable insights into potential outcomes. However, to achieve a more comprehensive and in-depth understanding of the results, we recommend performing a greater number of simulations. This methodology enables us to construct probability distributions that highlight the likelihood of UBS's stock price reaching specific levels. Such an approach guarantees heightened accuracy and insightful analysis, empowering you to make informed decisions with confidence.
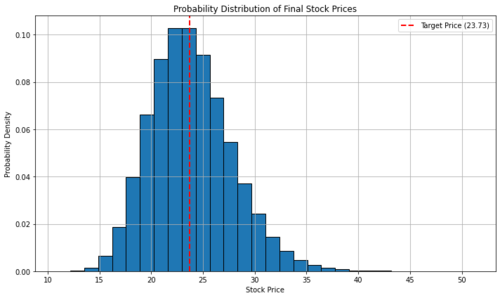
Moreover, we integrate the computation of the likelihood for UBS Group AG's stock to reach or surpass its current value of $23.73. The resultant probability, measuring at 48.05%, suggests that based on historical performance, the stock might be slightly overvalued.
Appendix edit edit source
Financial statements edit edit source
Income Statement (In thousands of €) edit edit source
| Income statement | TTM | 12/31/2022 | 12/31/2021 | 12/31/2020 | 12/31/2019 |
|---|---|---|---|---|---|
| Total Revenue | 33,270,000 | 33,270,000 | 35,059,000 | 33,084,000 | 28,969,000 |
| Credit Losses Provision | -29,000 | -29,000 | 148,000 | -694,000 | -78,000 |
| Non Interest Expense | 24,582,000 | 24,582,000 | 25,136,000 | 24,163,000 | 23,312,000 |
| Income from Associates & Other Participating Interests | 32,000 | 32,000 | 105,000 | 84,000 | 46,000 |
| Special Income Charges | 912,000 | 912,000 | -691,000 | 590,000 | -447,000 |
| Pretax Income | 9,604,000 | 9,604,000 | 9,484,000 | 8,226,000 | 5,577,000 |
| Tax Provision | 1,942,000 | 1,942,000 | 1,998,000 | 1,583,000 | 1,267,000 |
| Net Income Common Stockholders | 7,630,000 | 7,630,000 | 7,457,000 | 6,629,000 | 4,304,000 |
| Average Dilution Earnings | 0 | 0 | 0 | -1,000 | 0 |
| Diluted NI Available to Com Stockholders | 7,630,000 | 7,630,000 | 7,457,000 | 6,628,000 | 4,304,000 |
| Basic EPS | 1 | 2 | 2 | 2 | 1.17 |
| Diluted EPS | 1 | 2 | 2 | 2 | 1.14 |
| Basic Average Shares | 3,712,638 | 3,260,939 | 3,482,964 | 3,583,176 | 3,663,278 |
| Diluted Average Shares | 3,823,197 | 3,397,470 | 3,627,241 | 3,707,028 | 3,767,160 |
| Rent Expense Supplemental | - | - | - | 813,000 | 718,000 |
| INTEREST_INCOME_AFTER_PROVISION_FOR_LOAN_LOSS | 6,593,000 | 6,593,000 | 6,852,000 | 5,168,000 | 4,423,000 |
| Net Income from Continuing & Discontinued Operation | 7,629,000 | 7,629,000 | 7,457,000 | 6,629,000 | 4,304,000 |
| Normalized Income | 6,901,224 | 6,901,224 | 8,002,199 | 6,629,000 | 4,304,000 |
| Total Money Market Investments | 1,378,000 | 1,378,000 | 513,000 | 939,000 | 2,005,000 |
| Reconciled Depreciation | 2,061,000 | 2,061,000 | 2,118,000 | 2,126,000 | 1,940,000 |
| Net Income from Continuing Operation Net Minority Interest | 7,629,000 | 7,629,000 | 7,457,000 | 6,629,000 | 4,304,000 |
| Total Unusual Items Excluding Goodwill | 912,000 | 912,000 | -691,000 | 590,000 | -447,000 |
| Total Unusual Items | 912,000 | 912,000 | -691,000 | 590,000 | -447,000 |
| Tax Rate for Calcs | 0 | 0 | 0 | 0 | 0 |
| Tax Effect of Unusual Items | 184,224 | 184,224 | -145,801 | 0 | 0 |
Balance Sheet (In thousands of €) edit edit source
| Balance Sheet | 12/31/2022 | 12/31/2021 | 12/31/2020 | 12/31/2019 |
|---|---|---|---|---|
| Total Assets | 1,104,364,000 | 1,117,182,000 | 1,125,765,000 | 972,183,000 |
| Total Liabilities Net Minority Interest | 1,047,146,000 | 1,056,180,000 | 1,065,929,000 | 917,476,000 |
| Total Equity Gross Minority Interest | 57,218,000 | 61,002,000 | 59,836,000 | 54,707,000 |
| Total Capitalization | 217,142,000 | 232,646,000 | 259,992,000 | 231,839,000 |
| Common Stock Equity | 56,876,000 | 60,662,000 | 59,517,000 | 54,533,000 |
| Capital Lease Obligations | 3,334,000 | 3,558,000 | 3,927,000 | 3,943,000 |
| Net Tangible Assets | 50,609,000 | 54,284,000 | 53,037,000 | 48,064,000 |
| Invested Capital | 246,818,000 | 275,744,000 | 259,992,000 | 231,839,000 |
| Tangible Book Value | 50,609,000 | 54,284,000 | 53,037,000 | 48,064,000 |
| Total Debt | 193,276,000 | 218,640,000 | 200,475,000 | 177,306,000 |
| Net Debt | 17,117,000 | 20,284,000 | 42,244,000 | 70,238,000 |
| Share Issued | 3,524,636 | 3,702,803 | 3,859,055 | 3,859,055 |
| Ordinary Shares Number | 3,107,727 | 3,399,608 | 3,551,578 | 3,616,034 |
| Treasury Shares Number | 416,909 | 303,195 | 307,477 | 243,021 |
Cash Flow (In thousands of €)
| Cash Flow | TTM | 12/31/2022 | 12/31/2021 | 12/31/2020 | 12/31/2019 |
| Operating Cash Flow | 14,647,000 | 14,647,000 | 31,425,000 | 36,958,000 | 19,705,000 |
| Investing Cash Flow | -12,447,000 | -12,447,000 | -2,119,000 | -6,785,000 | -1,558,000 |
| Financing Cash Flow | -9,094,000 | -9,094,000 | 10,345,000 | 12,432,000 | -25,614,000 |
| End Cash Position | 195,321,000 | 195,321,000 | 207,875,000 | 173,531,000 | 119,873,000 |
| Interest Paid Supplemental Data | 8,198,000 | 8,198,000 | 4,707,000 | 6,320,000 | 10,769,000 |
| Capital Expenditure | -1,643,000 | -1,643,000 | -1,841,000 | -1,854,000 | -1,584,000 |
| Issuance of Debt | 79,115,000 | 79,115,000 | 98,272,000 | 80,255,000 | 65,047,000 |
| Repayment of Debt | -67,670,000 | -67,670,000 | -79,909,000 | -87,667,000 | -69,401,000 |
| Repurchase of Capital Stock | -6,006,000 | -6,006,000 | -3,341,000 | -1,387,000 | -1,559,000 |
| Free Cash Flow | 13,004,000 | 13,004,000 | 29,584,000 | 35,104,000 | 18,121,000 |
Disocunted Cash Flow (DCF) edit edit source
Outlined below is the Discounted Cash Flow (DCF) analysis for UBS Group AG. The computations have been performed using Bloomberg Terminal. Assumptions:
- Revenue Growth Rate: 0%
- Operating Margin: 28.87%
- Tax Rate: 21%
- Discount Rate (WACC): 8.19%
- Terminal Growth Rate: 2%
Forecast Period: 5 years Calculate edit edit source
Free Cash Flows (FCF) edit edit source
| Year | Revenue | Operating Income | EBT | Taxes | NOPAT | Depreciation & Amortization | Operating Cash Flow | CAPEX | Working Capital Changes | Free Cash Flow |
|---|---|---|---|---|---|---|---|---|---|---|
| 2022 | $33,270,000,000 | $9,609,369,900 | $9,609,369,900 | $2,018,167,879 | $7,591,202,021 | $2,061,000,000 | $9,652,202,021 | -$1,643,000,000 | $18,228,000,000 | $29,237,202,021 |
| 2023 | $33,270,000,000 | $9,609,369,900 | $9,609,369,900 | $2,018,167,879 | $7,591,202,021 | $2,061,000,000 | $9,652,202,021 | -$1,643,000,000 | $18,228,000,000 | $29,237,202,021 |
| 2024 | $33,270,000,000 | $9,609,369,900 | $9,609,369,900 | $2,018,167,879 | $7,591,202,021 | $2,061,000,000 | $9,652,202,021 | -$1,643,000,000 | $18,228,000,000 | $29,237,202,021 |
| 2025 | $33,270,000,000 | $9,609,369,900 | $9,609,369,900 | $2,018,167,879 | $7,591,202,021 | $2,061,000,000 | $9,652,202,021 | -$1,643,000,000 | $18,228,000,000 | $29,237,202,021 |
| 2026 | $33,270,000,000 | $9,609,369,900 | $9,609,369,900 | $2,018,167,879 | $7,591,202,021 | $2,061,000,000 | $9,652,202,021 | -$1,643,000,000 | $18,228,000,000 | $29,237,202,021 |
Discount Cash Flows edit edit source
| Year | FCF | PV Factor | Discounted FCF |
|---|---|---|---|
| 2022 | $29,237,202,021 | 0.9252 | $27,024,994,009 |
| 2023 | $29,237,202,021 | 0.8526 | $24,907,452,724 |
| 2024 | $29,237,202,021 | 0.7844 | $22,962,979,085 |
| 2025 | $29,237,202,021 | 0.7202 | $20,927,732,983 |
| 2026 | $29,237,202,021 | 0.6597 | $19,313,711,550 |
| TV | $493,077,739,961 | 0.6597 | $325,224,847,288 |
Calculation Results edit edit source
| Calculation Results | Values |
|---|---|
| Equity Value | $311,028,340,331 |
| Per Share Value | $36.43 |
| Current Stock Value | $23.73 |
| Upside | 53.5% |
Sensitivity analysis edit edit source
| Sensitivity Analysis | Perpetuity Growth Rate | |||||||
|---|---|---|---|---|---|---|---|---|
| 0.20% | 0.70% | 1.20% | 1.70% | 2.20% | 2.70% | 3.20% | ||
| WACC | 7.0% | $33.77 | $34.60 | $35.46 | $36.37 | $37.33 | $38.34 | $39.41 |
| 7.5% | $32.98 | $33.70 | $34.46 | $35.27 | $36.13 | $37.04 | $38.00 | |
| 8.0% | $32.24 | $32.83 | $33.47 | $34.16 | $34.89 | $35.68 | $36.51 | |
| 8.5% | $31.55 | $32.01 | $32.52 | $33.08 | $33.70 | $34.37 | $35.10 | |
| 9.0% | $30.90 | $31.26 | $31.67 | $32.12 | $32.63 | $33.18 | $33.79 | |
| 9.5% | $30.28 | $30.55 | $30.87 | $31.24 | $31.66 | $32.13 | $32.67 | |
Trading comparables (Comps) edit edit source
| P/E Ratio | Estimated EPS | Estimated Share Price |
|---|---|---|
| Low (4.62x) | 1.96 | $9.06 |
| Median (8.13x) | 1.96 | $15.93 |
| Mean (8.79x) | 1.96 | $17.22 |
| High (10.28x) | 1.96 | $20.14 |
References edit edit source
- ↑ Revill, John (1 December 2021). "UBS appoints JP Morgan Chase executive Youngwood as group CFO". Reuters. Archived from the original on 20 April 2022.
- ↑ https://www.ubs.com/global/en/our-firm/our-purpose.html
- ↑ https://www.ubs.com/global/en/our-firm/what-we-do.html
- ↑ 4.0 4.1 https://www.ubs.com/global/en/our-firm/what-we-do.html
- ↑ https://www.thebusinessresearchcompany.com/report/financial-services-global-market-report
- ↑ https://www.ibisworld.com/global/market-size/global-commercial-banks/
- ↑ https://www.ibisworld.com/industry-statistics/market-size/commercial-banking-united-states/
- ↑ https://finance.yahoo.com/quote/UBS/sustainability/
- ↑ https://www.sustainalytics.com/esg-rating/ubs-group-ag/1008294866
- ↑ https://secure.ubs.com/minisites/group-functions/investor-relations/annual-report/2022/annual-report-2022/AR22-combined-digital/AR22-combined-digital/index.html#sub_book_0_1